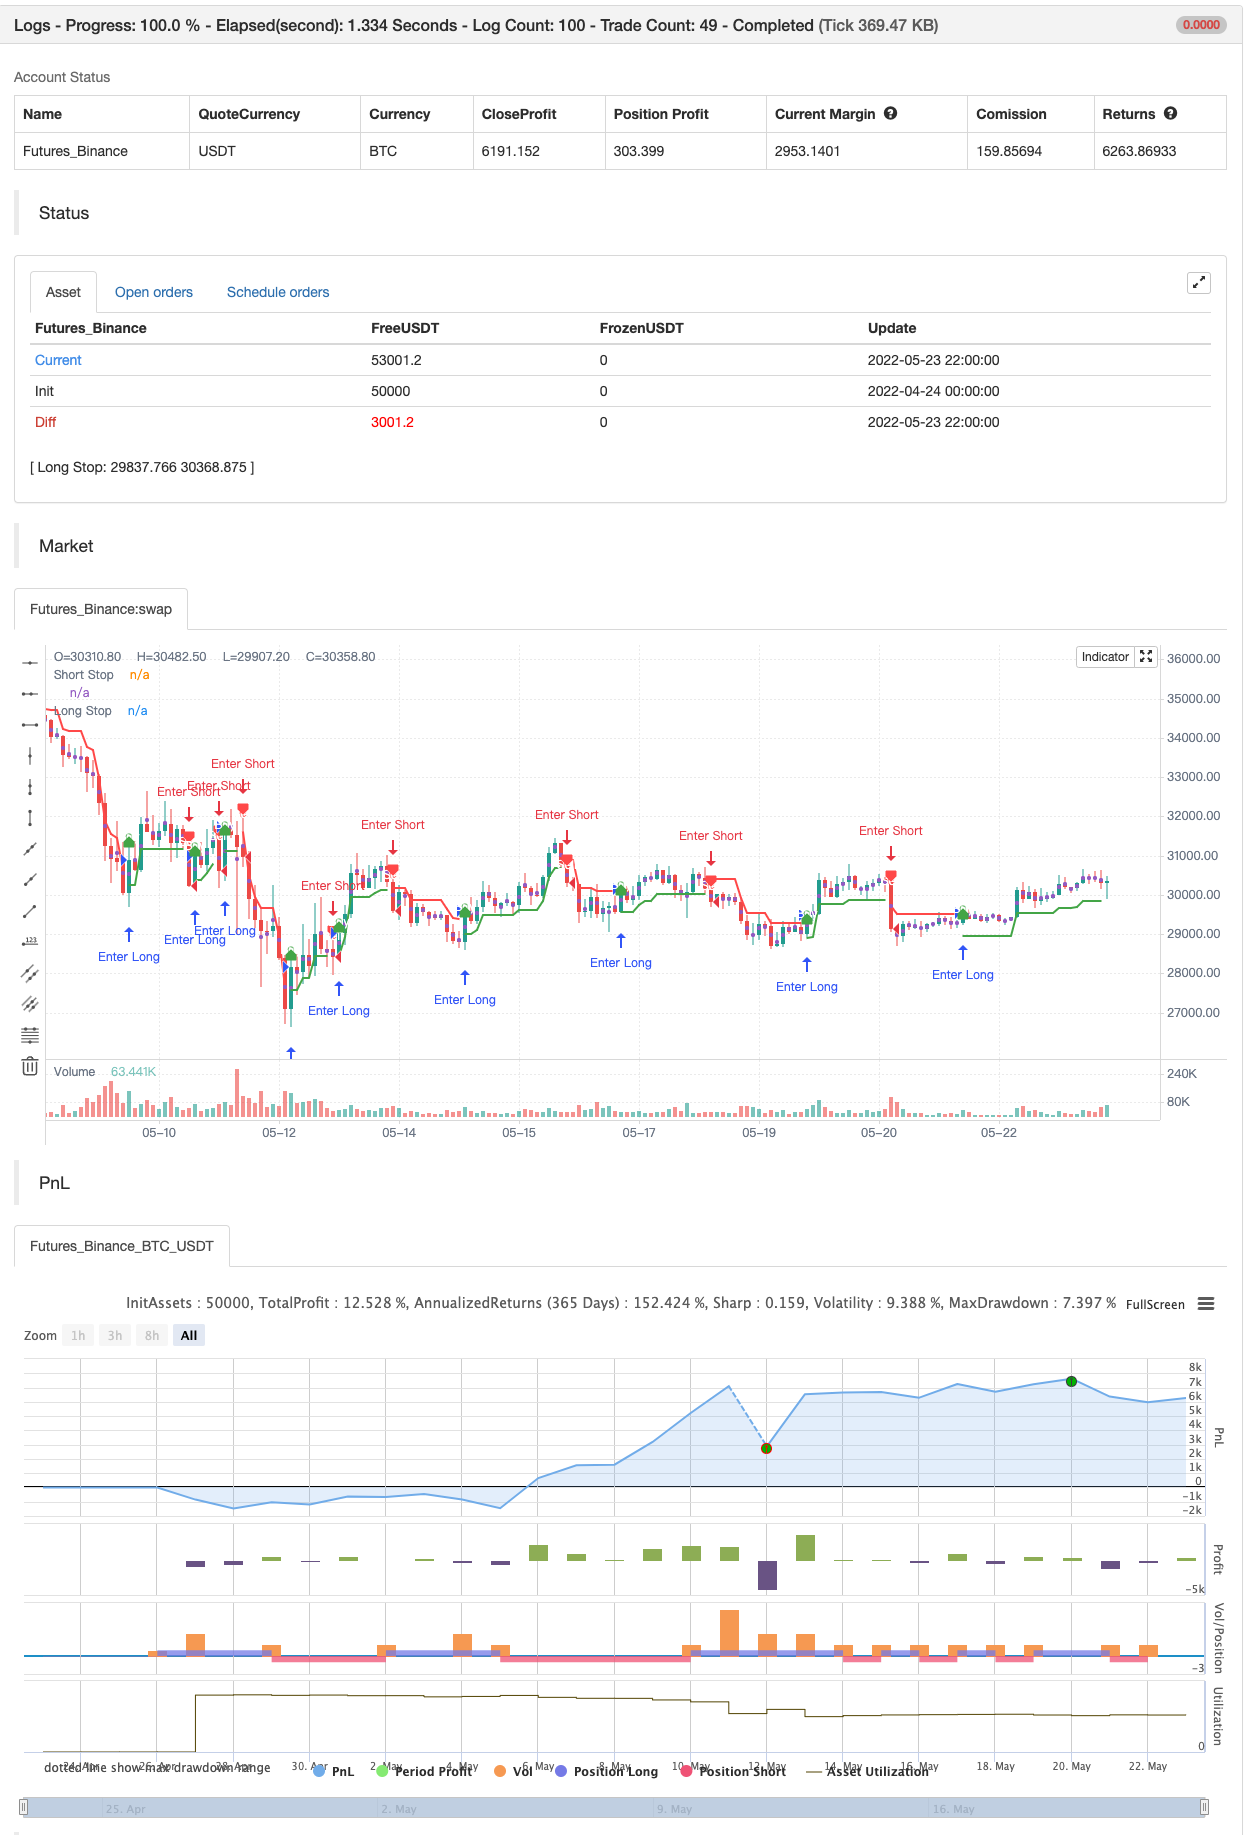
نِک رِپاک ٹریلنگ ریورس (NRTR)
مصنف:چاؤ ژانگ، تاریخ: 2022-05-25 18:14:32ٹیگز:این آر ٹی آر
یہ اشارے 2001 میں کونسٹنٹین کوپیرکن نے ایجاد کیا تھا۔
کوپیرکن -> کوپیر کن -> کن کوپیر -> نیک ریپوک
اشارے کا خیال چانڈلیئر ایگزٹ سے ملتا جلتا ہے ، لیکن اس میں اے ٹی آر جزو شامل نہیں ہے اور اس کی بجائے فیصد استعمال ہوتا ہے۔
این آر ٹی آر کا حساب لگانے کے لئے متحرک قیمت چینل کا استعمال کیا جاتا ہے۔ حساب کتاب میں صرف وہ قیمتیں شامل ہیں جو موجودہ رجحان میں شامل ہیں اور پچھلے رجحان سے متعلق انتہا پسندی کو خارج کرتے ہیں۔ اشارے ہمیشہ قیمتوں کے ذریعہ حاصل کردہ انتہا پسندی (فیصد میں) سے ایک ہی فاصلے پر ہوتا ہے (موجودہ اپ ٹرینڈ کے لئے زیادہ سے زیادہ چوٹی سے نیچے ، موجودہ ڈاؤن ٹرینڈ کے لئے کم سے کم نیچے سے اوپر) ۔
بیک ٹسٹ

/*backtest
start: 2022-04-24 00:00:00
end: 2022-05-23 23:59:00
period: 2h
basePeriod: 15m
exchanges: [{"eid":"Futures_Binance","currency":"BTC_USDT"}]
*/

//@version=4
// Copyright (c) 2021-present, Alex Orekhov (everget)
study("Nick Rypock Trailing Reverse", shorttitle="NRTR", overlay=true)

k = input(title="Coefficient of Correction, %", type=input.float, minval=0, maxval=100, step=0.1, defval=2)
showLabels = input(title="Show Buy/Sell Labels ?", type=input.bool, defval=true)
applyRibbon = input(title="Apply Ribbon ?", type=input.bool, defval=true)

var int trend = 0
var float hp = close
var float lp = close
float nrtr = close

percentage = k * 0.01

if trend >= 0
	if close > hp
		hp := close
		hp
	nrtr := hp * (1 - percentage)
	if close <= nrtr
		trend := -1
		lp := close
		nrtr := lp * (1 + percentage)
		nrtr
else
	if close < lp
		lp := close
		lp
	nrtr := lp * (1 + percentage)
	if close > nrtr
		trend := 1
		hp := close
		nrtr := hp * (1 - percentage)
		nrtr

var color longColor = color.green
var color shortColor = color.red
var color textColor = color.white

longStopPlot = plot(trend == 1 ? nrtr : na, title="Long Stop", style=plot.style_linebr, linewidth=2, color=longColor)
buySignal = trend == 1 and trend[1] == -1
plotshape(buySignal ? nrtr : na, title="Long Stop Start", location=location.absolute, style=shape.circle, size=size.tiny, color=longColor, transp=0)
plotshape(buySignal and showLabels ? nrtr : na, title="Buy Label", text="Buy", location=location.absolute, style=shape.labelup, size=size.tiny, color=longColor, textcolor=textColor, transp=0)

shortStopPlot = plot(trend == 1 ? na : nrtr, title="Short Stop", style=plot.style_linebr, linewidth=2, color=shortColor)
sellSignal = trend == -1 and trend[1] == 1
plotshape(sellSignal ? nrtr : na, title="Short Stop Start", location=location.absolute, style=shape.circle, size=size.tiny, color=shortColor, transp=0)
plotshape(sellSignal and showLabels ? nrtr : na, title="Sell Label", text="Sell", location=location.absolute, style=shape.labeldown, size=size.tiny, color=shortColor, textcolor=textColor, transp=0)

midPricePlot = plot(ohlc4, title="", style=plot.style_circles, linewidth=0, display=display.none, editable=false)

longFillColor = applyRibbon ? (trend == 1 ? longColor : na) : na
shortFillColor = applyRibbon ? (trend == -1 ? shortColor : na) : na
fill(midPricePlot, longStopPlot, title="Long Ribbon", color=longFillColor)
fill(midPricePlot, shortStopPlot, title="Short Ribbon", color=shortFillColor)

changeCond = trend != trend[1]
alertcondition(changeCond, title="Alert: NRTR Direction Change", message="NRTR has changed direction!")
alertcondition(buySignal, title="Alert: NRTR Buy", message="NRTR Buy!")
alertcondition(sellSignal, title="Alert: NRTR Sell", message="NRTR Sell!")


if buySignal
    strategy.entry("Enter Long", strategy.long)
else if sellSignal
    strategy.entry("Enter Short", strategy.short)
متعلقہ
مزید
- خرید/فروخت کے ساتھ EMA ADX RSI کا اسکیلپنگ
- حجم کا فرق
- سپر ٹرینڈ ڈیلی 2.0 BF
- ہل منتقل اوسط سوئنگ ٹریڈر
- FTSMA - رجحان آپ کا دوست ہے
- رینج فلٹر خریدیں اور فروخت کریں
- ایس ایس ایل چینل
- ہل سویٹ حکمت عملی
- پیرابولک SAR خریدیں اور فروخت کریں
- پییوٹ پر مبنی ٹریلنگ زیادہ سے زیادہ اور کم سے کم
- ZigZag PA حکمت عملی V4.1
- دن کے اندر خرید/فروخت
- ٹوٹا ہوا فریکٹل: کسی کا ٹوٹا ہوا خواب آپ کا منافع ہے!
- منافع بڑھانے والا PMax
- ناقص فتح کی حکمت عملی
- اسٹوکاسٹک + آر ایس آئی، ڈبل حکمت عملی
- سوئنگ ہول/آر ایس آئی/ای ایم اے حکمت عملی
- اسکیلپنگ سوئنگ ٹریڈنگ ٹول R1-4
- بہترین نگلنگ + بریک آؤٹ حکمت عملی
- بولنگر زبردست الرٹ R1