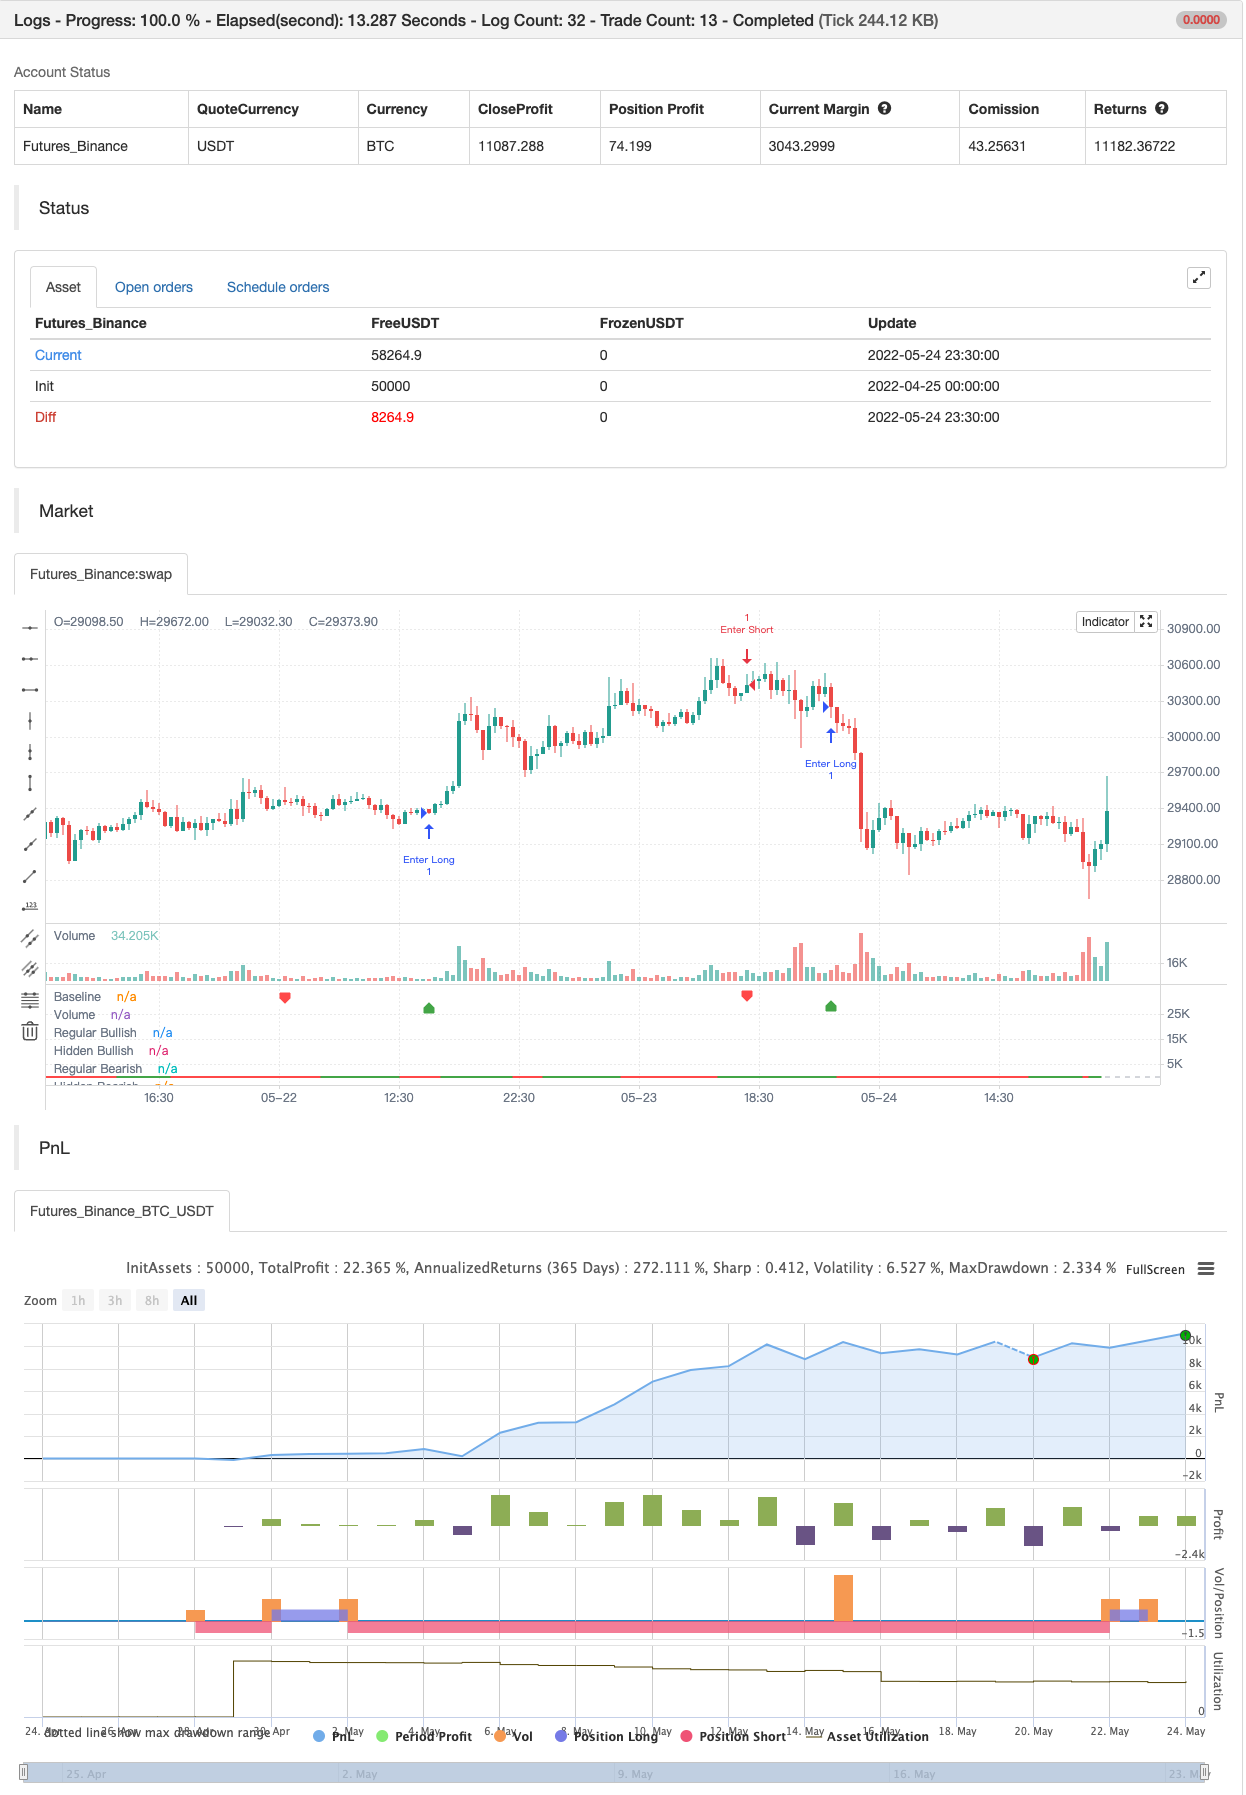
حجم کا فرق
مصنف:چاؤ ژانگ، تاریخ: 2022-05-26 17:04:32ٹیگز:ڈبلیو ایم اےمحور
یہ ایک سادہ حجم اشارے ہے۔ آپ کو حجم کے اوپر اور حجم کے نیچے دونوں رجحان پر وقفے دیکھنا چاہئے۔ یہ حجم کے ہموار چلنے والے اوسط کی تعمیر کے لئے فبونیکی نمبر استعمال کرتا ہے۔
اس کے علاوہ آپ رجحان کی تبدیلی اور رفتار کے نقصان کے لئے اختلافات کی جانچ پڑتال کر سکتے ہیں.
بیک ٹسٹ

/*backtest
start: 2022-04-25 00:00:00
end: 2022-05-24 23:59:00
period: 30m
basePeriod: 15m
exchanges: [{"eid":"Futures_Binance","currency":"BTC_USDT"}]
*/

// This source code is subject to the terms of the Mozilla Public License 2.0 at https://mozilla.org/MPL/2.0/
// © baymucuk

//@version=4
study(title="Volume Divergence by MM", shorttitle="Volume Divergence", format=format.volume)

pine_wma(x, y) =>
    norm = 0.0
    sum = 0.0
    for i = 0 to y - 1
        weight = (y - i) * y
        norm := norm + weight
        factor = close[i] < open[i] ? -1 : 1
        sum := sum + (x[i] * weight * factor)
    sum / norm

vl1 = input(defval=5, title="First Moving Average length", type=input.integer)
vl2 = input(defval=8, title="Second Moving Average length", type=input.integer)
vl3 = vl1 + vl2
vl4 = vl2 + vl3
vl5 = vl3 + vl4

v1 = pine_wma(volume, vl1)
v2 = pine_wma(v1, vl2)
v3 = pine_wma(v2, vl3)
v4 = pine_wma(v3, vl4)
vol = pine_wma(v4, vl5)

vol_color = vol > 0 ? color.green : color.red
hline(0, title="Baseline", color=color.silver, linewidth=1)
plot(vol, color=vol_color, linewidth=2, title="Volume")

lbR = input(title="Pivot Lookback Right", defval=5)
lbL = input(title="Pivot Lookback Left", defval=5)
rangeUpper = input(title="Max of Lookback Range", defval=60)
rangeLower = input(title="Min of Lookback Range", defval=5)
plotBull = input(title="Plot Bullish", defval=true)
plotHiddenBull = input(title="Plot Hidden Bullish", defval=false)
plotBear = input(title="Plot Bearish", defval=true)
plotHiddenBear = input(title="Plot Hidden Bearish", defval=false)

bearColor = color.red
bullColor = color.green
hiddenBullColor = color.new(color.green, 25)
hiddenBearColor = color.new(color.red, 25)
textColor = color.white
noneColor = color.new(color.white, 100)

plFound = na(pivotlow(vol, lbL, lbR)) ? false : true
phFound = na(pivothigh(vol, lbL, lbR)) ? false : true

_inRange(cond) =>
    bars = barssince(cond == true)
    rangeLower <= bars and bars <= rangeUpper

//------------------------------------------------------------------------------
// Regular Bullish

// vol: Higher Low
volHL = vol[lbR] > valuewhen(plFound, vol[lbR], 1) and _inRange(plFound[1])

// Price: Lower Low
priceLL = low[lbR] < valuewhen(plFound, low[lbR], 1)

bullCond = plotBull and priceLL and volHL and plFound

plot(
	 plFound ? vol[lbR] : na,
	 offset=-lbR,
	 title="Regular Bullish",
	 linewidth=2,
	 color=(bullCond ? bullColor : noneColor),
	 transp=0
	 )

plotshape(
	 bullCond ? vol[lbR] : na,
	 offset=-lbR,
	 title="Regular Bullish Label",
	 text=" Bull ",
	 style=shape.labelup,
	 location=location.absolute,
	 color=bullColor,
	 textcolor=textColor,
	 transp=0
	 )

//------------------------------------------------------------------------------
// Hidden Bullish

// vol: Lower Low
volLL = vol[lbR] < valuewhen(plFound, vol[lbR], 1) and _inRange(plFound[1])

// Price: Higher Low
priceHL = low[lbR] > valuewhen(plFound, low[lbR], 1)

hiddenBullCond = plotHiddenBull and priceHL and volLL and plFound

plot(
	 plFound ? vol[lbR] : na,
	 offset=-lbR,
	 title="Hidden Bullish",
	 linewidth=2,
	 color=(hiddenBullCond ? hiddenBullColor : noneColor),
	 transp=0
	 )

plotshape(
	 hiddenBullCond ? vol[lbR] : na,
	 offset=-lbR,
	 title="Hidden Bullish Label",
	 text=" H Bull ",
	 style=shape.labelup,
	 location=location.absolute,
	 color=bullColor,
	 textcolor=textColor,
	 transp=0
	 )

//------------------------------------------------------------------------------
// Regular Bearish

// vol: Lower High
volLH = vol[lbR] < valuewhen(phFound, vol[lbR], 1) and _inRange(phFound[1])

// Price: Higher High
priceHH = high[lbR] > valuewhen(phFound, high[lbR], 1)

bearCond = plotBear and priceHH and volLH and phFound

plot(
	 phFound ? vol[lbR] : na,
	 offset=-lbR,
	 title="Regular Bearish",
	 linewidth=2,
	 color=(bearCond ? bearColor : noneColor),
	 transp=0
	 )

plotshape(
	 bearCond ? vol[lbR] : na,
	 offset=-lbR,
	 title="Regular Bearish Label",
	 text=" Bear ",
	 style=shape.labeldown,
	 location=location.absolute,
	 color=bearColor,
	 textcolor=textColor,
	 transp=0
	 )

//------------------------------------------------------------------------------
// Hidden Bearish

// vol: Higher High
volHH = vol[lbR] > valuewhen(phFound, vol[lbR], 1) and _inRange(phFound[1])

// Price: Lower High
priceLH = high[lbR] < valuewhen(phFound, high[lbR], 1)

hiddenBearCond = plotHiddenBear and priceLH and volHH and phFound

plot(
	 phFound ? vol[lbR] : na,
	 offset=-lbR,
	 title="Hidden Bearish",
	 linewidth=2,
	 color=(hiddenBearCond ? hiddenBearColor : noneColor),
	 transp=0
	 )

plotshape(
	 hiddenBearCond ? vol[lbR] : na,
	 offset=-lbR,
	 title="Hidden Bearish Label",
	 text=" H Bear ",
	 style=shape.labeldown,
	 location=location.absolute,
	 color=bearColor,
	 textcolor=textColor,
	 transp=0
	 )


if bullCond
    strategy.entry("Enter Long", strategy.long)
else if bearCond
    strategy.entry("Enter Short", strategy.short)
متعلقہ مواد
- آسان اسٹاک
- جے ایم اے + ڈبلیو ایم اے کثیر اناج کے ذریعہ
- برہماسترا
- محور آرڈر بلاکس
- پییوٹ پوائنٹس اعلی کم ملٹی ٹائم فریم
- پائن اسکرپٹ کی حکمت عملیوں میں ماہانہ واپسی
- پییوٹ پر مبنی ٹریلنگ زیادہ سے زیادہ اور کم سے کم
- ولیمز %R - ہموار
- ہل منتقل اوسط سوئنگ ٹریڈر
- کم سکینر حکمت عملی کریپٹو
مزید معلومات
- سپر ٹریکس
- چوٹی کا پتہ لگانے والا
- کم تلاش کرنے والا
- ایس ایم اے رجحان
- بولنگر کی کمیاں
- سپر ٹرینڈ بی
- سوئنگ ٹریڈ سگنل
- شیف رجحان سائیکل
- 72s: ایڈجسٹ ہول چلتی اوسط +
- خرید/فروخت کے ساتھ EMA ADX RSI کا اسکیلپنگ
- سپر ٹرینڈ ڈیلی 2.0 BF
- ہل منتقل اوسط سوئنگ ٹریڈر
- FTSMA - رجحان آپ کا دوست ہے
- رینج فلٹر خریدیں اور فروخت کریں
- ایس ایس ایل چینل
- ہل سویٹ حکمت عملی
- پیرابولک SAR خریدیں اور فروخت کریں
- پییوٹ پر مبنی ٹریلنگ زیادہ سے زیادہ اور کم سے کم
- نِک رِپاک ٹریلنگ ریورس (NRTR)
- ZigZag PA حکمت عملی V4.1