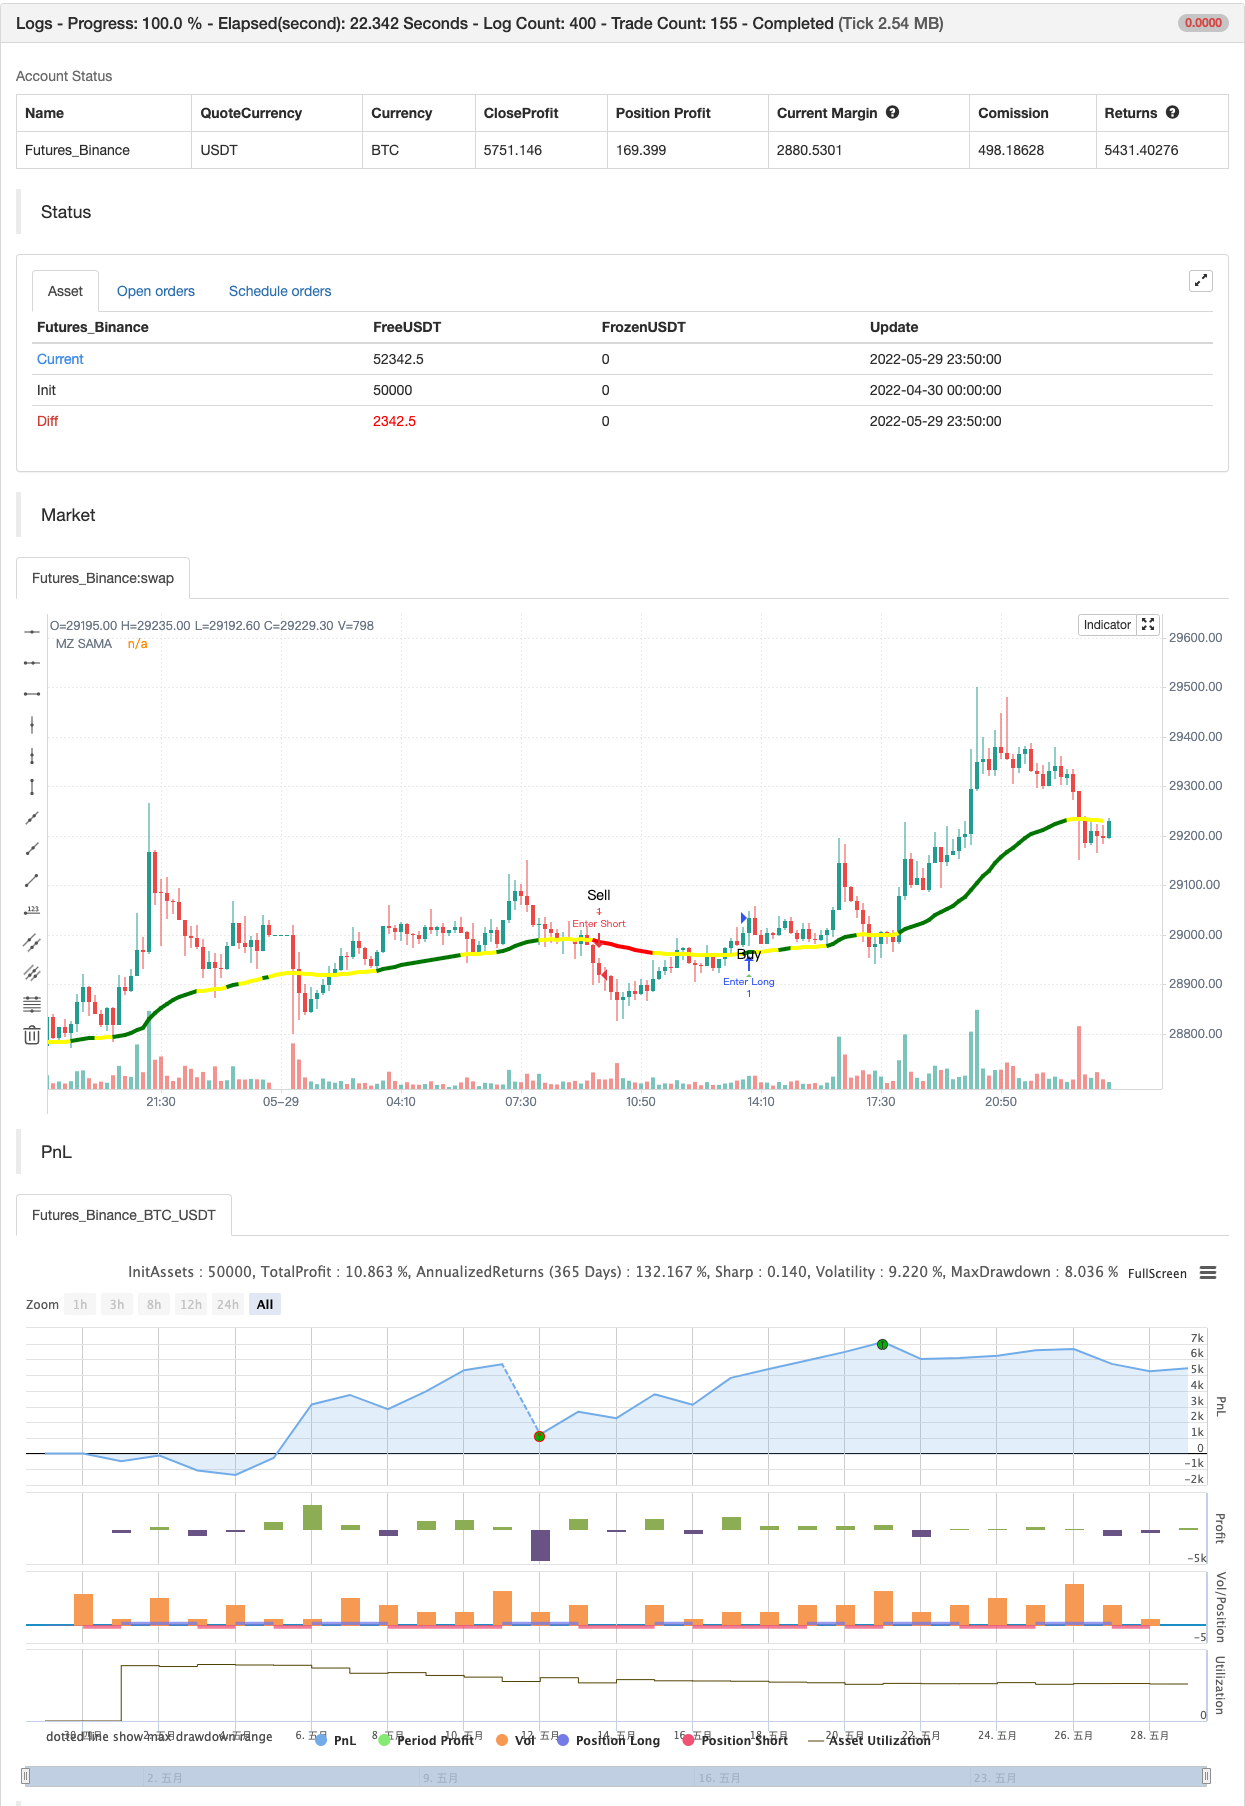
ڈھلوان موافقت پذیر چلتی اوسط
مصنف:چاؤ ژانگ، تاریخ: 2021-05-31 18:07:34ٹیگز:ایم اے اے
تعارف
یہ اسکرپٹ
رجحان کا پتہ لگانا سبز رنگ: اچھی قیمت کی رفتار کے ساتھ مضبوط اپ ٹرینڈ. سرخ رنگ: مضبوط ڈاؤن ٹرینڈ. پیلا رنگ: مارکیٹ یا تو ہلچل مچاتی ہے ، یا ضمنی طور پر یا مستحکم ہوتی ہے۔ نئی پوزیشن لینے سے گریز کرنا بہتر ہے اور اگر تجارت چل رہی ہے تو اسے جاری رکھنا اچھا ہے۔
ڈیفالٹ ترتیبات AMA کی لمبائی 200 ہے (ایک گھنٹے سے زیادہ کے ٹائم فریم کے لئے بہتر ہے) چھوٹی لمبائی 6 ہے اہم لمبائی 14 ہے ڈھلوان کا دورانیہ 34 پر مقرر کیا گیا ہے جس میں ابتدائی حد کا 25 ہے۔ استحکام ہمیشہ 17 سے نیچے ہوتا ہے۔ انتباہات خرید/فروخت کے انتباہات اس وقت جاری رہیں گے جب ڈھلوان استحکام / ہلچل کے علاقے سے باہر ہو۔ بہترین اندراج مطلق انتباہات کے وقت پر ہوتا ہے لیکن رجحان کی حالت کی بنیاد پر دیگر تجارتیں وسط میں شروع کی جاسکتی ہیں۔
بیک ٹسٹ

/*backtest
start: 2022-04-30 00:00:00
end: 2022-05-29 23:59:00
period: 10m
basePeriod: 1m
exchanges: [{"eid":"Futures_Binance","currency":"BTC_USDT"}]
*/

// This source code is subject to the terms of the Mozilla Public License 2.0 at https://mozilla.org/MPL/2.0/
// © MightyZinger

//@version=5

indicator('Slope Adaptive Moving Average (MZ SAMA)', shorttitle='MZ SAMA', overlay=true)

/////////////////////////////////////////////////////////////////////
/////////////////////////////////////////////////////////////////////
/////                        MZ SAMA                           //////
/////////////////////////////////////////////////////////////////////
/////////////////////////////////////////////////////////////////////

chartResolution = input.timeframe('', title='Chart Resolution')
src = input.source(close, 'Source')

// Length Inputs
string grp_1 = 'SAMA Length Inputs'
length = input(200, title='Adaptive MA Length', group = grp_1) // To check for Highest and Lowest value within provided period
majLength = input(14, title='Major Length', group = grp_1)     // For Major alpha calculations to detect recent price changes
minLength = input(6, title='Minor Length', group = grp_1)      // For Minor alpha calculations to detect recent price changes

// Slope Inputs
string grp_2 = 'Slope and Dynamic Coloring Parameters'
slopePeriod = input.int(34, title='Slope Period', group = grp_2)
slopeInRange = input.int(25, title='Slope Initial Range', group = grp_2)
flat = input.int(17, title='Consolidation area is when slope below:', group = grp_2)
bull_col = input.color(color.green, 'Bull Color  ', inline='dyn_col', group = grp_2)
bear_col = input.color(color.red, 'Bear Color  ', inline='dyn_col', group = grp_2)
conc_col = input.color(color.yellow, 'Reversal/Consolidation/Choppiness Color  ', inline='dyn_col', group = grp_2)

showSignals = input.bool(true, title='Show Signals on Chart', group='Plot Parameters')

//Slope calculation Function to check trend strength i.e. consolidating, choppy, or near reversal

calcslope(_ma, src, slope_period, range_1) =>
    pi = math.atan(1) * 4
    highestHigh = ta.highest(slope_period)
    lowestLow = ta.lowest(slope_period)
    slope_range = range_1 / (highestHigh - lowestLow) * lowestLow
    dt = (_ma[2] - _ma) / src * slope_range
    c = math.sqrt(1 + dt * dt)
    xAngle = math.round(180 * math.acos(1 / c) / pi)
    maAngle = dt > 0 ? -xAngle : xAngle
    maAngle

//MA coloring function to mark market dynamics

dynColor(_flat, slp, col_1, col_2, col_r) =>
    var col = color.new(na,0)
    // Slope supporting bullish uprtrend color
    col := slp > _flat ? col_1:
    // Slope supporting bearish downtrend color
         slp <= -_flat ? col_2:
    // Reversal/Consolidation/Choppiness color
         slp <= _flat and slp > -_flat ? col_r : col_r
    col

//AMA Calculations

ama(src,length,minLength,majLength)=>
    minAlpha = 2 / (minLength + 1)
    majAlpha = 2 / (majLength + 1)

    hh = ta.highest(length + 1)
    ll = ta.lowest(length + 1)

    mult = hh - ll != 0 ? math.abs(2 * src - ll - hh) / (hh - ll) : 0
    final = mult * (minAlpha - majAlpha) + majAlpha

    final_alpha = math.pow(final, 2) 		// Final Alpha calculated from Minor and Major length along with considering Multiplication factor calculated using Highest / Lowest value within provided AMA overall length
    var _ama = float(na)
    _ama := (src - nz(_ama[1])) * final_alpha + nz(_ama[1])
    _ama

// SAMA Definition
sama = request.security(syminfo.tickerid, chartResolution, ama(src,length,minLength,majLength))

// Slope Calculation for Dynamic Coloring
slope = calcslope(sama, src, slopePeriod, slopeInRange)

// SAMA Dynamic Coloring from slope
sama_col = request.security(syminfo.tickerid, chartResolution, dynColor(flat, slope, bull_col, bear_col, conc_col))

// SAMA Plot
plot(sama, 'MZ SAMA', sama_col, 4)


// BUY & SELL CONDITIONS AND ALERTS
_up = sama_col == bull_col
_downn = sama_col == bear_col
_chop = sama_col == conc_col
buy  = _up and not _up[1]
sell = _downn and not _downn[1]
chop_zone = _chop and not _chop[1]

_signal() =>
    var sig = 0
    if buy and sig <= 0
        sig := 1
    if sell and sig >= 0
        sig := -1
    sig

sig = _signal()

longsignal  = sig ==  1 and (sig !=  1)[1]
shortsignal = sig == -1 and (sig != -1)[1]

// Plotting Signals on Chart
atrOver = 1 * ta.atr(5)   // Atr to place alert shape on chart
plotshape(showSignals and longsignal  ? (sama - atrOver) : na , style=shape.triangleup, color=color.new(color.green, 30), location=location.absolute, text='Buy', size=size.small)
plotshape(showSignals and shortsignal ? (sama + atrOver): na , style=shape.triangledown, color=color.new(color.red, 30), location=location.absolute, text='Sell', size=size.small)

// Signals Alerts
alertcondition(longsignal, "Buy",  "Go Long" )
alertcondition(shortsignal, "Sell", "Go Short")
alertcondition(chop_zone, "Chop Zone", "Possible Reversal/Consolidation/Choppiness")

if longsignal
    alert("Buy at" + str.tostring(close), alert.freq_once_per_bar_close)
if shortsignal
    alert("Sell at" + str.tostring(close), alert.freq_once_per_bar_close)


if longsignal
    strategy.entry("Enter Long", strategy.long)
else if shortsignal
    strategy.entry("Enter Short", strategy.short)
- ڈارواس باکس خریدیں فروخت کریں
- ڈیمارک سیٹ اپ اشارے
- بولنگر بینڈ اسٹوکاسٹک آر ایس آئی انتہائی
- اے کے ایم اے سی ڈی بی بی اشارے V 1.00
- پارابولک SAR
- RSI متغیر اشارے
- او بی وی ایم اے سی ڈی اشارے
- محور رجحان
- قیمتوں میں فرق کی حکمت عملی v1.0
- سپورٹ- مزاحمت توڑ
- ڈیلٹا-آر ایس آئی آسکیلیٹر حکمت عملی
- کم سکینر حکمت عملی کریپٹو
- [بلیک کیٹ] L2 ریورس لیبلز حکمت عملی
- سپر بی
- اعلی کم SAR
- سپر ٹریکس
- چوٹی کا پتہ لگانے والا
- کم تلاش کرنے والا
- ایس ایم اے رجحان
- بولنگر کی کمیاں