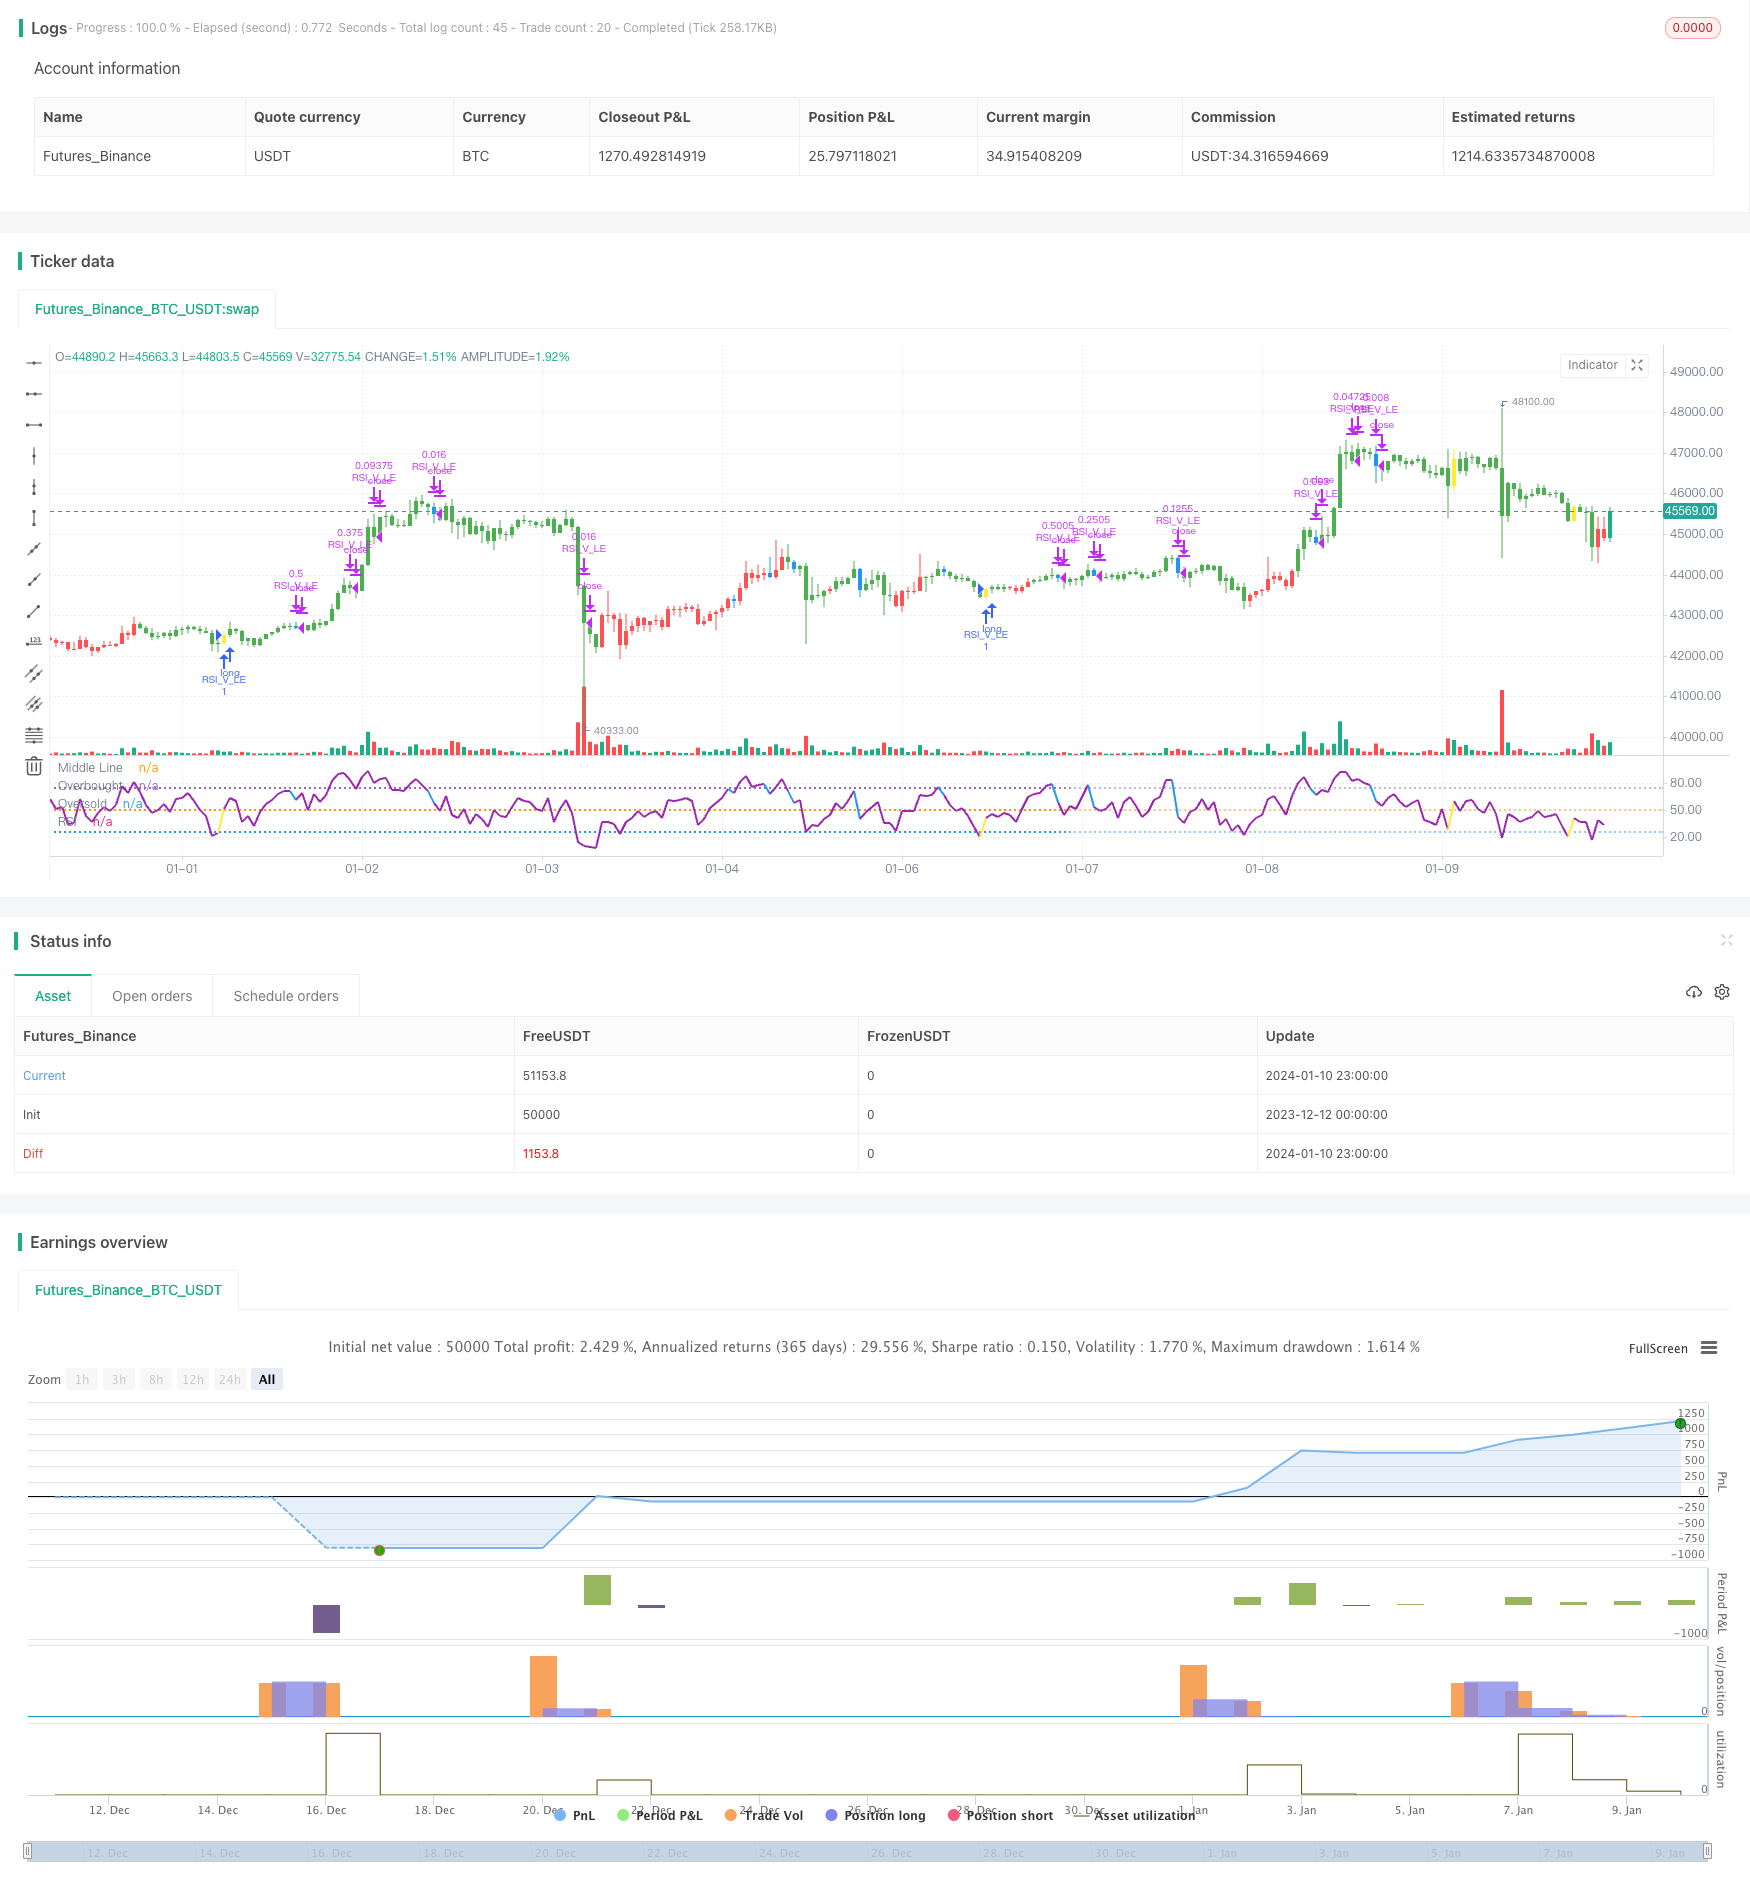
RSI V پیٹرن پر مبنی قلیل مدتی منافع کی حکمت عملی

جائزہ
یہ حکمت عملی آر ایس آئی اشارے کی وی شکل پر مبنی ہے ، اور ای ایم اے کی اوسط فلٹرنگ کے ساتھ مل کر ، ایک زیادہ قابل اعتماد قلیل لائن منافع بخش حکمت عملی تشکیل دیتی ہے۔ یہ اوور سیل علاقوں میں قیمتوں میں ردوبدل کی تشکیل کے مواقع کو پکڑ سکتا ہے ، اور آر ایس آئی اشارے کے وی شکل کے اشارے کے ذریعہ زیادہ سے زیادہ فائدہ اٹھانے کے مقصد کے لئے زیادہ سے زیادہ فائدہ اٹھاتا ہے۔
حکمت عملی کا اصول
- 20 دن کی لکیر کو 50 دن کی لکیر کے اوپر لمبی لکیر کے طور پر استعمال کریں
- آر ایس آئی نے ایک وی شکل تشکیل دی ، جس سے یہ ظاہر ہوتا ہے کہ اوورسیڈ ریبوٹ کا موقع ہے۔
- پچھلی K لائن کی کم از کم کم از کم پہلے دو K لائنوں سے کم ہے
- موجودہ K لائن RSI پچھلی دو K لائنوں سے زیادہ ہے
- RSI پر 30 V شکل کے طور پر مکمل کرنے کے لئے سگنل، زیادہ سے زیادہ
- اسٹاپ نقصان 8 فیصد سے کم قیمت پر مقرر کیا گیا
- آر ایس آئی 70 کے ذریعے شروع ہوتا ہے اور اسٹاپ نقصان داخلہ قیمت پر منتقل ہوتا ہے
- RSI 90 کے ذریعے شروع ہوتا ہے
- آر ایس آئی 10 / اسٹاپ نقصان کی ٹرگر سے گزرتا ہے ، تمام فلیٹ پوزیشن
طاقت کا تجزیہ
- ای ایم اے اوسط کا استعمال کرتے ہوئے بڑے رجحانات کی سمت کا تعین کریں ، مخالف سمت سے بچیں
- آر ایس آئی وی شکل نے اوور سیل علاقائی واپسی کے مواقع کا اندازہ لگایا ، رجحانات کو تبدیل کرنے پر قبضہ کیا
- ایک سے زیادہ روک تھام کے نظام کے خطرے کو کنٹرول کرنا
خطرے کا تجزیہ
- بڑے بازاروں میں کمی کا امکان ہے کہ اس کی روک تھام نہ کی جاسکے ، جس سے بڑے نقصانات ہوں گے۔
- RSI V شکل سگنل میں غلطیاں ہوسکتی ہیں جو غیر ضروری نقصانات کا سبب بن سکتی ہیں
اصلاح کی سمت
- آر ایس آئی پیرامیٹرز کو بہتر بنانے کے لئے آر ایس آئی وی کی زیادہ قابل اعتماد شکلیں تلاش کریں
- دیگر اشارے کے ساتھ مل کر ریورس سگنل کی وشوسنییتا کا فیصلہ
- نقصانات کو روکنے کی حکمت عملی کو بہتر بنانا ، زیادہ سے زیادہ شدت پسندی سے بچنے کے ساتھ بروقت نقصانات کو روکنا
خلاصہ کریں۔
اس حکمت عملی میں ای ایم اے یکساں لائن فلٹرنگ اور آر ایس آئی وی شکل کا فیصلہ شامل ہے ، جس سے ایک زیادہ قابل اعتماد شارٹ لائن آپریشن کی حکمت عملی تشکیل دی گئی ہے۔ یہ زیادہ فروخت والے علاقوں میں واپسی کے مواقع کو مؤثر طریقے سے پکڑ سکتا ہے ، اور مختصر لائن پر منافع بخش ہے۔ پیرامیٹرز اور ماڈل کو بہتر بنانے اور نقصان کی روک تھام کے طریقہ کار کو بہتر بنانے کے ذریعے ، یہ حکمت عملی استحکام اور منافع کو مزید بڑھا سکتی ہے۔ اس نے مقدار کے تاجروں کے لئے ایک اور شارٹ لائن منافع بخش دروازہ کھول دیا ہے۔
/*backtest
start: 2023-12-12 00:00:00
end: 2024-01-11 00:00:00
period: 1h
basePeriod: 15m
exchanges: [{"eid":"Futures_Binance","currency":"BTC_USDT"}]
*/

// This source code is subject to the terms of the Mozilla Public License 2.0 at https://mozilla.org/MPL/2.0/
// © mohanee

//@version=4
//strategy("RSI V Pattern", overlay=true)
strategy(title="RSI V Pattern", overlay=false )

//Strategy Rules
//ema20 is above ema50  --- candles are colored  green on the chart
//RSI value sharply coming up which makes a V shape ,  colored in yellow on the chart
//RSI V pattern should occur from below 30

len = input(title="RSI Period", minval=1, defval=5)
stopLoss = input(title="Stop Loss %", minval=1, defval=8)

myRsi = rsi(close,len)

longEmaVal=ema(close,50)
shortEmaVal=ema(close,20)

//plot emas
//plot(longEmaVal, title="Long EMA" ,linewidth=2, color=color.orange, trackprice=true)
//plot(shortEmaVal, title="Short EMA" ,linewidth=2, color=color.green, trackprice=true)


longCondition =  ema(close,20)>ema(close,50)   and (low[1]<low[2] and  low[1]<low[3]) and (myRsi>myRsi[1] and myRsi>myRsi[2] ) and crossover(myRsi,30) //  (   and myRsi<60)

//(myRsi<60 and myRsi>30)  and myRsi>myRsi[1] and (myRsi[1]<myRsi[2]  or  myRsi[1]<myRsi[3]) and (myRsi[2]<30)  and (myRsi[3]<30 and myRsi[4]>=30)


barcolor(shortEmaVal>longEmaVal?color.green:color.red)
//longCondition = crossover(sma(close, 14), sma(close, 28))
barcolor(longCondition?color.yellow:na)
strategy.entry("RSI_V_LE", strategy.long, when=longCondition )
//stoploss value at 10%
stopLossValue=strategy.position_avg_price -  (strategy.position_avg_price*stopLoss/100)
//stopLossValue=valuewhen(longCondition,low,3)


//takeprofit at RSI highest  reading
//at RSI75 move the stopLoss to entry price
moveStopLossUp=strategy.position_size>0 and crossunder(myRsi,70)
barcolor(moveStopLossUp?color.blue:na)
stopLossValue:=crossover(myRsi,70) ? strategy.position_avg_price:stopLossValue

//stopLossValue:=moveStopLossUp?strategy.position_avg_price:stopLossValue
rsiPlotColor=longCondition ?color.yellow:color.purple
rsiPlotColor:= moveStopLossUp ?color.blue:rsiPlotColor
plot(myRsi, title="RSI", linewidth=2, color=rsiPlotColor)
//longCondition?color.yellow:#8D1699)
hline(50, title="Middle Line", linestyle=hline.style_dotted)
obLevel = hline(75, title="Overbought", linestyle=hline.style_dotted)
osLevel = hline(25, title="Oversold", linestyle=hline.style_dotted)
fill(obLevel, osLevel, title="Background", color=#9915FF, transp=90)


//when RSI crossing down 70 , close 1/2 position and move stop loss to average entry price
strategy.close("RSI_V_LE",  qty=strategy.position_size*1/2, when=strategy.position_size>0 and crossunder(myRsi,70))

//when RSI reaches high reading 90 and crossing down close 3/4 position
strategy.close("RSI_V_LE",  qty=strategy.position_size*3/4, when=strategy.position_size>0 and crossunder(myRsi,90))


//close everything when Rsi goes down below to 10 or stoploss hit
//just keeping RSI cross below 10 , can work as stop loss , which also keeps you long in the trade ... however sharp declines could  make large loss
//so I combine RSI goes below 10 OR stoploss hit  , whichever comes first - whole posiition closed
longCloseCondition=crossunder(myRsi,10)  or close<stopLossValue
strategy.close("RSI_V_LE", qty=strategy.position_size,when=longCloseCondition )