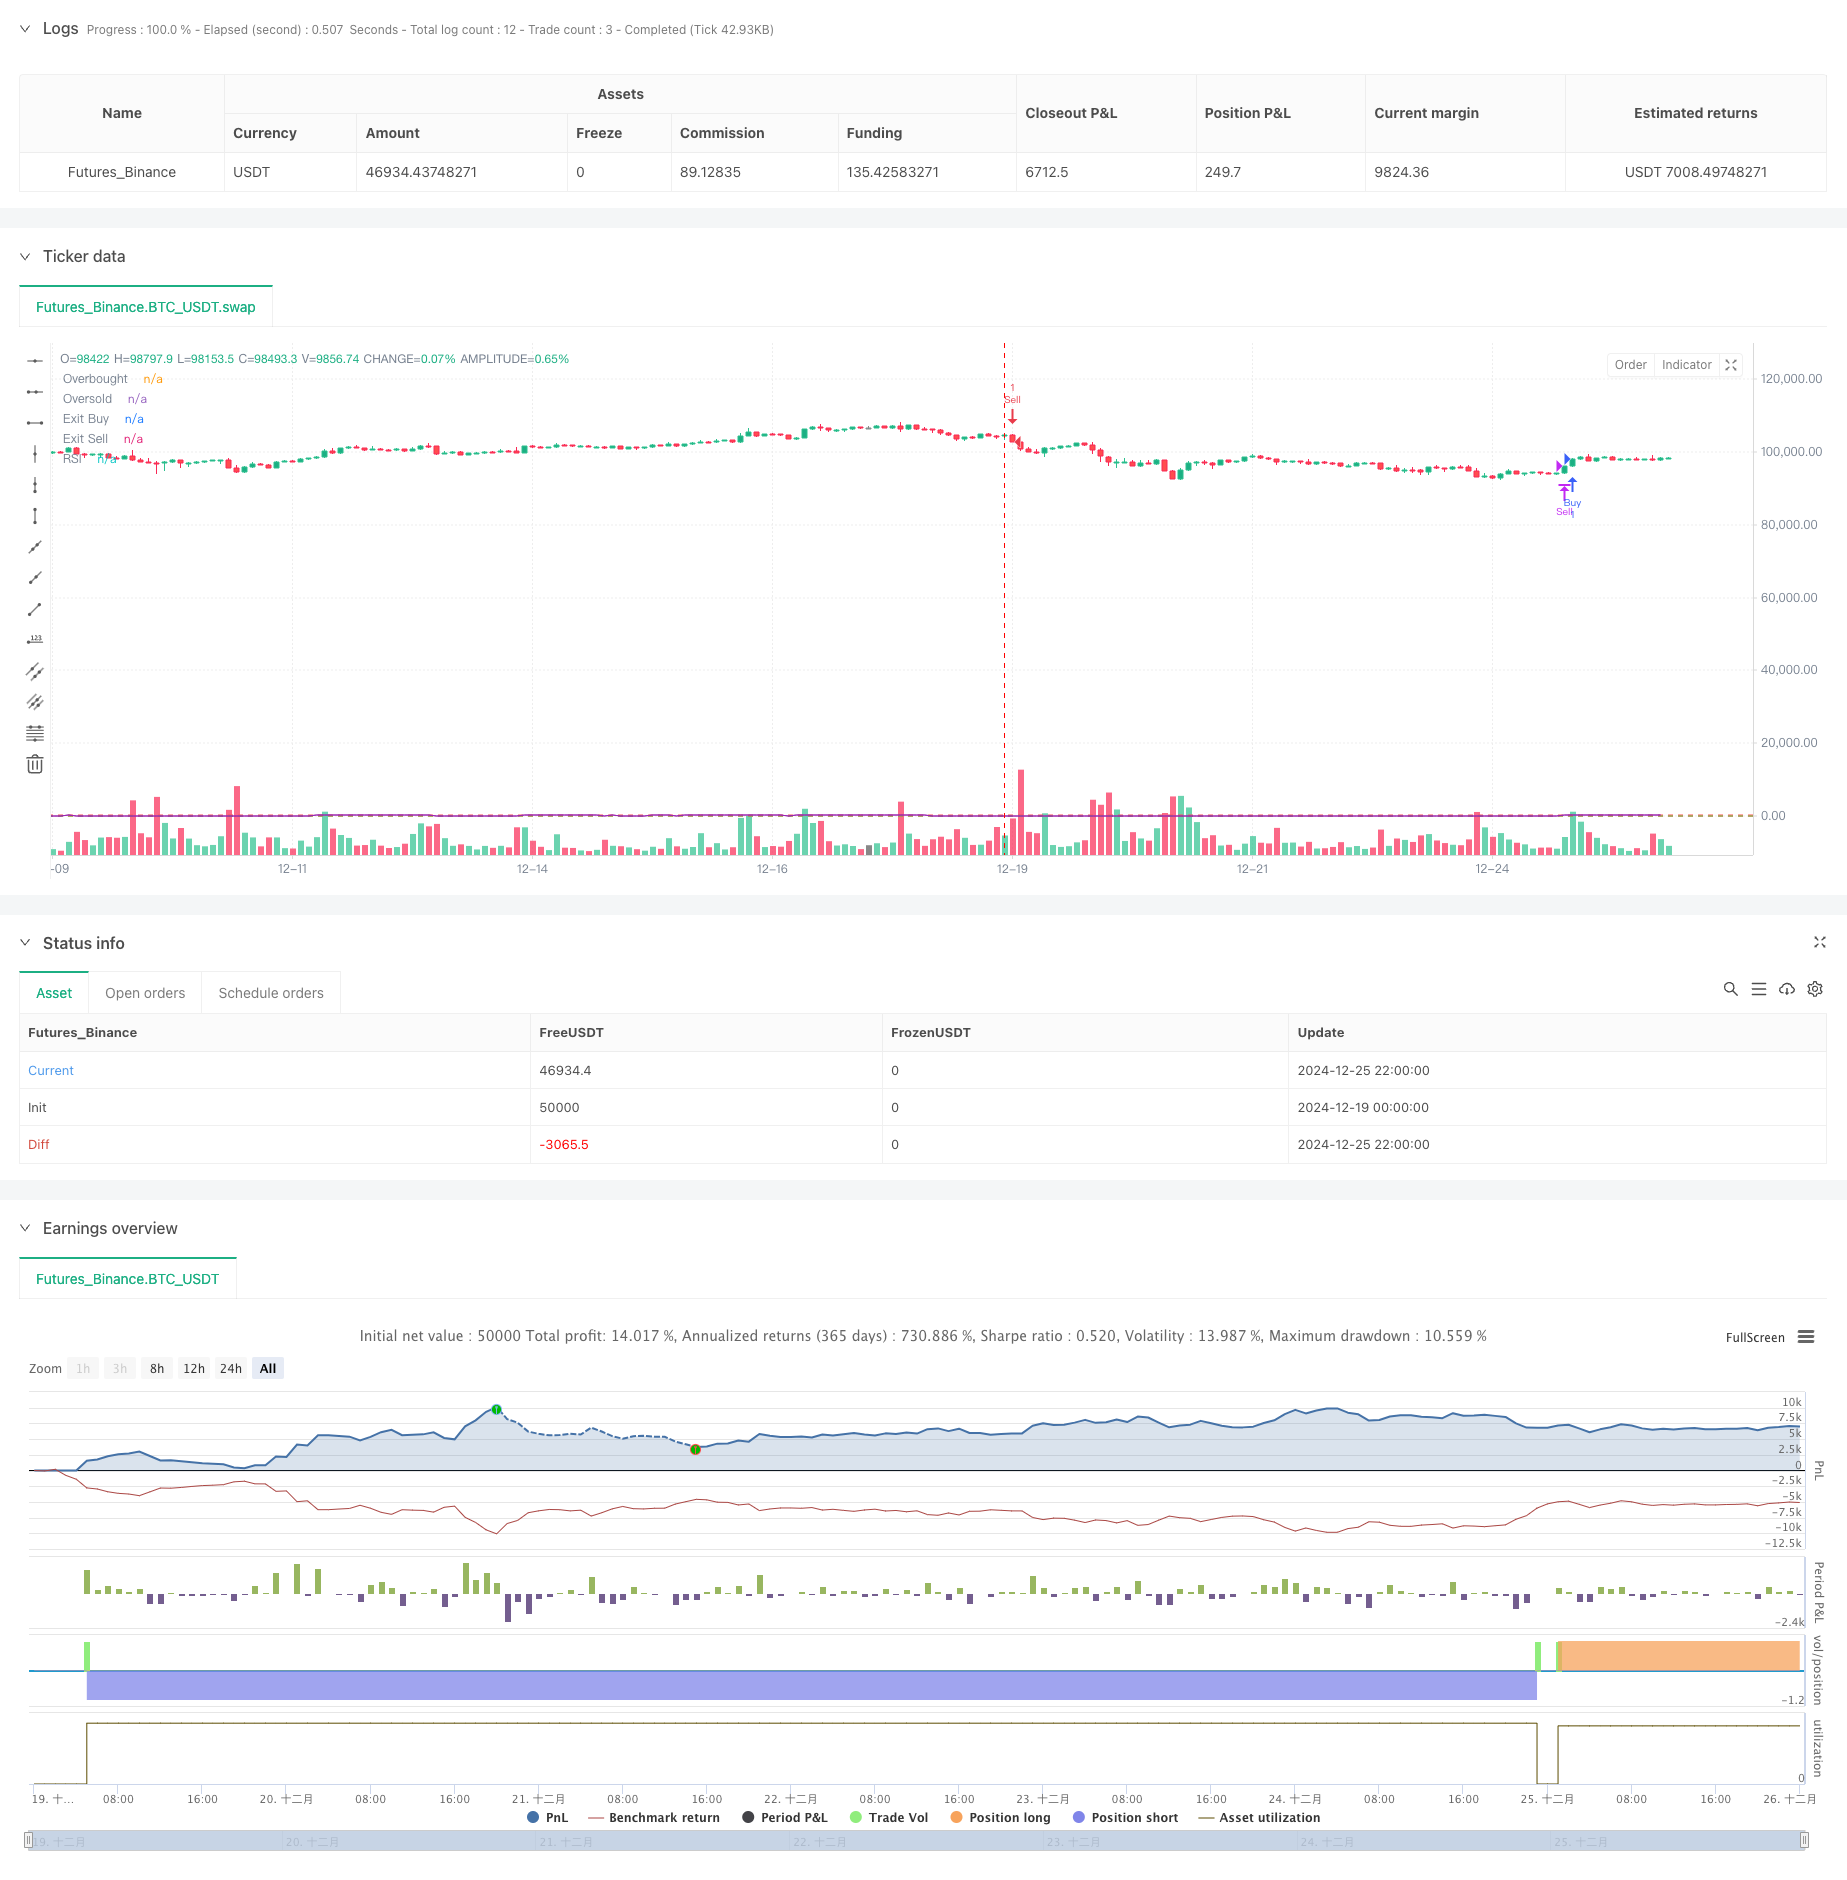
جائزہ
یہ حکمت عملی ایک ٹرینڈ ریورسل ٹریڈنگ سسٹم ہے جس کی بنیاد رشتہ دار طاقت انڈیکس (RSI) پر ہوتی ہے یہ زیادہ خریدی ہوئی اور زیادہ فروخت شدہ رینجز کو ترتیب دے کر مارکیٹ کے ٹرننگ پوائنٹس کو حاصل کرتی ہے، اور رسک کنٹرول کے لیے ATR ڈائنامک سٹاپ نقصان کو یکجا کرتی ہے۔ حکمت عملی کی انفرادیت “ممنوعہ تجارتی رینج” کے تصور کو متعارف کرانے میں مضمر ہے، جو مؤثر طریقے سے غیر مستحکم مارکیٹ میں بار بار تجارت سے گریز کرتی ہے۔ یہ حکمت عملی زیادہ اتار چڑھاؤ کے ساتھ مارکیٹ کے ماحول کے لیے موزوں ہے، خاص طور پر واضح رجحان کی خصوصیات کے ساتھ تجارتی مصنوعات کے لیے۔
حکمت عملی کا اصول
حکمت عملی بنیادی طور پر درج ذیل بنیادی منطق کی بنیاد پر نافذ کی جاتی ہے:
- زیادہ خریدی اور زیادہ فروخت شدہ مارکیٹ کے حالات کی نشاندہی کرنے کے لیے 14 مدت کے RSI اشارے کا استعمال
- جب RSI 60 کی سطح سے گزرتا ہے اور اختتامی قیمت پچھلی بلندی سے زیادہ ہوتی ہے، تو ایک لمبا سگنل متحرک ہوتا ہے۔
- جب RSI 40 کی سطح سے نیچے آجاتا ہے اور اختتامی قیمت پچھلی کم سے کم ہوتی ہے تو ایک مختصر سگنل متحرک ہوتا ہے۔
- جب RSI 45-55 کی رینج میں ہوتا ہے، تو اسے ممنوعہ تجارتی زون کے طور پر سیٹ کیا جاتا ہے تاکہ استحکام کے مرحلے کے دوران بار بار تجارت کو روکا جا سکے۔
- خطرے کو کنٹرول کرنے کا طریقہ کار فراہم کرنے کے لیے 1.5 گنا ATR کی بنیاد پر ڈائنامک سٹاپ نقصان سیٹ کریں۔
- جب RSI بالترتیب 45 سے نیچے اور 55 سے اوپر ہو تو لمبی اور مختصر پوزیشنیں بند کریں۔
اسٹریٹجک فوائد
- ٹریڈنگ کے فیصلوں کے لیے رجحان کی تبدیلی اور رفتار کی خصوصیات کو یکجا کرنا
- ٹریڈنگ رینجز پر پابندی لگا کر غیر مستحکم مارکیٹوں میں غلط سگنلز سے مؤثر طریقے سے بچیں۔
- اے ٹی آر ڈائنامک اسٹاپ لاس کو اپنائیں اور مارکیٹ کے اتار چڑھاؤ کے مطابق اسٹاپ نقصان کی پوزیشن کو موافق بنائیں
- ساپیکش فیصلے سے بچنے کے لیے اندراج اور باہر نکلنے کے حالات صاف کریں۔
- حکمت عملی کی منطق سادہ اور واضح، سمجھنے اور برقرار رکھنے میں آسان ہے۔
- ایک اچھا رسک کنٹرول میکنزم ہو۔
اسٹریٹجک رسک
- تیزی سے رجحان ساز بازاروں میں کچھ حرکتیں چھوٹ سکتی ہیں۔
- RSI اشارے میں وقفہ ہے، جس کی وجہ سے داخلے کے وقت میں تھوڑی تاخیر ہو سکتی ہے۔
- تجارتی حدود پر پابندی لگانے کے نتیجے میں کچھ اہم تجارتی مواقع ضائع ہو سکتے ہیں۔
- ATR سٹاپ نقصان غیر مستحکم ادوار کے دوران سٹاپ نقصان بہت وسیع ہو سکتا ہے
- مارکیٹ کے مختلف ماحول سے مطابقت رکھنے کے لیے معقول پیرامیٹرز کو سیٹ کرنے کی ضرورت ہے۔
حکمت عملی کی اصلاح کی سمت
- لین دین کی وشوسنییتا کو بہتر بنانے کے لیے ملٹی پیریڈ RSI تصدیقی سگنلز کا تعارف
- معاون فیصلے کی شرائط کے طور پر حجم کے اشارے شامل کریں۔
- ممنوعہ تجارتی رینج کے متحرک ایڈجسٹمنٹ میکانزم کو بہتر بنائیں
- مضبوط رجحانات میں حکمت عملی کے پیرامیٹرز کو ایڈجسٹ کرنے کے لیے ٹرینڈ اسکریننگ فنکشن کو شامل کرنے پر غور کریں۔
- حکمت عملی کی موافقت کو بہتر بنانے کے لیے انکولی پیرامیٹر کی اصلاح کے طریقہ کار کو تیار کریں۔
- سرمائے کے استعمال کی کارکردگی کو بہتر بنانے کے لیے منافع لینے کا طریقہ کار شامل کریں۔
خلاصہ کریں۔
یہ حکمت عملی RSI ریورسل سگنلز اور ممنوعہ ٹریڈنگ رینجز کے جدید امتزاج کے ذریعے ٹرینڈ ٹریڈنگ میں وقت کا مسئلہ حل کرتی ہے۔ اے ٹی آر ڈائنامک سٹاپ نقصان کا تعارف حکمت عملی کے لیے ایک قابل اعتماد رسک کنٹرول میکانزم فراہم کرتا ہے۔ اگرچہ حکمت عملی میں ابھی بھی کچھ ممکنہ خطرات موجود ہیں، لیکن تجویز کردہ اصلاحی ہدایات کے ذریعے حکمت عملی کے استحکام اور منافع کو مزید بہتر بنایا جا سکتا ہے۔ مجموعی طور پر، یہ واضح منطق اور مضبوط عملییت کے ساتھ ایک رجحان کو تبدیل کرنے والی تجارتی حکمت عملی ہے۔
/*backtest
start: 2024-12-19 00:00:00
end: 2024-12-26 00:00:00
period: 2h
basePeriod: 2h
exchanges: [{"eid":"Futures_Binance","currency":"BTC_USDT"}]
*/

//@version=5
strategy("RSI-Based Trading Strategy with No Trading Zone and ATR Stop Loss", overlay=true)

// Input parameters
rsiPeriod = input(14, title="RSI Period")
rsiOverbought = input(60, title="RSI Overbought Level")
rsiOversold = input(40, title="RSI Oversold Level")
rsiExitBuy = input(45, title="RSI Exit Buy Level")
rsiExitSell = input(55, title="RSI Exit Sell Level")
atrPeriod = input(14, title="ATR Period")
atrMultiplier = input(1.5, title="ATR Stop Loss Multiplier")

// Calculate RSI and ATR
rsi = ta.rsi(close, rsiPeriod)
atr = ta.atr(atrPeriod)

// Buy conditions
buyCondition = ta.crossover(rsi, rsiOverbought) and close > high[1]
if (buyCondition and not strategy.position_size)
    stopLossLevel = close - atr * atrMultiplier
    strategy.entry("Buy", strategy.long, stop=stopLossLevel)

// Exit conditions for buy
exitBuyCondition = rsi < rsiExitBuy
if (exitBuyCondition and strategy.position_size > 0)
    strategy.close("Buy")

// Sell conditions
sellCondition = ta.crossunder(rsi, rsiOversold) and close < low[1]
if (sellCondition and not strategy.position_size)
    stopLossLevel = close + atr * atrMultiplier
    strategy.entry("Sell", strategy.short, stop=stopLossLevel)

// Exit conditions for sell
exitSellCondition = rsi > rsiExitSell
if (exitSellCondition and strategy.position_size < 0)
    strategy.close("Sell")

// Plotting RSI for visualization
hline(rsiOverbought, "Overbought", color=color.red)
hline(rsiOversold, "Oversold", color=color.green)
hline(rsiExitBuy, "Exit Buy", color=color.blue)
hline(rsiExitSell, "Exit Sell", color=color.orange)
plot(rsi, title="RSI", color=color.purple)

// // No Trading Zone
// var box noTradingZone = na

// // Create a rectangle for the no trading zone
// if (rsi >= rsiExitBuy and rsi <= rsiExitSell)
//     // If the no trading zone box does not exist, create it
//     if (na(noTradingZone))
//         noTradingZone := box.new(bar_index, high, bar_index + 1, low, bgcolor=color.new(color.gray, 90), border_color=color.new(color.gray, 90))
//     else
//         // Update the existing box to cover the current candle
//         box.set_left(noTradingZone, bar_index)
//         box.set_right(noTradingZone, bar_index + 1)
//         box.set_top(noTradingZone, high)
//         box.set_bottom(noTradingZone, low)
// else
//     // If the RSI is outside the no trading zone, delete the box
//     if (not na(noTradingZone))
//         box.delete(noTradingZone)
//         noTradingZone := na