"Chiến lược EMA hai lần ma thuật" từ các cựu chiến binh YouTube
Tác giả:FMZ~Lydia, Tạo: 2022-11-07 12:02:31, Cập nhật: 2024-11-29 19:00:54
Chiến lược Magic Double EMA từ các cựu chiến binh YouTube
Trong số này, chúng tôi sẽ thảo luận về một
Các chỉ số được sử dụng trong chiến lược
- Chỉ số EMA
Vì lợi ích của thiết kế đơn giản, chúng tôi sẽ không sử dụng Moving Average Exponential được liệt kê trong video, chúng tôi sẽ sử dụng tích hợp trong ta.ema của giao dịch xem thay vào đó (nó thực sự là tương tự).
- VuManChu Chỉ số tự do xoay
Đây là một chỉ số trên Trading View, chúng ta cần đi đến Trading View và lấy mã nguồn.
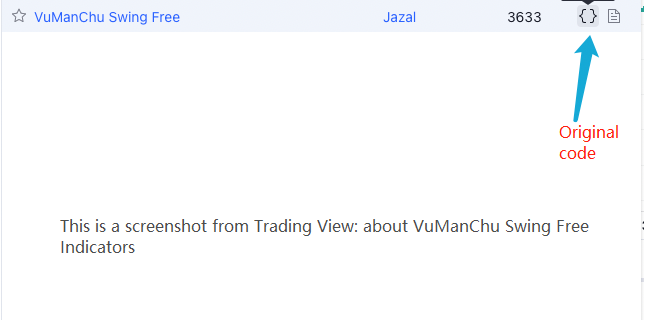
Mã của VuManChu Swing Free:
// This source code is subject to the terms of the Mozilla Public License 2.0 at https://mozilla.org/MPL/2.0/

// Credits to the original Script - Range Filter DonovanWall https://www.tradingview.com/script/lut7sBgG-Range-Filter-DW/
// This version is the old version of the Range Filter with less settings to tinker with

//@version=4
study(title="Range Filter - B&S Signals", shorttitle="RF - B&S Signals", overlay=true)

//-----------------------------------------------------------------------------------------------------------------------------------------------------------------
//Functions
//-----------------------------------------------------------------------------------------------------------------------------------------------------------------

//Range Size Function
rng_size(x, qty, n)=>
//    AC       = Cond_EMA(abs(x - x[1]), 1, n)
    wper      = (n*2) - 1
    avrng     = ema(abs(x - x[1]), n)
    AC = ema(avrng, wper)*qty
    rng_size = AC

//Range Filter Function
rng_filt(x, rng_, n)=>
    r          = rng_
    var rfilt  = array.new_float(2, x)
    array.set(rfilt, 1, array.get(rfilt, 0))
    if x - r > array.get(rfilt, 1)
        array.set(rfilt, 0, x - r)
    if x + r < array.get(rfilt, 1)
        array.set(rfilt, 0, x + r)
    rng_filt1 = array.get(rfilt, 0)

    hi_band   = rng_filt1 + r
    lo_band   = rng_filt1 - r
    rng_filt  = rng_filt1
    [hi_band, lo_band, rng_filt]

//-----------------------------------------------------------------------------------------------------------------------------------------------------------------
//Inputs
//-----------------------------------------------------------------------------------------------------------------------------------------------------------------

//Range Source
rng_src = input(defval=close, type=input.source, title="Swing Source")

//Range Period
rng_per = input(defval=20, minval=1, title="Swing Period")

//Range Size Inputs
rng_qty   = input(defval=3.5, minval=0.0000001, title="Swing Multiplier")

//Bar Colors
use_barcolor = input(defval=false, type=input.bool, title="Bar Colors On/Off")

//-----------------------------------------------------------------------------------------------------------------------------------------------------------------
//Definitions
//-----------------------------------------------------------------------------------------------------------------------------------------------------------------

//Range Filter Values
[h_band, l_band, filt] = rng_filt(rng_src, rng_size(rng_src, rng_qty, rng_per), rng_per)

//Direction Conditions
var fdir = 0.0
fdir    := filt > filt[1] ? 1 : filt < filt[1] ? -1 : fdir
upward   = fdir==1 ? 1 : 0
downward = fdir==-1 ? 1 : 0

//Trading Condition
longCond = rng_src > filt and rng_src > rng_src[1] and upward > 0 or rng_src > filt and rng_src < rng_src[1] and upward > 0
shortCond = rng_src < filt and rng_src < rng_src[1] and downward > 0 or rng_src < filt and rng_src > rng_src[1] and downward > 0

CondIni = 0
CondIni := longCond ? 1 : shortCond ? -1 : CondIni[1]
longCondition = longCond and CondIni[1] == -1
shortCondition = shortCond and CondIni[1] == 1

//Colors
filt_color = upward ? #05ff9b : downward ? #ff0583 : #cccccc
bar_color  = upward and (rng_src > filt) ? (rng_src > rng_src[1] ? #05ff9b : #00b36b) :
             downward and (rng_src < filt) ? (rng_src < rng_src[1] ? #ff0583 : #b8005d) : #cccccc

//-----------------------------------------------------------------------------------------------------------------------------------------------------------------
//Outputs
//-----------------------------------------------------------------------------------------------------------------------------------------------------------------

//Filter Plot
filt_plot = plot(filt, color=filt_color, transp=67, linewidth=3, title="Filter")

//Band Plots
h_band_plot = plot(h_band, color=color.new(#05ff9b, 100), title="High Band")
l_band_plot = plot(l_band, color=color.new(#ff0583, 100), title="Low Band")

//Band Fills
fill(h_band_plot, filt_plot, color=color.new(#00b36b, 92), title="High Band Fill")
fill(l_band_plot, filt_plot, color=color.new(#b8005d, 92), title="Low Band Fill")

//Bar Color
barcolor(use_barcolor ? bar_color : na)

//Plot Buy and Sell Labels
plotshape(longCondition, title = "Buy Signal", text ="BUY", textcolor = color.white, style=shape.labelup, size = size.normal, location=location.belowbar, color = color.new(color.green, 0))
plotshape(shortCondition, title = "Sell Signal", text ="SELL", textcolor = color.white, style=shape.labeldown, size = size.normal, location=location.abovebar, color = color.new(color.red, 0))

//Alerts
alertcondition(longCondition, title="Buy Alert", message = "BUY")
alertcondition(shortCondition, title="Sell Alert", message = "SELL")
Chiến lược logic
Chỉ số EMA: chiến lược sử dụng hai EMA, một là đường nhanh (định số thời gian nhỏ) và một là đường chậm (định số thời gian lớn).
thỏa thuận vị trí dài Đường nhanh nằm trên đường chậm.
thỏa thuận vị trí ngắn Đường nhanh nằm dưới đường chậm.
Chỉ số VuManChu Swing Free: Chỉ số VuManChu Swing Free được sử dụng để gửi tín hiệu và đánh giá liệu có nên đặt đơn đặt hàng kết hợp với các điều kiện khác.
Bây giờ hãy nói về các điều kiện kích hoạt cụ thể của tín hiệu giao dịch:
Quy tắc nhập vào vị trí dài: Giá đóng của đường K dương tính nên ở trên đường nhanh của EMA, hai đường EMA nên là một vị trí dài (đường nhanh trên đường chậm), và chỉ số VuManChu Swing Free nên hiển thị tín hiệu mua (longCondition là đúng). Nếu ba điều kiện được đáp ứng, đường K này là đường K chính để nhập vị trí dài, và giá đóng của đường K này là vị trí nhập.
Quy tắc nhập vào vị trí ngắn (ngược lại với vị trí dài): Giá đóng của đường K âm nên dưới đường nhanh của EMA, hai đường EMA nên là một vị trí ngắn (đường nhanh dưới đường chậm), và chỉ số VuManChu Swing Free nên hiển thị tín hiệu bán (shortCondition là đúng). Nếu ba điều kiện được đáp ứng, giá đóng của đường K là vị trí đầu vào ngắn.
Có phải logic giao dịch rất đơn giản? Vì video nguồn không chỉ định dừng lợi nhuận và dừng lỗ, tôi sẽ sử dụng phương pháp dừng lợi nhuận và dừng lỗ vừa phải một cách tự do, sử dụng các điểm cố định để dừng lỗ và theo dõi dừng lợi nhuận.
Thiết kế mã
Mã cho chỉ số VuManChu Swing Free, chúng tôi đưa nó vào mã chiến lược của chúng tôi trực tiếp mà không có bất kỳ thay đổi.
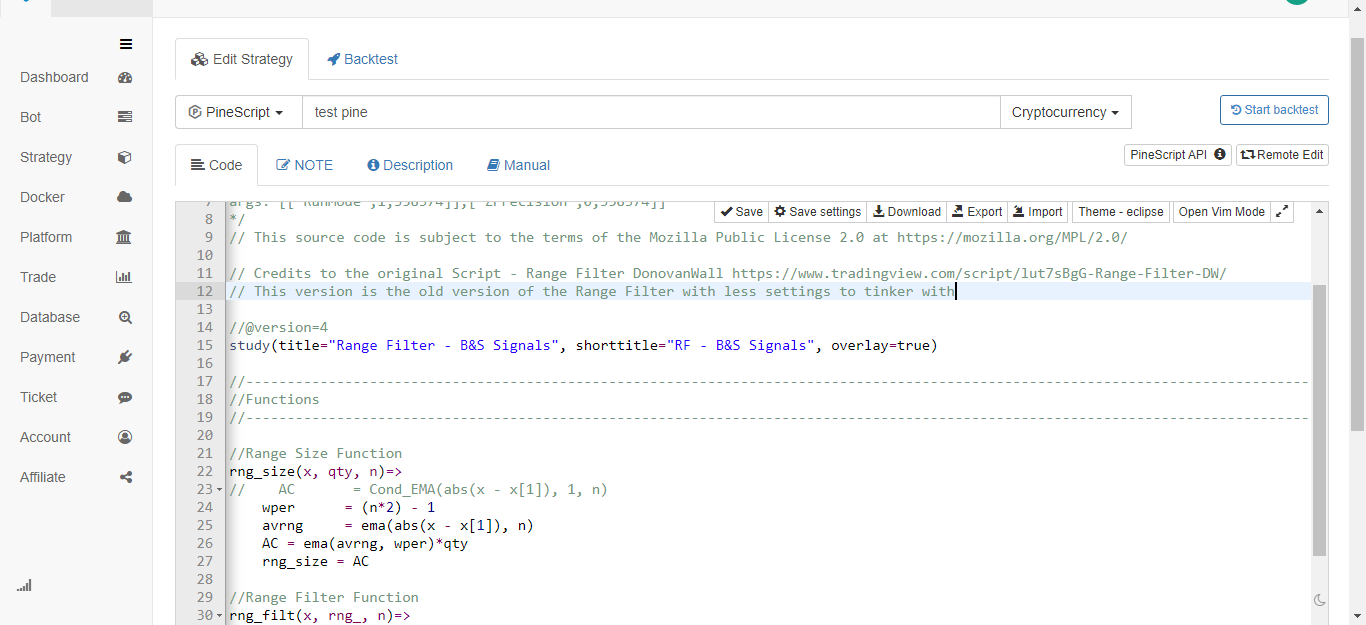
Ngay sau đó, chúng ta viết một đoạn mã ngôn ngữ Pine thực hiện chức năng giao dịch:
// extend
fastEmaPeriod = input(50, "fastEmaPeriod")         // fast line period
slowEmaPeriod = input(200, "slowEmaPeriod")        // slow line period
loss = input(30, "loss")                           // stop loss points
trailPoints = input(30, "trailPoints")             // number of trigger points for moving stop loss
trailOffset = input(30, "trailOffset")             // moving stop profit offset (points)
amount = input(1, "amount")                        // order amount

emaFast = ta.ema(close, fastEmaPeriod)             // calculate the fast line EMA
emaSlow = ta.ema(close, slowEmaPeriod)             // calculate the slow line EMA

buyCondition = longCondition and emaFast > emaSlow and close > open and close > emaFast         // entry conditions for long positions
sellCondition = shortCondition and emaFast < emaSlow and close < open and close < emaFast       // entry conditions for short positions

if buyCondition and strategy.position_size == 0
    strategy.entry("long", strategy.long, amount)
    strategy.exit("exit_long", "long", amount, loss=loss, trail_points=trailPoints, trail_offset=trailOffset)
if sellCondition and strategy.position_size == 0
    strategy.entry("short", strategy.short, amount)
    strategy.exit("exit_short", "short", amount, loss=loss, trail_points=trailPoints, trail_offset=trailOffset)
A.Nó có thể thấy rằng khi buyCondition là đúng, đó là:
- Chất biến longCondition là đúng (điểm báo VuManChu Swing Free gửi tín hiệu vị trí dài).
- EmaFast > emaSlow (định vị dài của EMA).
- close > open (có nghĩa là BAR hiện tại là dương tính), close > emaFast (có nghĩa là giá đóng trên đường nhanh EMA).
Ba điều kiện để đi dài giữ.
B.Khi sellCondition là đúng, ba điều kiện để tạo ra một vị trí ngắn được giữ (không được lặp lại ở đây).
Sau đó chúng ta sử dụng chức năng entry.strategy để nhập và mở một vị trí trong trường hợp một nếu điều kiện đánh giá tín hiệu kích hoạt, và thiết lập chức năng exit.strategy để dừng lỗ và lợi nhuận theo dõi cùng một lúc.
Mã hoàn chỉnh
/*backtest
start: 2022-01-01 00:00:00
end: 2022-10-08 00:00:00
period: 15m
basePeriod: 5m
exchanges: [{"eid":"Futures_Binance","currency":"ETH_USDT"}]
args: [["ZPrecision",0,358374]]
*/

// This source code is subject to the terms of the Mozilla Public License 2.0 at https://mozilla.org/MPL/2.0/

// Credits to the original Script - Range Filter DonovanWall https://www.tradingview.com/script/lut7sBgG-Range-Filter-DW/
// This version is the old version of the Range Filter with less settings to tinker with

//@version=4
study(title="Range Filter - B&S Signals", shorttitle="RF - B&S Signals", overlay=true)

//-----------------------------------------------------------------------------------------------------------------------------------------------------------------
//Functions
//-----------------------------------------------------------------------------------------------------------------------------------------------------------------

//Range Size Function
rng_size(x, qty, n)=>
//    AC       = Cond_EMA(abs(x - x[1]), 1, n)
    wper      = (n*2) - 1
    avrng     = ema(abs(x - x[1]), n)
    AC = ema(avrng, wper)*qty
    rng_size = AC

//Range Filter Function
rng_filt(x, rng_, n)=>
    r          = rng_
    var rfilt  = array.new_float(2, x)
    array.set(rfilt, 1, array.get(rfilt, 0))
    if x - r > array.get(rfilt, 1)
        array.set(rfilt, 0, x - r)
    if x + r < array.get(rfilt, 1)
        array.set(rfilt, 0, x + r)
    rng_filt1 = array.get(rfilt, 0)

    hi_band   = rng_filt1 + r
    lo_band   = rng_filt1 - r
    rng_filt  = rng_filt1
    [hi_band, lo_band, rng_filt]

//-----------------------------------------------------------------------------------------------------------------------------------------------------------------
//Inputs
//-----------------------------------------------------------------------------------------------------------------------------------------------------------------

//Range Source
rng_src = input(defval=close, type=input.source, title="Swing Source")

//Range Period
rng_per = input(defval=20, minval=1, title="Swing Period")

//Range Size Inputs
rng_qty   = input(defval=3.5, minval=0.0000001, title="Swing Multiplier")

//Bar Colors
use_barcolor = input(defval=false, type=input.bool, title="Bar Colors On/Off")

//-----------------------------------------------------------------------------------------------------------------------------------------------------------------
//Definitions
//-----------------------------------------------------------------------------------------------------------------------------------------------------------------

//Range Filter Values
[h_band, l_band, filt] = rng_filt(rng_src, rng_size(rng_src, rng_qty, rng_per), rng_per)

//Direction Conditions
var fdir = 0.0
fdir    := filt > filt[1] ? 1 : filt < filt[1] ? -1 : fdir
upward   = fdir==1 ? 1 : 0
downward = fdir==-1 ? 1 : 0

//Trading Condition
longCond = rng_src > filt and rng_src > rng_src[1] and upward > 0 or rng_src > filt and rng_src < rng_src[1] and upward > 0
shortCond = rng_src < filt and rng_src < rng_src[1] and downward > 0 or rng_src < filt and rng_src > rng_src[1] and downward > 0

CondIni = 0
CondIni := longCond ? 1 : shortCond ? -1 : CondIni[1]
longCondition = longCond and CondIni[1] == -1
shortCondition = shortCond and CondIni[1] == 1

//Colors
filt_color = upward ? #05ff9b : downward ? #ff0583 : #cccccc
bar_color  = upward and (rng_src > filt) ? (rng_src > rng_src[1] ? #05ff9b : #00b36b) :
             downward and (rng_src < filt) ? (rng_src < rng_src[1] ? #ff0583 : #b8005d) : #cccccc

//-----------------------------------------------------------------------------------------------------------------------------------------------------------------
//Outputs
//-----------------------------------------------------------------------------------------------------------------------------------------------------------------

//Filter Plot
filt_plot = plot(filt, color=filt_color, transp=67, linewidth=3, title="Filter")

//Band Plots
h_band_plot = plot(h_band, color=color.new(#05ff9b, 100), title="High Band")
l_band_plot = plot(l_band, color=color.new(#ff0583, 100), title="Low Band")

//Band Fills
fill(h_band_plot, filt_plot, color=color.new(#00b36b, 92), title="High Band Fill")
fill(l_band_plot, filt_plot, color=color.new(#b8005d, 92), title="Low Band Fill")

//Bar Color
barcolor(use_barcolor ? bar_color : na)

//Plot Buy and Sell Labels
plotshape(longCondition, title = "Buy Signal", text ="BUY", textcolor = color.white, style=shape.labelup, size = size.normal, location=location.belowbar, color = color.new(color.green, 0))
plotshape(shortCondition, title = "Sell Signal", text ="SELL", textcolor = color.white, style=shape.labeldown, size = size.normal, location=location.abovebar, color = color.new(color.red, 0))

//Alerts
alertcondition(longCondition, title="Buy Alert", message = "BUY")
alertcondition(shortCondition, title="Sell Alert", message = "SELL")


// extend
fastEmaPeriod = input(50, "fastEmaPeriod")
slowEmaPeriod = input(200, "slowEmaPeriod")
loss = input(30, "loss")
trailPoints = input(30, "trailPoints")
trailOffset = input(30, "trailOffset")
amount = input(1, "amount")

emaFast = ta.ema(close, fastEmaPeriod)
emaSlow = ta.ema(close, slowEmaPeriod)

buyCondition = longCondition and emaFast > emaSlow and close > open and close > emaFast
sellCondition = shortCondition and emaFast < emaSlow and close < open and close < emaFast

if buyCondition and strategy.position_size == 0
    strategy.entry("long", strategy.long, amount)
    strategy.exit("exit_long", "long", amount, loss=loss, trail_points=trailPoints, trail_offset=trailOffset)
if sellCondition and strategy.position_size == 0
    strategy.entry("short", strategy.short, amount)
    strategy.exit("exit_short", "short", amount, loss=loss, trail_points=trailPoints, trail_offset=trailOffset)
Kiểm tra hậu quả
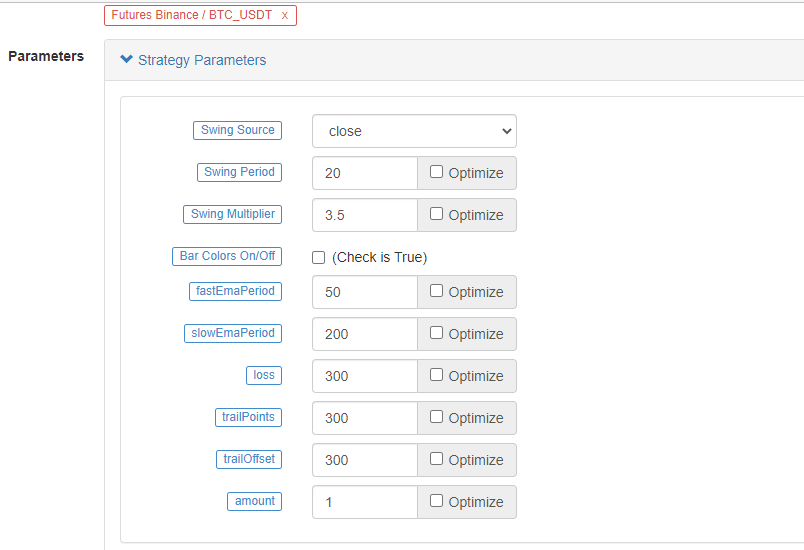
Phạm vi thời gian của backtest là từ tháng 1 năm 2022 đến tháng 10 năm 2022. Thời gian K-line là 15 phút và mô hình giá đóng được sử dụng cho backtest. Thị trường chọn hợp đồng vĩnh cửu Binance ETH_USDT. Các thông số được đặt theo 50 thời gian của đường dây nhanh và 200 thời gian của đường dây chậm trong video nguồn. Các thông số khác vẫn không thay đổi theo mặc định. Tôi đặt điểm dừng lỗ và theo dõi điểm dừng lợi nhuận lên 30 điểm theo chủ quan.
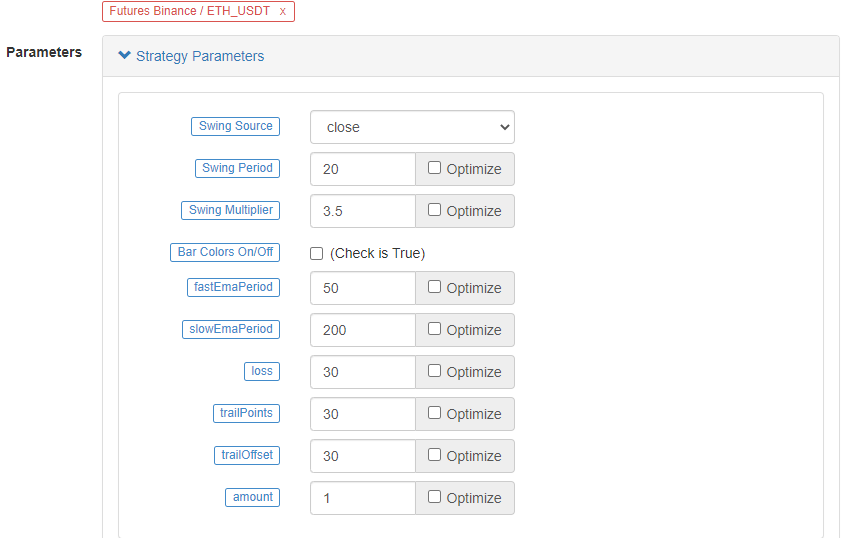
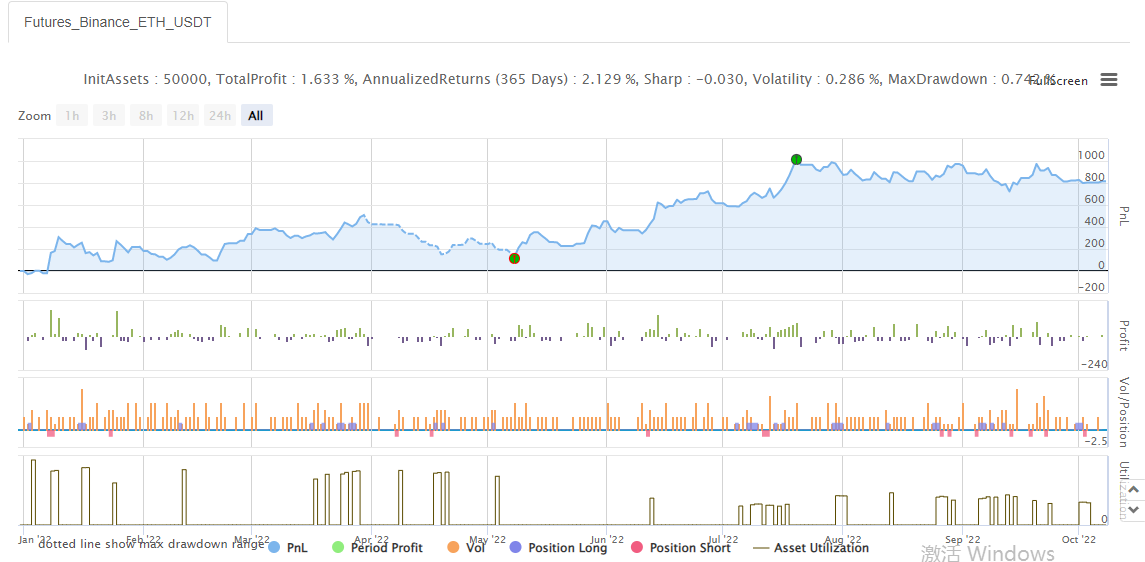
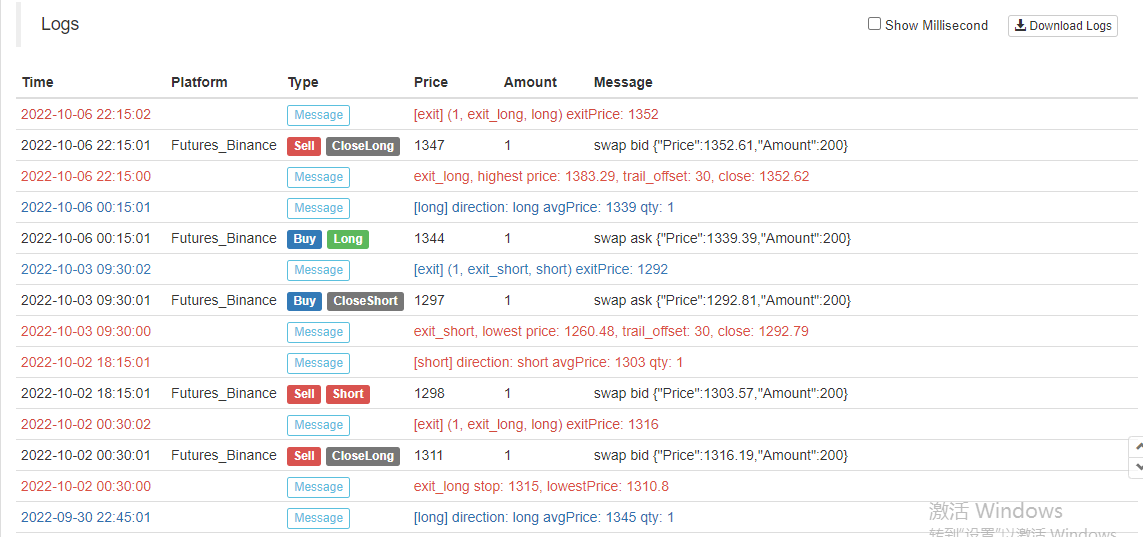
Kết quả của backtesting là bình thường, và dường như các thông số stop-loss có một số ảnh hưởng đến kết quả backtesting. Tôi cảm thấy rằng khía cạnh này vẫn cần được tối ưu hóa và thiết kế. Tuy nhiên, sau khi tín hiệu chiến lược kích hoạt giao dịch, tỷ lệ thắng vẫn ổn.
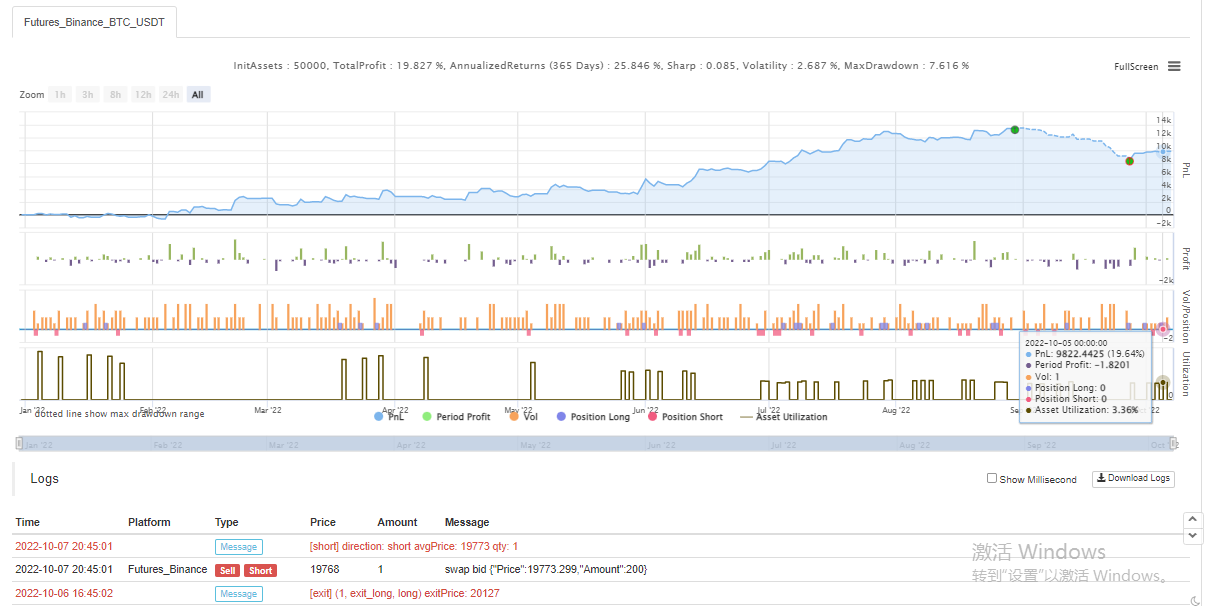
Hãy thử một hợp đồng vĩnh cửu BTC_USDT khác:
Kết quả của backtest trên BTC cũng rất có lợi:

Chiến lược từ:https://www.fmz.com/strategy/385745
Có vẻ như phương pháp giao dịch này tương đối đáng tin cậy để nắm bắt xu hướng, bạn có thể tiếp tục tối ưu hóa thiết kế theo ý tưởng này. Trong bài viết này, chúng tôi không chỉ tìm hiểu về ý tưởng của chiến lược trung bình động đôi, mà còn học cách xử lý và học chiến lược của các cựu chiến binh trên YouTube. OK, mã chiến lược trên chỉ là gạch và vữa của tôi, kết quả backtest không đại diện cho kết quả thực tế cụ thể của robot, mã chiến lược, thiết kế chỉ để tham khảo. Cảm ơn sự hỗ trợ của bạn, chúng tôi sẽ gặp bạn lần sau!
- Thực hành định lượng của DEX Exchange (2) -- Hướng dẫn người dùng Hyperliquid
- DEX giao dịch định lượng thực hành ((2) -- Hyperliquid sử dụng hướng dẫn
- Thực hành định lượng của DEX Exchange (1) -- dYdX v4 User Guide
- Giới thiệu về trọng tài lead-lag trong tiền điện tử (3)
- DEX giao dịch định lượng thực hành ((1) -- dYdX v4 hướng dẫn sử dụng
- Giới thiệu về bộ phận Lead-Lag trong tiền kỹ thuật số (3)
- Giới thiệu về Trọng tài Lead-Lag trong Cryptocurrency (2)
- Giới thiệu về bộ phận Lead-Lag trong tiền kỹ thuật số (2)
- Thảo luận về tiếp nhận tín hiệu bên ngoài của nền tảng FMZ: Một giải pháp hoàn chỉnh để tiếp nhận tín hiệu với dịch vụ Http tích hợp trong chiến lược
- Phân tích nhận tín hiệu bên ngoài nền tảng FMZ: Chiến lược xây dựng dịch vụ HTTP để nhận tín hiệu
- Giới thiệu về Trọng tài Lead-Lag trong Cryptocurrency (1)
- Lãi suất trọng tài của Binance Perpetual Funding Rate (Thị trường tăng hiện tại được tính hàng năm 100%)
- Chiến lược điểm chuyển đổi tiền tệ kỹ thuật số tương lai (Hướng dẫn)
- Đăng ký Chiến lược cổ phiếu mới cho Tiền kỹ thuật số Spot (Hướng dẫn)
- Thực hiện một ý tưởng với 60 dòng mã - Chiến lược đánh bắt cá dưới hợp đồng
- Chiến lược EMA hai dạng đa dạng tiền tệ kỹ thuật số (Hướng dẫn)
- Thiết kế hệ thống quản lý đồng bộ hóa đơn đặt hàng dựa trên FMZ Quant (2)
- Chiến lược ATR đa loài tương lai tiền tệ kỹ thuật số (bài hướng dẫn)
- Viết một công cụ giao dịch bán tự động bằng cách sử dụng ngôn ngữ Pine
- Khám phá thiết kế chiến lược tần số cao từ sự thay đổi ma thuật của LeeksReaper
- Phân tích chiến lược của LeeksReaper (2)
- Thực hiện ngôn ngữ JavaScript của các chỉ số Fisher và vẽ trên FMZ
- Ví dụ về thiết kế chiến lược dYdX
- Thiết kế hệ thống quản lý đồng bộ hóa đơn hàng dựa trên FMZ Quant (1)
- Phân tích chiến lược của LeeksReaper (1)
- Định nghĩa của các khoản đầu tư khác
- Tình trạng gần đây và hoạt động khuyến nghị của chiến lược tỷ lệ tài trợ
- Xem xét thị trường tiền kỹ thuật số năm 2021 và chiến lược đơn giản nhất 10 lần bỏ lỡ
- Mô hình yếu tố tiền tệ kỹ thuật số
- Từ YouTube: "Chiến lược đường thẳng EMA đôi kỳ diệu"
- Viết một công cụ giao dịch bán tự động bằng ngôn ngữ Pine