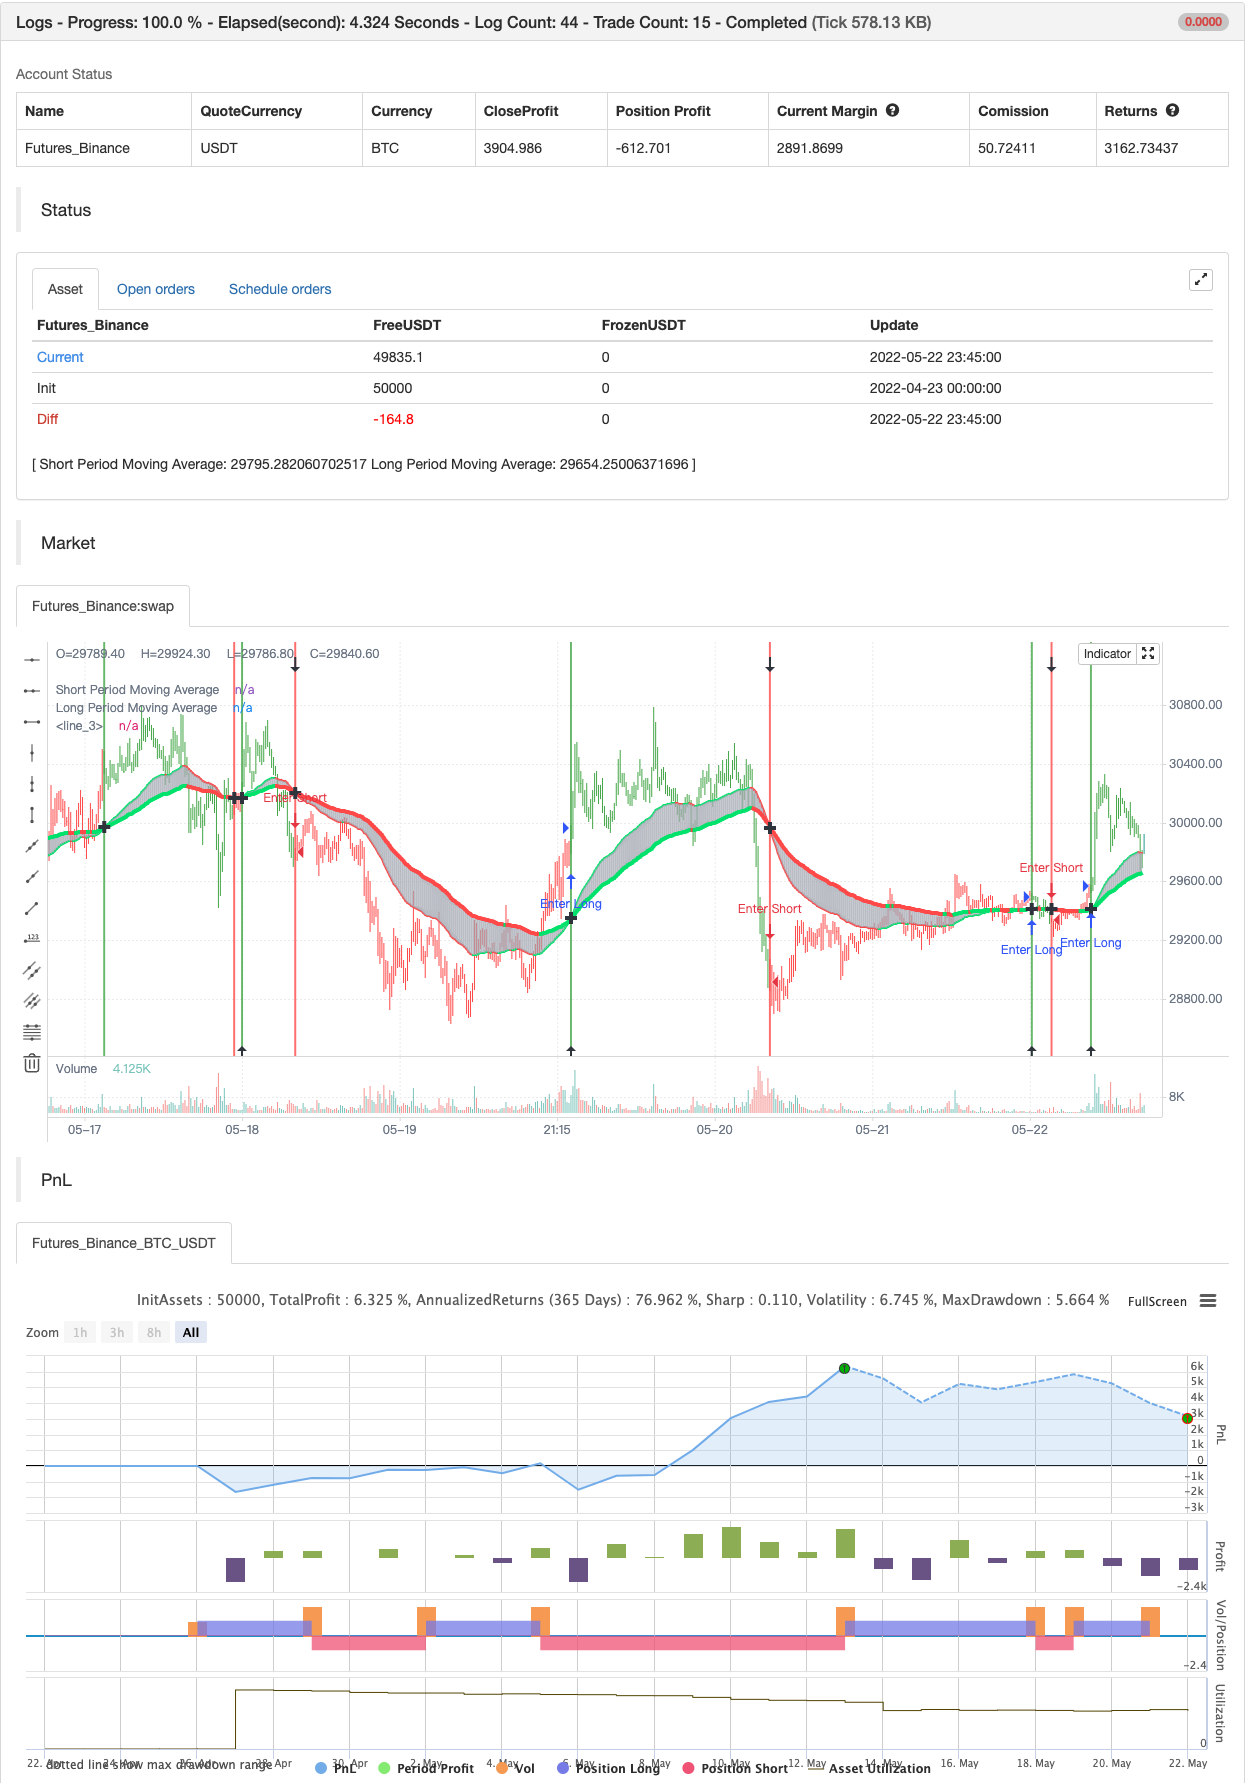
Cảnh báo chéo trung bình chuyển động, nhiều khung thời gian (MTF)
Tác giả:ChaoZhang, Ngày: 2022-05-24 11:23:02Tags:SMAEMAWMA
Xem khi nào hai đường trung bình động giao nhau.
SMA = trung bình di chuyển đơn giản EMA = trung bình động theo cấp số nhân (bên định) WMA = trung bình động cân nhắc Đường thẳng = hồi quy đường thẳng
Các đường trung bình di chuyển có thể được vẽ từ các khung thời gian khác nhau, chẳng hạn như khung thời gian hàng tuần hoặc 4 giờ sử dụng HL2, HLC3 hoặc OHLC4 làm nguồn giá để tính toán. Ngoài ra còn có cảnh báo màu nền và mũi tên khi các đường trung bình di chuyển giao nhau khi giá cũng tăng hoặc giảm. Và các đường trung bình di chuyển được màu tùy thuộc vào hướng xu hướng của chúng (nếu chúng có xu hướng tăng hoặc giảm).
backtest

/*backtest
start: 2022-04-23 00:00:00
end: 2022-05-22 23:59:00
period: 15m
basePeriod: 5m
exchanges: [{"eid":"Futures_Binance","currency":"BTC_USDT"}]
*/

study("Moving Average Cross Alert, Multi-Timeframe Option (MTF) (by ChartArt)", shorttitle="CA_-_MA_cross", overlay=true)

// ChartArt's Moving Average Cross Indicator
//
// Version 1.0
// Idea by ChartArt on September 15, 2015.
//
// This indicator shows when two moving averages cross.
// With the option to choose between four moving
// average calculations:
// (SMA = simple moving average)
// (EMA = exponential moving average)
// (WMA = weighted moving average)
// (Linear = Linear regression)
//
// The moving averages can be plotted from different
// timeframes, like the weekly or 4 hour timeframe.
// With the possibility to use HL2, HLC3 or OHLC4 prices.
//
// In addition there is a background color alert
// and arrows when the moving averages cross each other.
// And the moving averages are colored depending if
// they are trending up or down.
//
// List of my work:
// https://www.tradingview.com/u/ChartArt/

//@version=4
// Multi-timeframe and price input
pricetype = input(close, title="Price Source For The Moving Averages")
useCurrentRes = input(true, title="Use Current Timeframe As Resolution?")
resCustom = input(title="Use Different Timeframe? Then Uncheck The Box Above", defval="W")
res = useCurrentRes ? timeframe.period : resCustom
price = security(syminfo.tickerid, res, pricetype)

// MA period input
shortperiod = input(50, title="Short Period Moving Average")
longperiod = input(100, title="Long Period Moving Average")

// MA calculation
smoothinput = input(2, minval=1, maxval=4, title='Moving Average Calculation: (1 = SMA), (2 = EMA), (3 = WMA), (4 = Linear)')
short = smoothinput == 1 ? sma(price, shortperiod) :
   smoothinput == 2 ? ema(price, shortperiod) :
   smoothinput == 3 ? wma(price, shortperiod) :
   smoothinput == 4 ? linreg(price, shortperiod,0) :
   na
long = smoothinput == 1 ? sma(price, longperiod) :
   smoothinput == 2 ? ema(price, longperiod) :
   smoothinput == 3 ? wma(price, longperiod) :
   smoothinput == 4 ? linreg(price, longperiod,0) :
   na

// MA trend direction color
shortcolor = short > short[1] ? lime : short < short[1] ? red : blue
longcolor = long > long[1] ? lime : long < long[1] ? red : blue

// MA output
MA1 = plot(short, title="Short Period Moving Average", style=linebr, linewidth=2, color=shortcolor)
MA2 = plot(long, title="Long Period Moving Average", style=linebr, linewidth=4, color=longcolor)
fill(MA1, MA2, color=silver, transp=50)

// MA trend bar color
TrendingUp() => short > long
TrendingDown() => short < long
barcolor(TrendingUp() ? green : TrendingDown() ? red : blue)

// MA cross alert
MAcrossing = cross(short, long) ? short : na
plot(MAcrossing, style = cross, linewidth = 4,color=black)

// MA cross background color alert
Uptrend() => TrendingUp() and TrendingDown()[1]
Downtrend() => TrendingDown() and TrendingUp()[1]
bgcolor(Uptrend() ? green : Downtrend() ? red : na,transp=50)

// Buy and sell alert
Buy = Uptrend() and close > close[1]
Sell = Downtrend() and close < close[1]
plotshape(Buy, color=black, style=shape.arrowup, text="Buy", location=location.bottom)
plotshape(Sell, color=black, style=shape.arrowdown, text="Sell", location=location.top)


if Buy
    strategy.entry("Enter Long", strategy.long)
else if Sell
    strategy.entry("Enter Short", strategy.short)
Nội dung liên quan
- HALFTREND + HEMA + SMA (Chiến lược tín hiệu sai)
- Tỷ lệ năng lượng hướng tăng tốc theo khối lượng RedK
- Đường trung bình trượt và chiến lược giao dịch định lượng dây chuyền Brin
- RedK Dual VADER với thanh năng lượng
- RedK Momentum Bars
- Rainbow Oscillator
- Hệ thống chiến lược năng lượng đa chu kỳ
- Phương pháp giao dịch đa đồng xu
- Hệ thống giao dịch xu hướng hỗn hợp đột phá giá lịch sử (HBTS)
- Super Scalper
Nhiều hơn nữa
- Triangle Leverage (Lợi nhuận từ giá giao dịch của các đồng tiền nhỏ)
- bybit Reverse Contract Dynamic Grid (Mạng lưới đặc biệt)
- TradingView Alerts cho MT4 MT5 + biến động động
- Dòng ma trận
- Super Scalper - 5 phút 15 phút
- Chỉ số sức mạnh tương đối - Sự khác biệt - Libertus
- Phục hồi tuyến tính ++
- RedK Dual VADER với thanh năng lượng
- Khu vực hợp nhất - Sống
- Ước tính định lượng định chất
- MACD Reloaded STRATEGY
- Đường trung bình di chuyển siêu xu hướng
- Giao dịch ABC
- 15MIN BTCUSDTPERP BOT
- Shannon Entropy V2
- SUPERTREND ATR WITH TRAILING STOP LOSS
- Dòng lưu lượng v3
- tương lai tiền điện tử scalping hàng giờ với ma & rsi - ogcheckers
- ATR được làm mịn
- Order Block Finder