Chiến lược định lượng trung bình động thích ứng
Tổng quan
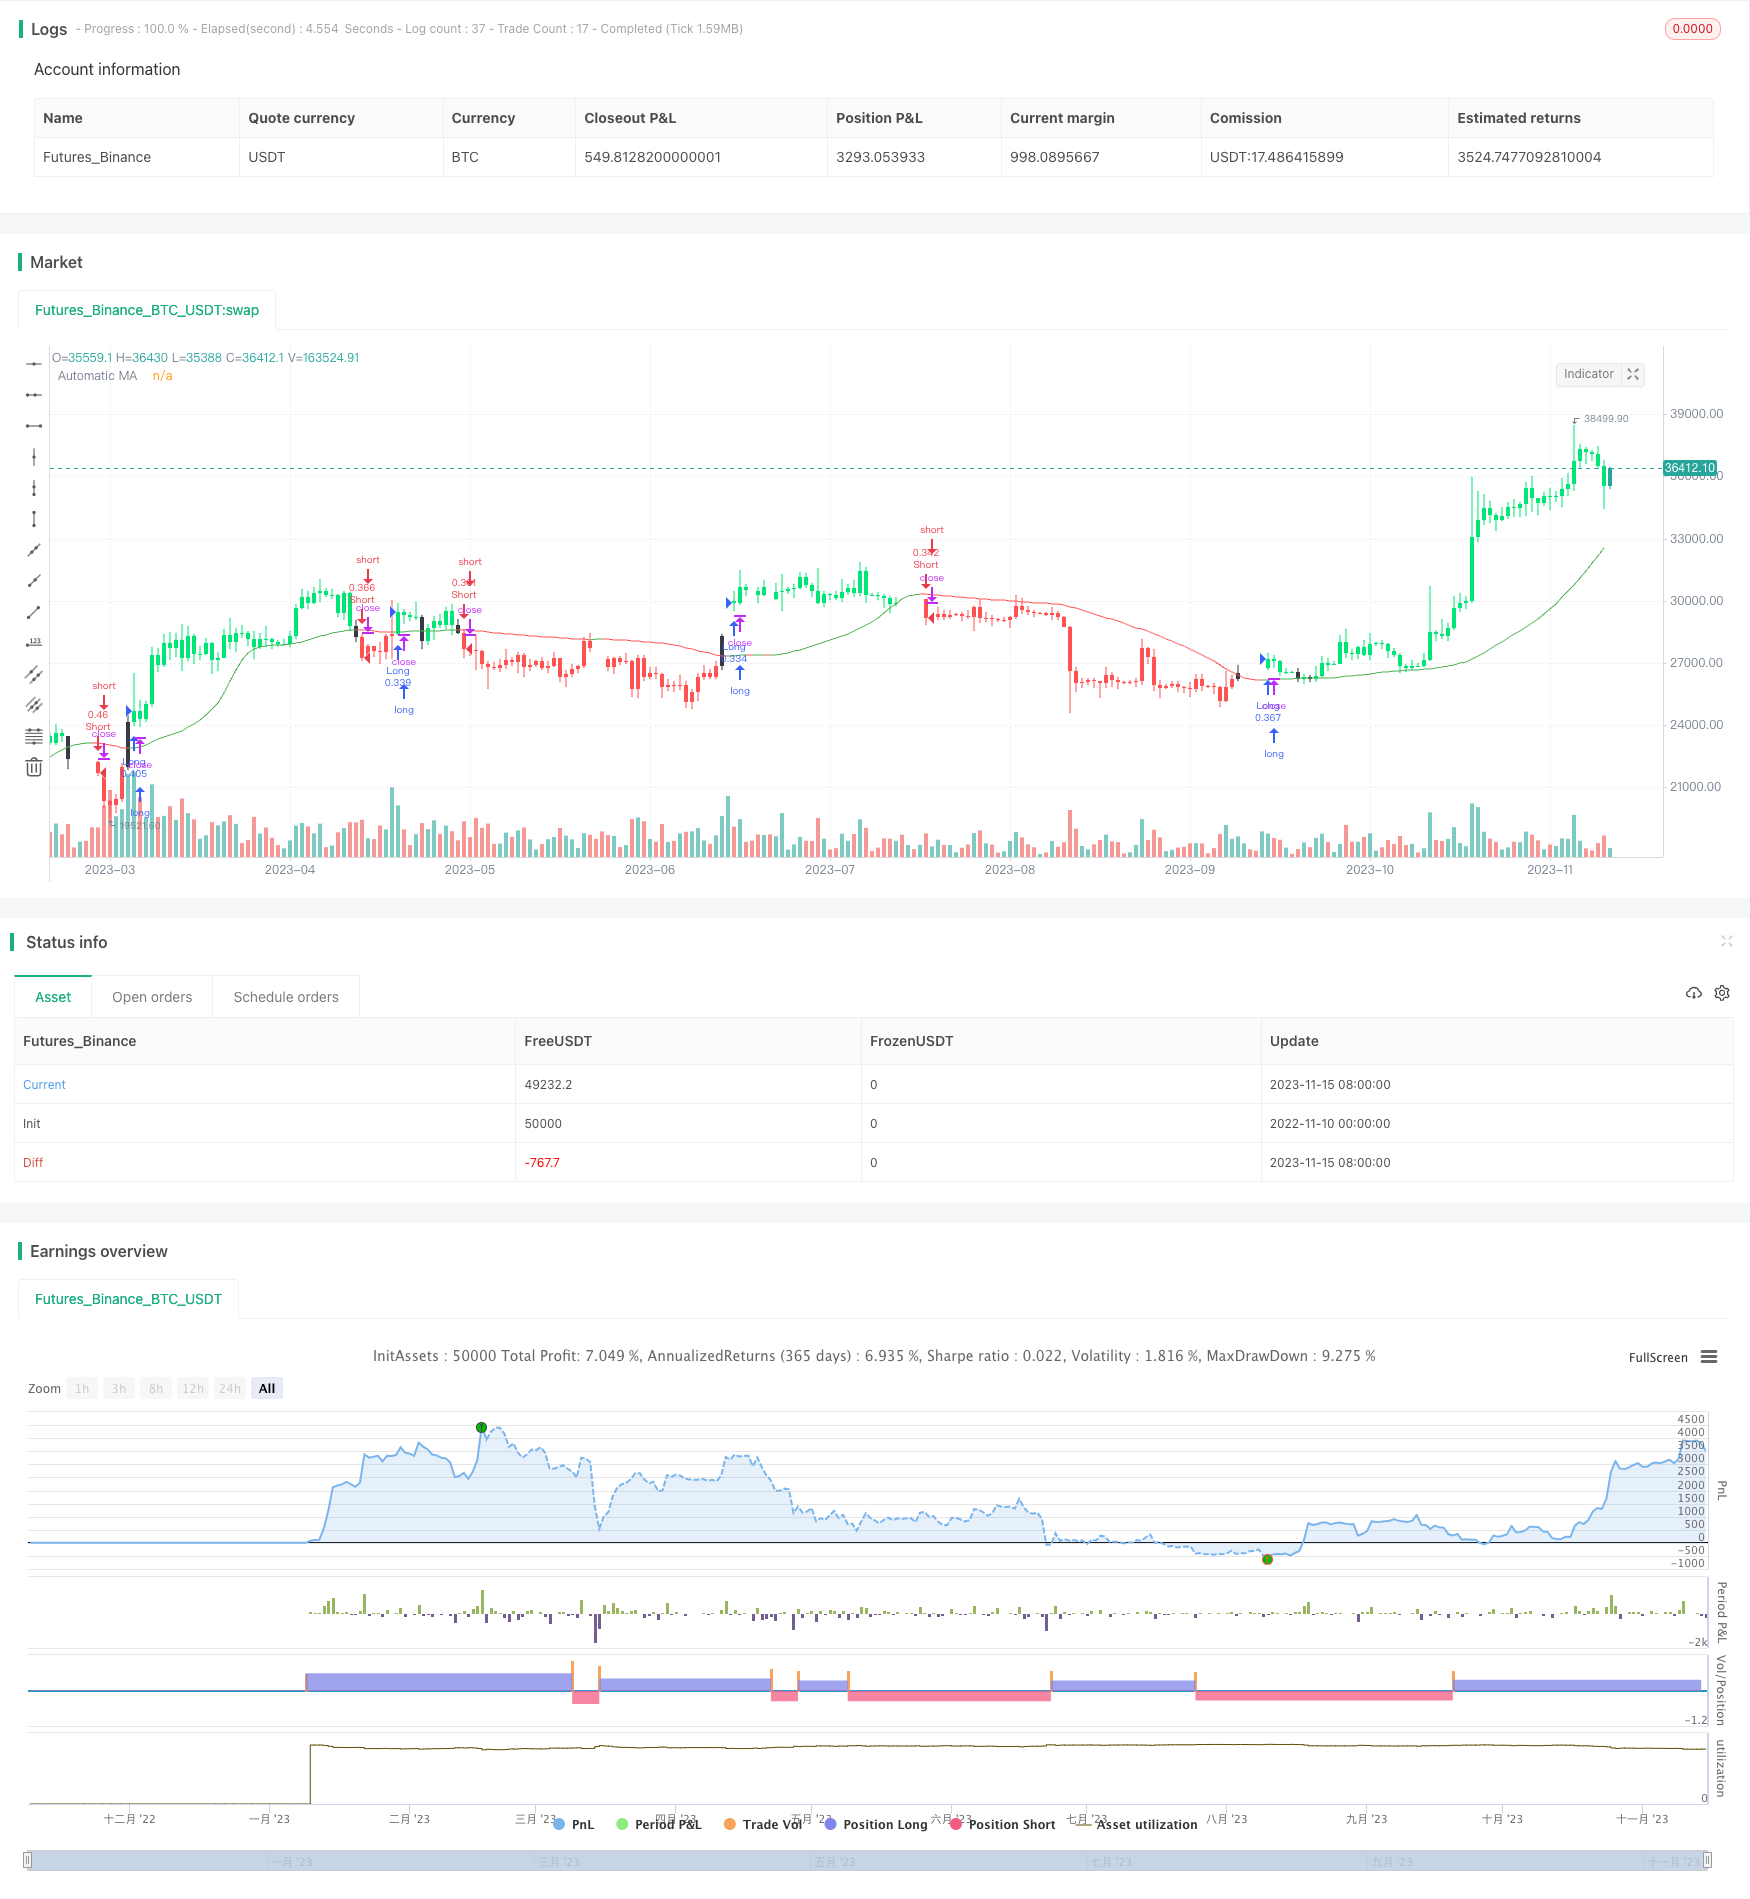
Chiến lược này dựa trên đường trung bình di chuyển, có thể tự động điều chỉnh các tham số, phù hợp với thị trường biến động với chu kỳ thời gian cao. Nó có thể tự động tìm ra sự kết hợp tham số tốt nhất, tạo ra tín hiệu giao dịch khi giá vượt qua đường trung bình di chuyển.
Nguyên tắc chiến lược
Chiến lược này sử dụng đường trung bình di chuyển thích ứng như một tín hiệu giao dịch. Đầu tiên, tính toán đường trung bình di chuyển đơn giản (SMA) cho một chu kỳ nhất định (start). Sau đó, kiểm tra các kết hợp tham số xung quanh CMA để xác định đường CMA nào trong kết hợp được chạm ít nhất bởi thực thể đường K và đường bóng. Cuối cùng, sử dụng tín hiệu CMA ít chạm nhất làm đường.
Cụ thể, chiến lược sẽ kiểm tra các đường CMA, đường thực thể thống kê và đường bóng chạm vào chúng sau chu kỳ CMA cộng 1 ((CMA_P1)) và trừ 1 ((CMA_M1). Nếu CMA chạm vào ít hơn CMA_P1 và CMA_M1, thì giữ chu kỳ CMA hiện tại; Nếu CMA_P1 chạm ít hơn, thì thêm chu kỳ CMA1; Nếu CMA_M1 chạm ít hơn, thì giảm chu kỳ CMA 1 ̇ Như vậy, một CMA tương đối mịn được tìm thấy như một đường tín hiệu ̇
Khi giá từ dưới lên phá vỡ CMA, tạo ra tín hiệu mua; khi giá từ trên xuống phá vỡ CMA, tạo ra tín hiệu bán.
Phân tích lợi thế
Chiến lược trung bình di chuyển thích ứng này có những lợi thế sau:
Tự động tìm các tham số tối ưu. Không cần phải lựa chọn các chu kỳ chuyển động trung bình, chiến lược sẽ tự động thử nghiệm các chu kỳ khác nhau để tìm các tham số tối ưu.
Giảm các tín hiệu giả. So với trung bình di chuyển trong chu kỳ cố định, trung bình di chuyển thích ứng có thể loại bỏ nhiều tiếng ồn hơn, do đó giảm nhiều tín hiệu giả.
Thích ứng với sự thay đổi của thị trường. Khi thị trường đi vào xu hướng, chu kỳ trung bình di chuyển sẽ tự động thay đổi để tạo ra tín hiệu; Khi thị trường đi từ xu hướng đến thu hẹp, chu kỳ trung bình di chuyển sẽ tự động ngắn hơn. Vì vậy, chiến lược có thể động thích ứng với sự thay đổi của thị trường.
Hệ thống giao dịch đơn giản. Cách tự điều chỉnh này có thể đơn giản hóa toàn bộ hệ thống giao dịch mà không cần các tham số tối ưu hóa bằng tay.
Khả năng mở rộng. Ý tưởng chiến lược này có thể được mở rộng đến các chỉ số khác, thiết kế các chiến lược thích ứng với Brin Belt, KD thích ứng.
Phân tích rủi ro
Chiến lược này cũng có một số rủi ro cần lưu ý:
Rủi ro của lựa chọn chọn khi thị trường xuất hiện trong thị trường quyền chọn khi thị trường xuất hiện, đường thực tế không thể phá vỡ đường trung bình di chuyển, có thể gây ra tín hiệu sai. Điều kiện lọc cần được thêm vào để giảm thiểu rủi ro này.
Rủi ro thất bại trong đột phá. Không phải tất cả các đột phá trên đường trung bình di chuyển đều có thể tiếp tục. Vì vậy, cần phải thực hiện xác minh đột phá để đảm bảo tỷ lệ đột phá thành công.
Rủi ro đảo ngược xu hướng. Sau khi vào thị trường xu hướng, sự đảo ngược cần phải chuyển hướng kịp thời, nếu không sẽ gây ra tổn thất.
Rủi ro tối ưu hóa tham số. Các tham số tự điều chỉnh có thể bị rơi vào tối ưu hóa cục bộ, do đó tạo ra các trung bình di chuyển rõ ràng.
Rủi ro quá tối ưu hóa. Các tham số điều chỉnh thích ứng có thể được tối ưu hóa quá mức, trong khi mất khả năng tổng quát của mô hình. Cần xác minh trong một thời gian dài trong các môi trường thị trường khác nhau và không thể phụ thuộc quá nhiều vào kết quả kiểm tra lại.
Hướng tối ưu hóa
Chiến lược trung bình di chuyển thích ứng này có thể được tối ưu hóa bằng cách:
Tham gia vào cơ chế xác minh phá vỡ xu hướng để lọc các phá vỡ giả mạo bằng cách phá vỡ liên tục.
Thêm chiến lược dừng lỗ, dừng lỗ khi giá quay trở lại phía bên kia của đường trung bình di chuyển.
Tăng cơ chế lọc quyền chọn để tránh tín hiệu sai trong thị trường quyền chọn nhị phân.
Tiếp tục giới thiệu các chỉ số đánh giá để hạn chế điều chỉnh tham số, chẳng hạn như IC, LIC, SIC, v.v., để tránh các tham số được tối ưu hóa quá mức.
Mở rộng đến các chỉ số khác, thiết kế chiến lược thích nghi với Gold Fork Dead Fork, chiến lược thích nghi với Brin Belt, v.v.
Tối ưu hóa cách tính toán trung bình di chuyển, sử dụng trung bình di chuyển có trọng lượng, trung bình di chuyển chỉ số và trung bình di chuyển trơn.
Tóm tắt
Chiến lược này tạo ra tín hiệu giao dịch bằng cách tự điều chỉnh chu kỳ trung bình di chuyển, tìm kiếm tham số tối ưu. So với tham số cố định, nó có thể làm giảm nhiều tín hiệu giả, thích ứng với sự thay đổi của thị trường. Nhưng chúng ta cũng cần lưu ý một số rủi ro tiềm ẩn, cần phải xác minh và tối ưu hóa chiến lược để có thể kiếm được lợi nhuận ổn định trong giao dịch thực tế.
||
Overview
This strategy is based on moving average, can automatically adjust parameters, and is suitable for wavy markets at high timeframes. It can automatically find the optimal parameter combination and generate trading signals when price breaks through the moving average line.
Strategy Logic
This strategy uses an adaptive moving average as trading signal. First it calculates the simple moving average (CMA) of the specified period (start). Then it tests the CMA parameters around the period, judging which combination has the least touches by candlestick body and wick. Finally it uses the CMA with the least touches as the signal line.
Specifically, the strategy tests the CMA with period plus 1 (CMA_P1) and minus 1 (CMA_M1), counts the number of touches by body and wick. If CMA has less touches than CMA_P1 and CMA_M1, then keep the current period; if CMA_P1 has less touches, then increase the period by 1; if CMA_M1 has less touches, then decrease the period by 1. This finds a relatively smooth CMA as the signal line.
When price breaks through CMA upward, a buy signal is generated; when price breaks through CMA downward, a sell signal is generated.
Advantage Analysis
This adaptive moving average strategy has the following advantages:
Automatically find optimal parameters. No need to manually select moving average period, the strategy will test different periods and find the optimum.
Reduce false signals. Compared with fixed period MA, the adaptive MA can filter out more noise and reduce many false signals.
Adapt to market changes. When market switches from range-bound to trending, the MA period will automatically increase to generate signals; when market switches from trending to range-bound, the MA period will automatically decrease. So the strategy can dynamically adapt to market changes.
Simplify trading system. This adaptive method can simplify the whole trading system without manual parameter optimization.
Good scalability. The concept can be applied to other indicators like adaptive Bollinger Bands, adaptive KD etc.
Risk Analysis
There are also some risks to note for this strategy:
Call option risk. When market has a call option pattern, the candle body may fail to break the MA line, resulting in wrong signals. Filter conditions need to be added to reduce such risk.
Failed breakout risk. MA breakout does not always continuation, some failed breakouts may occur. Breakout validation is needed to ensure high success rate.
Trend reversal risk. Trend reversal after entering the trend needs to be switched timely, otherwise it may cause losses. Stop loss should be set to control the loss.
Parameter optimization risk. Adaptive adjusted parameters may fall into local optimization, resulting in redundant MAs. Model evaluation methods need to be introduced to avoid this problem.
Overfitting risk. Excessive parameter tuning may lead to overfitting and lose the model generalization ability. Prolonged verification in different market environments is needed, not just rely on backtest results.
Improvement Directions
Some directions to improve this adaptive MA strategy:
Add trend breakout validation via consecutive breakouts to filter false breakouts.
Increase stop loss strategy, stop loss when price moves back to the other side of MA.
Add option filter to avoid wrong signals when call option appears.
Introduce evaluation metrics like IC, LIC, SIC etc. to constrain parameter tuning and prevent overfitting.
Expand to other indicators like adaptive golden cross strategy, adaptive Bollinger Bands etc.
Optimize MA calculation by using weighted MA, exponential MA etc. to get smoother MA.
Summary
This strategy generates trading signals by adaptively adjusting the MA period to find optimal parameters. Compared with fixed parameters, it can reduce many false signals and adapt to market changes. But we also need to watch out for potential risks, and do verification and walk-forward optimization before applying it in live trading for steady profits.
[/trans]
/*backtest
start: 2022-11-10 00:00:00
end: 2023-11-16 00:00:00
period: 1d
basePeriod: 1h
exchanges: [{"eid":"Futures_Binance","currency":"BTC_USDT"}]
*/

// This source code is subject to the terms of the Mozilla Public License 2.0 at https://mozilla.org/MPL/2.0/
// © fondDealer96636

//@version=5

strategy('Automatic Moving Average', overlay=true, max_bars_back=201, pyramiding=0, currency=currency.USD, default_qty_type=strategy.cash, default_qty_value=10000, initial_capital=10000)

// input
start = 20
lookback = input(20, "Sensitivity", tooltip="Low (High Sensitivity), High (Low Sensitivity).\n\nAdjust according to timeframe and asset.")
smoothing = input(3, "Smoothing")
source = input(close, "Source")
startYear = input(2020, "Start year")
resp = 1

in_date_range = time >= timestamp(syminfo.timezone, startYear, 1, 1, 0, 0)

// global
var ix = -1
var mal = array.new_int(0)


// functions
avg(source, len) =>
    sum = 0.0
    for i = 0 to len-1
        sum += source[i]
    sum/len

bull = close > open

wick_touch(x) =>
    bull ? ((close <= x and x <= high) or (low <= x and x <= open)) : ((open <= x and x <= high) or (low <= x and x <= close))

body_touch(x) =>
    bull ? (open < x and x < close) : (close < x and x < open)

touches(t) =>
    touches = 0
    for i = 0 to lookback-1
        touches += t[i] ? 1 : 0
    touches


// local
ix := ix+1
prev_mal = ix >= 1 ? array.get(mal, ix-1) : start

cma = avg(source, prev_mal)
cma_p1 = avg(source, prev_mal+1)
cma_m1 = avg(source, prev_mal-1)

d = touches(wick_touch(cma))
d_p1 = touches(wick_touch(cma_p1))
d_m1 = touches(wick_touch(cma_m1))

d_b = touches(body_touch(cma))
d_p1_b = touches(body_touch(cma_p1))
d_m1_b = touches(body_touch(cma_m1))

any_body_touch = d_b > 0 or d_p1_b > 0 or d_m1_b > 0
no_wick_touch = d <= 0 and d_p1 <= 0 and d_m1 <= 0
wick_maximized = d >= d_p1 and d >= d_m1 ? prev_mal : (d_p1 >= d and d_p1 >= d_m1 ? prev_mal+resp : (d_m1 >= d and d_m1 >= d_p1 ? prev_mal-resp : na))

up = cma > cma[1]
down = cma < cma[1]
against_trend = (up and close < cma) or (down and close > cma)

new_mal = no_wick_touch or against_trend ? prev_mal-resp : (any_body_touch ? prev_mal+resp : wick_maximized)
next_mal = na(new_mal) ? prev_mal : new_mal

array.push(mal, next_mal < 2 ? 2 : (next_mal > 200 ? 200 : next_mal))


// graph
scma = ta.ema(cma, smoothing)

uptrend = scma > scma[1]
downtrend = scma < scma[1]

plot(scma, "Automatic MA", color=uptrend ? color.green : color.red)

uptrending = close > scma and uptrend
downtrending = close < scma and downtrend

defy = not uptrending and not downtrending
defy_cross = defy and body_touch(scma)

barcolor(uptrending ? color.lime : (downtrending ? color.red : (defy_cross ? color.black : color.white)))


// strategy
change_to_uptrend = uptrending and downtrend[1]
change_to_downtrend = downtrending and uptrend[1]

long = in_date_range and change_to_uptrend
short = in_date_range and change_to_downtrend

if long
    strategy.entry("Long", strategy.long)
if short
    strategy.entry("Short", strategy.short)