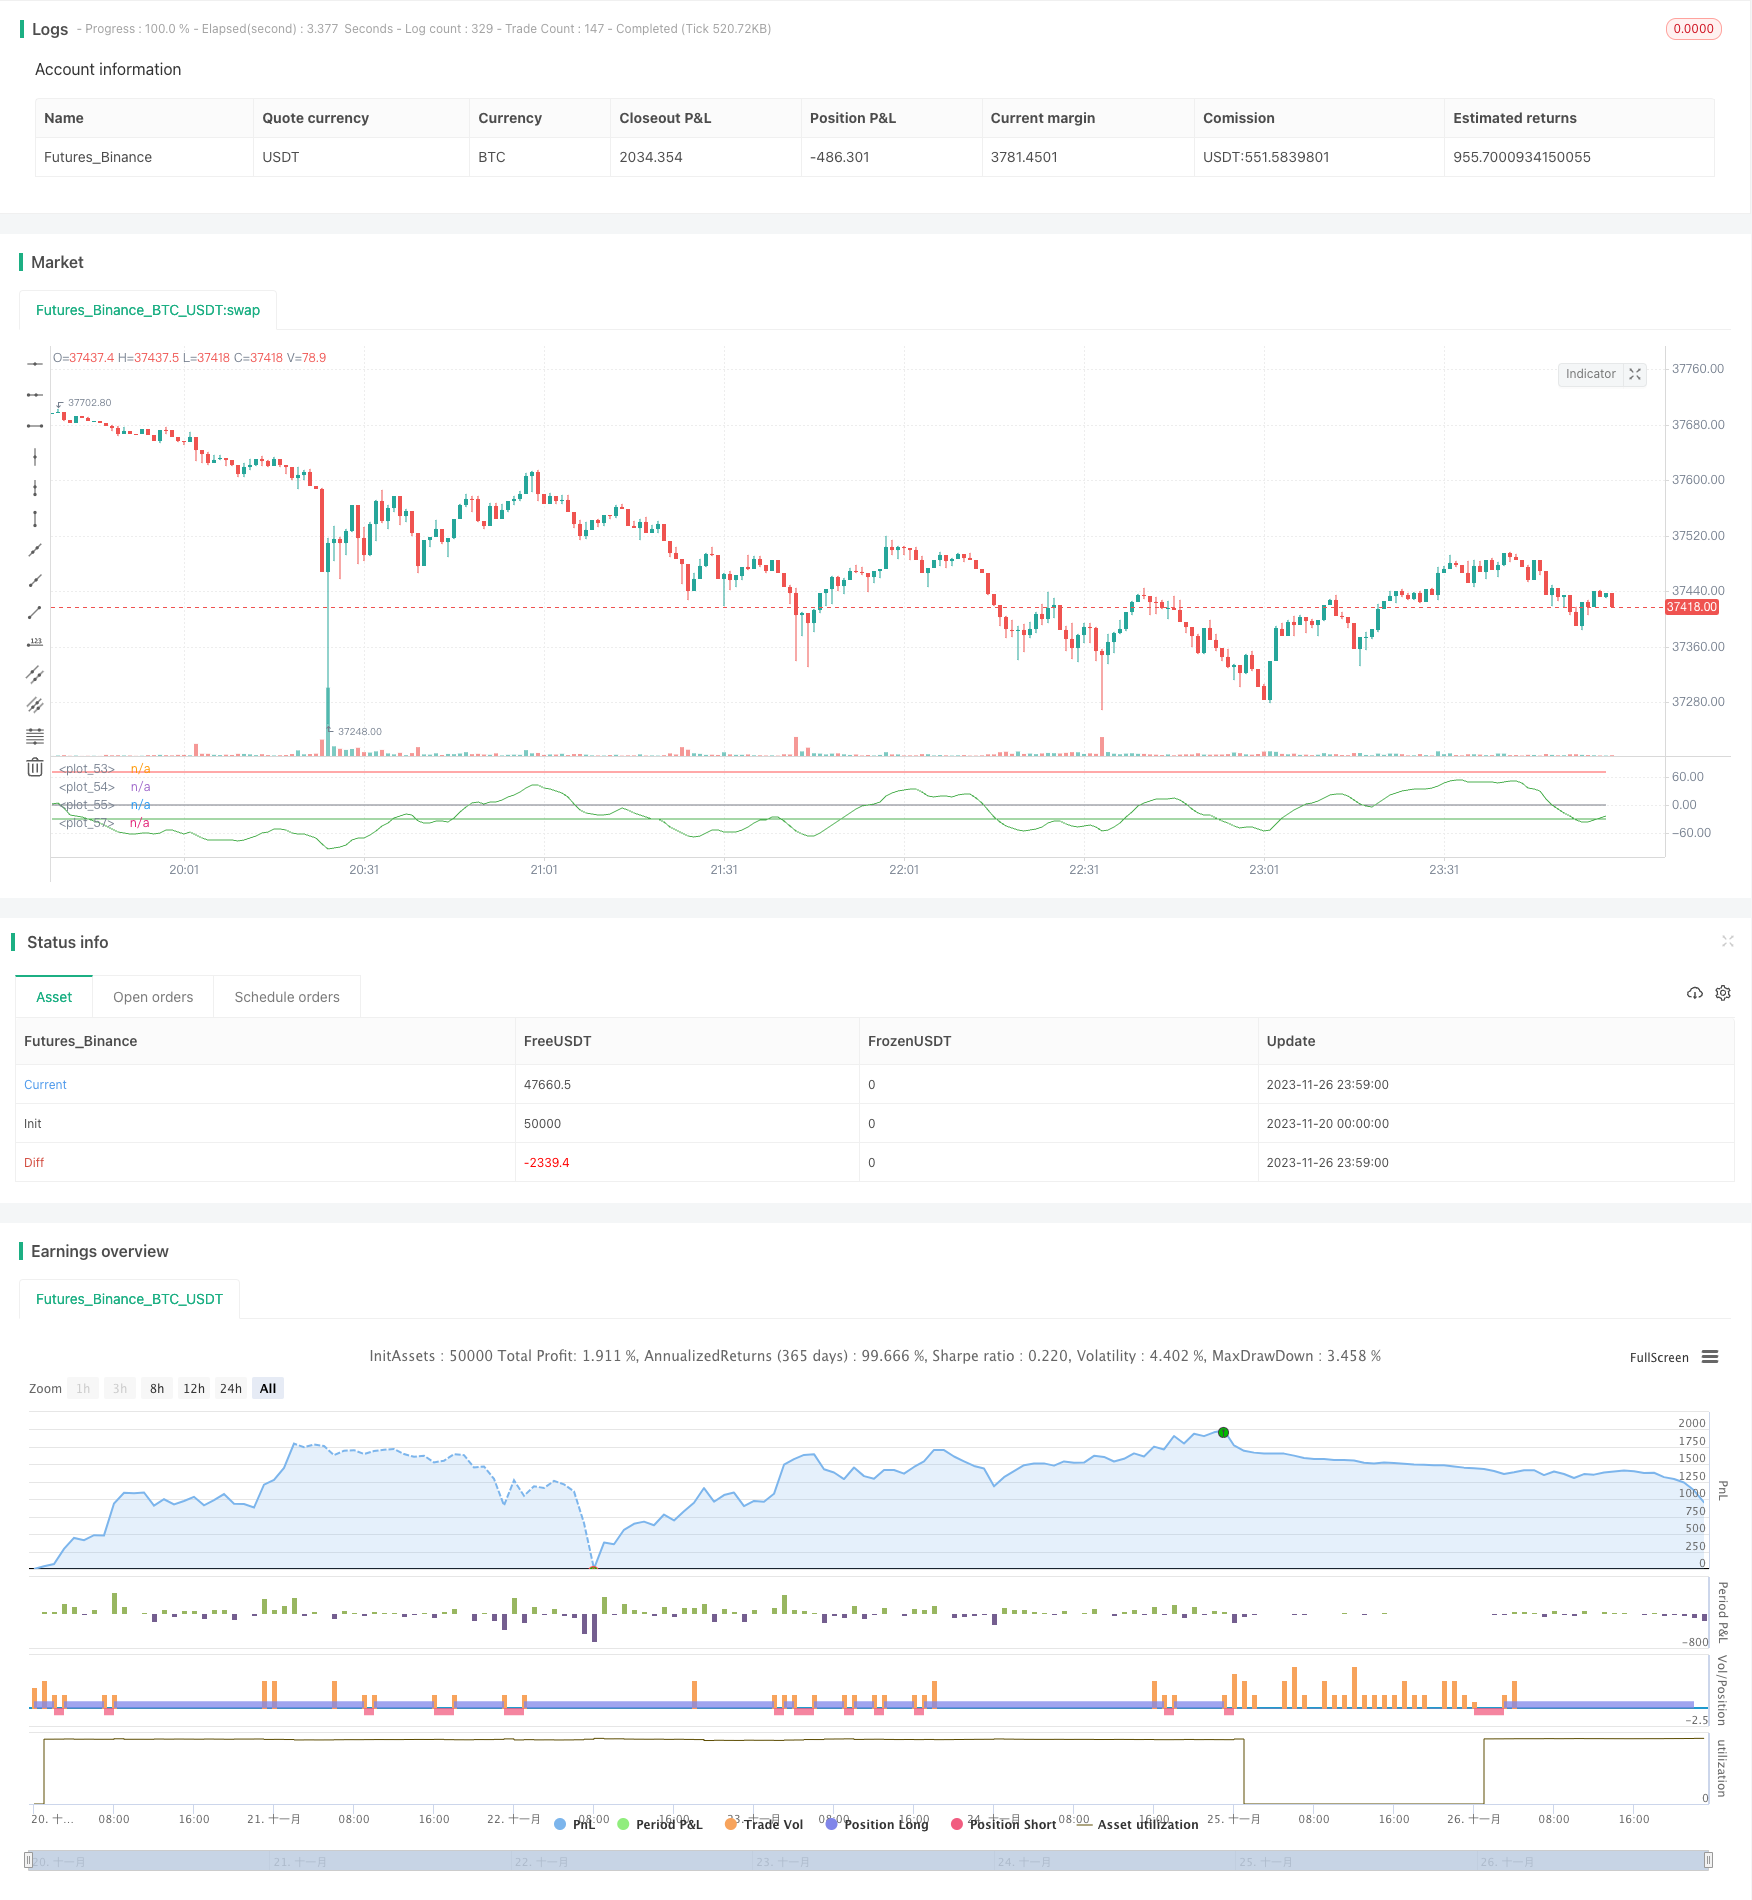
Chiến lược giao dịch định lượng dựa trên xu hướng sóng
Tác giả:ChaoZhang, Ngày: 2023-11-28 16:17:31Tags:

Tổng quan
Chiến lược này được thiết kế dựa trên chỉ số xu hướng sóng. Chỉ số xu hướng sóng kết hợp kênh giá và trung bình động để xác định hiệu quả xu hướng thị trường và tạo ra tín hiệu giao dịch. Chiến lược này đi vào các vị trí dài hoặc ngắn khi đường xu hướng sóng vượt qua các mức chính đại diện cho tình trạng mua quá mức hoặc bán quá mức.
Chiến lược logic
- Tính toán trung bình động tam giác ap của giá cả, cũng như trung bình di chuyển theo cấp số đo esa của ap.
- Tính toán trung bình động hàm số d của sự khác biệt tuyệt đối giữa ap và esa.
- Trả ra chỉ số biến động ci.
- Tính toán trung bình di động của ci trong thời gian n2 để có được chỉ số xu hướng sóng wt1.
- Đặt các đường ngưỡng mua quá mức và bán quá mức.
- Đi dài khi wt1 vượt qua đường bán quá, đi ngắn khi wt1 vượt qua đường mua quá.
Phân tích lợi thế
- Đánh giá xu hướng sóng của mức mua quá mức / bán quá mức có hiệu quả nắm bắt các điểm đảo ngược xu hướng và tạo ra các tín hiệu giao dịch chính xác.
- Kết hợp kênh giá và lý thuyết trung bình động, chỉ số tránh các tín hiệu sai thường xuyên.
- Áp dụng cho tất cả các khung thời gian và nhiều loại công cụ giao dịch.
- Các tham số có thể tùy chỉnh cung cấp trải nghiệm người dùng tốt.
Rủi ro và giải pháp
- Có thể sử dụng thời gian chờ ngắn hơn hoặc kết hợp với các chỉ số khác để lọc tín hiệu.
- Không có cơ chế kích thước vị trí và dừng lỗ, rủi ro mất mát.
Hướng dẫn tối ưu hóa
- Xem xét kết hợp với các chỉ số khác như KDJ và MACD để tạo thành các combos chiến lược, tăng cường sự ổn định.
- Thiết kế dừng lỗ tự động như dừng lại, biến động dừng lại để giới hạn mỗi lỗ thương mại.
- Sử dụng thuật toán học máy trên dữ liệu lịch sử để tự động điều chỉnh các thông số và cải thiện hiệu suất chiến lược.
Kết luận
Chiến lược này xác định xu hướng và mức mua quá mức / bán quá mức bằng cách sử dụng chỉ số xu hướng sóng, tạo thành một xu hướng hiệu quả sau chiến lược. So với các dao động ngắn hạn, xu hướng sóng tránh các tín hiệu sai và cung cấp sự ổn định tốt hơn. Với các phương pháp kiểm soát rủi ro thích hợp, nó có thể đạt được lợi nhuận ổn định.
/*backtest
start: 2023-11-20 00:00:00
end: 2023-11-27 00:00:00
period: 1m
basePeriod: 1m
exchanges: [{"eid":"Futures_Binance","currency":"BTC_USDT"}]
*/


//@author SoftKill21
//@version=4

strategy(title="WaveTrend strat", shorttitle="WaveTrend strategy")
n1 = input(10, "Channel Length")
n2 = input(21, "Average Length")
Overbought = input(70, "Over Bought")
Oversold = input(-30, "Over Sold ")

// BACKTESTING RANGE

// From Date Inputs
fromDay = input(defval = 1, title = "From Day", minval = 1, maxval = 31)
fromMonth = input(defval = 1, title = "From Month", minval = 1, maxval = 12)
fromYear = input(defval = 2001, title = "From Year", minval = 1970)

// To Date Inputs
toDay = input(defval = 1, title = "To Day", minval = 1, maxval = 31)
toMonth = input(defval = 12, title = "To Month", minval = 1, maxval = 12)
toYear = input(defval = 2020, title = "To Year", minval = 1970)

// Calculate start/end date and time condition
DST = 1 //day light saving for usa
//--- Europe
London = iff(DST==0,"0000-0900","0100-1000")
//--- America
NewYork = iff(DST==0,"0400-1500","0500-1600")
//--- Pacific
Sydney = iff(DST==0,"1300-2200","1400-2300")
//--- Asia
Tokyo = iff(DST==0,"1500-2400","1600-0100")

//-- Time In Range
timeinrange(res, sess) => time(res, sess) != 0

london = timeinrange(timeframe.period, London)
newyork = timeinrange(timeframe.period, NewYork)

startDate = timestamp(fromYear, fromMonth, fromDay, 00, 00)
finishDate = timestamp(toYear, toMonth, toDay, 00, 00)
time_cond = true //and (london or newyork)

ap = hlc3
esa = ema(ap, n1)
d = ema(abs(ap - esa), n1)
ci = (ap - esa) / (0.015 * d)
tci = ema(ci, n2)

wt1 = tci
wt2 = sma(wt1,4)

plot(0, color=color.gray)
plot(Overbought, color=color.red)
plot(Oversold, color=color.green)

plot(wt1, color=color.green)
longButton = input(title="Long", type=input.bool, defval=true)
shortButton = input(title="Short", type=input.bool, defval=true)

if(longButton==true)
    strategy.entry("long",1,when=crossover(wt1,Oversold) and time_cond)
    strategy.close("long",when=crossunder(wt1, Overbought))

if(shortButton==true)
    strategy.entry("short",0,when=crossunder(wt1, Overbought) and time_cond)
    strategy.close("short",when=crossover(wt1,Oversold))

//strategy.close_all(when= not (london or newyork),comment="time")
if(dayofweek == dayofweek.friday)
    strategy.close_all(when= timeinrange(timeframe.period, "1300-1400"), comment="friday")
Thêm nữa
- Chiến lược dừng lỗ sau khi đặt vị trí nhập cảnh kép
- Chiến lược xu hướng chéo giữa RSI Moving Average
- Chiến lược hỗ trợ và kháng cự năng động dựa trên dữ liệu lịch sử
- Chiến lược theo dõi Bollinger của Noro
- Chiến lược mua bán ngược của EMA
- Harami Chiến lược giá đóng cửa
- Chiến lược giao dịch động lực dựa trên CMO và WMA
- Chiến lược giao dịch đa khung thời gian P-Signal
- Chiến lược chỉ số động lực hàng hóa
- Chiến lược đột phá Double Turtle
- Chiến lược hấp thụ vàng của Ichimoku Kumo Twist
- Ngăn chặn kéo dài với chiến lược lấy lợi nhuận một phần
- Kỹ thuật theo dõi xu hướng trung bình động của TSI và CCI Hull
- Chiến lược RSI kỹ thuật ngược
- Chiến lược định lượng CCI kép
- Chiến lược thoát qua đường EMA kép
- Chiến lược MACD đa khung thời gian
- Chiến lược siêu scalping dựa trên kênh RSI và ATR
- Chiến lược xu hướng Donchian
- Chiến lược chéo trung bình động đa SMA