Chiến lược nắm bắt đường trung bình động hàm mũ kép
Tổng quan
Chiến lược này sử dụng chỉ số đường trung bình hai chỉ số để xác định xu hướng thị trường, kết hợp với chỉ số Bollinger Bands để xác định hiện tượng mua quá mức, mua quá mức, bán quá mức, và rút ra lợi nhuận.
Nguyên tắc chiến lược
Chiến lược này sử dụng đường trung bình hai chỉ số để đánh giá xu hướng chung của thị trường, và Brin để đánh giá thời điểm tham gia cụ thể.
Các phương pháp hoạt động của đường trung bình kép là tính một đường trung bình ngắn hạn và một đường trung bình dài hạn, khi đường ngắn từ dưới lên phá vỡ đường dài trở thành tín hiệu đa; khi đường ngắn từ trên xuống phá vỡ đường dài, là tín hiệu nhìn lên.
Chỉ số Bollinger Bands đánh giá xem giá có đang quá mua hay quá bán không. Bollinger Bands là đường trung bình di chuyển của giá đóng cửa n ngày, và Bandwidth là chênh lệch tiêu chuẩn của n ngày trước đường trung bình di chuyển. Giá gần đường trên là quá mua và gần đường dưới là quá bán.
Quy tắc chính sách này là: Khi đường trung bình ngắn phá vỡ đường trung bình dài từ dưới lên và giá đóng cửa phá vỡ đường Bollinger Band lên đường, hãy làm nhiều; Khi đường trung bình ngắn đi xuống từ trên xuống đường trung bình dài và giá đóng cửa đi xuống đường Bollinger Band, hãy làm trống.
Điểm dừng lỗ sau khi thực hiện thêm là giá thấp nhất trong n ngày trước đó, điểm dừng lại là 1,6 lần giá mở vị trí; điểm dừng lỗ sau khi mở rộng là giá cao nhất trong n ngày trước đó, điểm dừng lại là 1,6 lần giá mở vị trí.
Ngoài ra, chiến lược này cũng xem xét các chỉ số EMA dư thừa để xác định xu hướng chung và tránh mở vị trí đối kháng.
Phân tích lợi thế
- Sử dụng đường trung bình hai chỉ số để đánh giá xu hướng tổng thể, Blink đánh giá điểm mua và bán cụ thể, và các chỉ số được kết hợp hợp lý;
- Thực hiện nhiều điểm dừng trước khi áp dụng giá thấp nhất n ngày và thực hiện giá cao nhất n ngày trước khi áp dụng dừng lỗ, có lợi cho việc giảm khả năng dừng lỗ bị đuổi theo;
- Điểm dừng là 1,6 lần giá mở, có lợi cho lợi nhuận;
- Xem xét các chỉ số EMA tổng thể, tránh đặt hàng ngược, giảm tổn thất hệ thống.
Phân tích rủi ro
- Các tham số BRI không được tối ưu hóa có thể dẫn đến tần suất giao dịch quá cao hoặc tín hiệu khan hiếm;
- Các điểm dừng lỗ quá nới lỏng có thể dẫn đến tổn thất lớn hơn;
- Nếu bạn có một điểm dừng quá thoải mái, bạn có thể sẽ bỏ lỡ một món ăn ngon hơn.
Để đối phó với các rủi ro trên, tối ưu hóa các tham số của Brin, thử nghiệm các mức độ dừng lỗ khác nhau và chọn tham số tối ưu.
Hướng tối ưu hóa
- Tối ưu hóa các tham số của vùng Brin để tìm ra các tham số kết hợp tốt nhất;
- Kiểm tra các tham số khác nhau về độ lỗ hổng để giảm khả năng bị truy lùng;
- Kiểm tra các tham số nhân số dừng khác nhau để đạt được lợi nhuận lớn hơn.
Tóm tắt
Chiến lược này sử dụng đường trung bình hai chỉ số để đánh giá xu hướng chung của thị trường, Brin để đánh giá thời gian mua bán cụ thể, hoạt động tốt trong dữ liệu đánh giá lại. Hiệu quả tốt hơn có thể đạt được thông qua tối ưu hóa tham số và sửa đổi quy tắc. Cơ chế dừng lỗ của nó cũng có thể được chuyển sang các chiến lược khác, có giá trị trích dẫn.
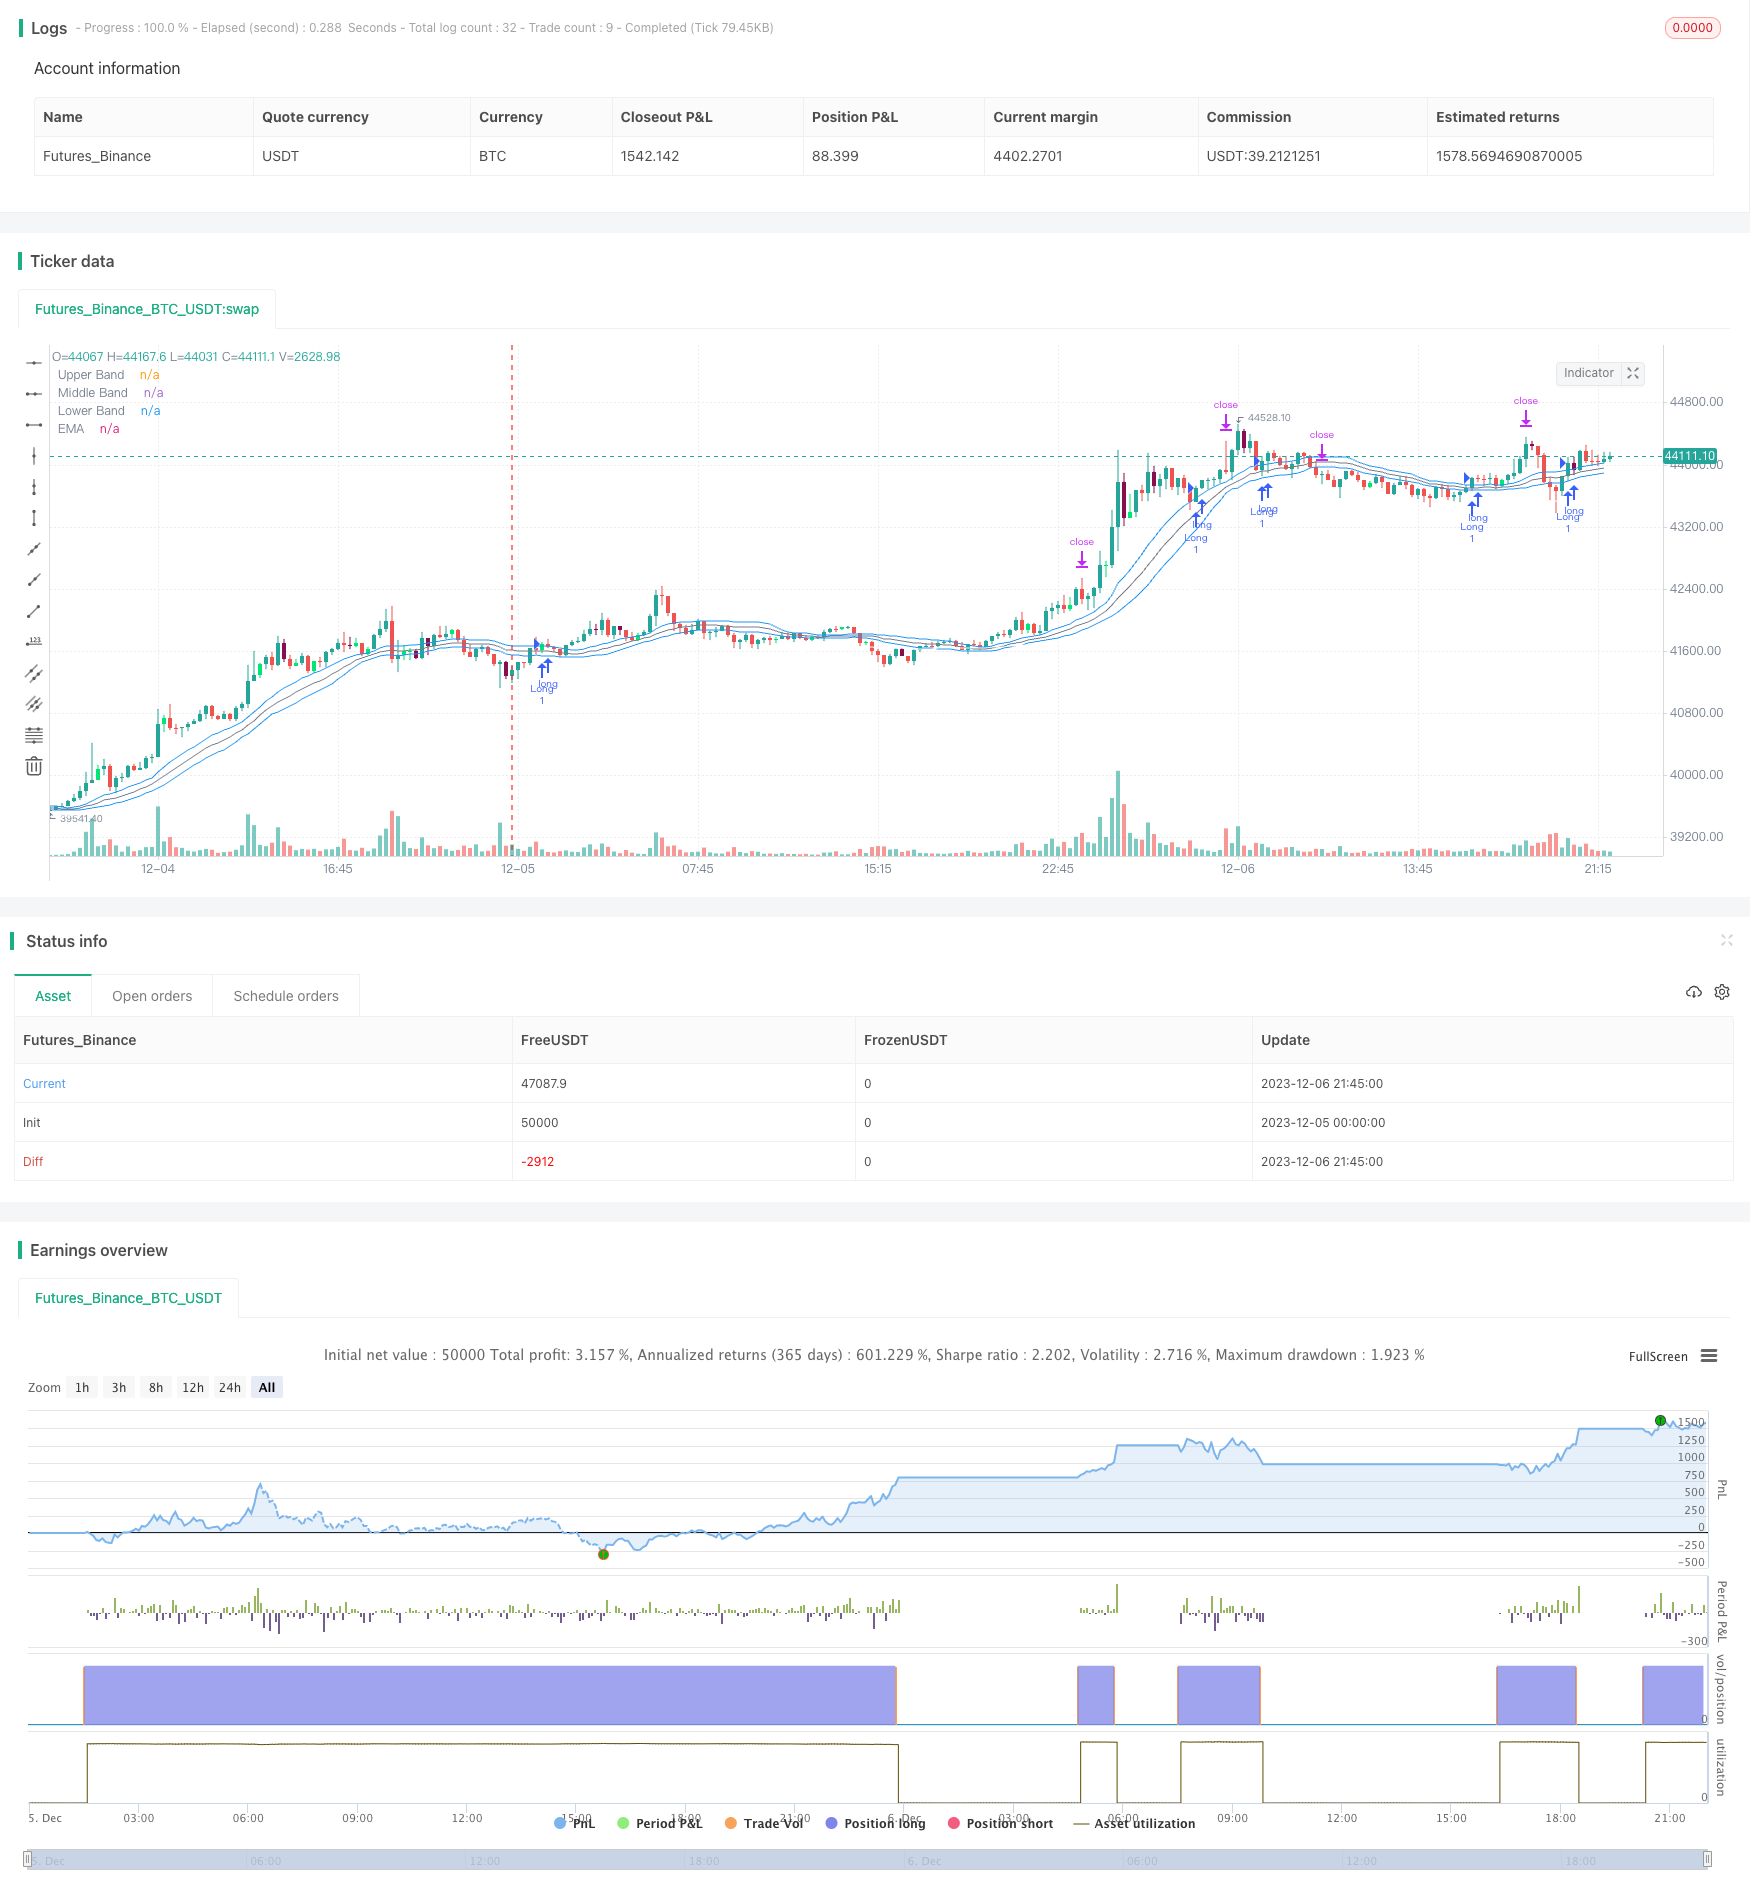
/*backtest
start: 2023-12-05 00:00:00
end: 2023-12-06 22:00:00
period: 15m
basePeriod: 5m
exchanges: [{"eid":"Futures_Binance","currency":"BTC_USDT"}]
*/

// This close code is subject to the terms of the Mozilla Public License 2.0 at https://mozilla.org/MPL/2.0/
// © AugustoErni

//@version=5
strategy('Bollinger Bands Modified (Stormer)', overlay=true)

bbL                   = input.int(20, title='BB Length/Comprimento da Banda de Bollinger', minval=1, step=1, tooltip='Calculate the length of bollinger bands./Calcula o comprimento das bandas de bollinger.')
mult                  = input.float(0.38, title='BB Standard Deviation/Desvio Padrão da Banda de Bollinger', minval=0.01, step=0.01, tooltip='Calculate the standard deviation of bollinger bands./Calcula o desvio padrão das bandas de bollinger.')
emaL                  = input.int(80, title='EMA Length/Comprimento da Média Móvel Exponencial', minval=1, step=1, tooltip='Calculate the length of EMA./Calcula o comprimento da EMA.')
highestHighL          = input.int(7, title='Highest High Length/Comprimento da Alta Maior', minval=1, step=1, tooltip='Fetches the highest high candle from length input. Use to set stop loss for short position./Obtém a vela de maior alta com base na medida fornecida. Usa para definir o stop loss para uma posição curta.')
lowestLowL            = input.int(7, title='Lowest Low Length/Comprimento da Baixa Menor', minval=1, step=1, tooltip='Fetches the lowest low candle from length input. Use to set stop loss for long position./Obter a vela de menor baixa com base na medida fornecida. Usa para definir o stop loss para uma posição longa.')
targetFactor          = input.float(1.6, title='Target Take Profit/Objetivo de Lucro Alvo', minval=0.1, step=0.1, tooltip='Calculate the take profit factor when entry position./Calcula o fator do alvo lucro ao entrar na posição.')
emaTrend              = input.bool(true, title='Check Trend EMA/Verificar Tendência da Média Móvel Exponencial', tooltip='Use EMA as trend verify for opening position./Usa a EMA como verificação de tendência para abrir posição.')
crossoverCheck        = input.bool(false, title='Add Another Crossover Check/Adicionar Mais uma Verificação de Cruzamento Superior', tooltip='This option is to add one more veryfication attempt to check if price is crossover upper bollinger band./Esta opção é para adicionar uma verificação adicional para avaliar se o preço cruza a banda superior da banda de bollinger.')
crossunderCheck       = input.bool(false, title='Add Another Crossunder Check/Adicionar Mais uma Verificação de Cruzamento Inferior', tooltip='This option is to add one more veryfication attempt to check if price is crossunder lower bollinger band./Esta opção é para adicionar uma verificação adicional para avaliar se o preço cruza a banda inferior da banda de bollinger.')
insideBarPatternCheck = input.bool(true, title='Show Inside Bar Pattern/Mostrar Padrão de Inside Bar', tooltip='This option is to show possible inside bar pattern./Esta opção é para mostrar um possível padrão de inside bar.')

[middle, upper, lower] = ta.bb(close, bbL, mult)
ema                    = ta.ema(close, emaL)
highestHigh            = ta.highest(high, highestHighL)
lowestLow              = ta.lowest(low, lowestLowL)
isCrossover            = ta.crossover(close, upper) ? 1 : 0
isCrossunder           = ta.crossunder(close, lower) ? 1 : 0

isPrevBarHighGreaterCurBarHigh = high[1] > high ? 1 : 0
isPrevBarLowLesserCurBarLow    = low[1] < low ? 1 : 0
isInsideBar                    = isPrevBarHighGreaterCurBarHigh and isPrevBarLowLesserCurBarLow ? 1 : 0

isBarLong  = ((close - open) > 0) ? 1 : 0
isBarShort = ((close - open) < 0) ? 1 : 0

isLongCross  = crossoverCheck ? ((isBarLong and not isBarShort) and (open < upper and close > upper)) ? 1 : 0 : isCrossover ? 1 : 0
isShortCross = crossunderCheck ? ((isBarShort and not isBarLong) and (close < lower and open > lower)) ? 1 : 0 : isCrossunder ? 1 : 0

isCandleAboveEma = close > ema ? 1 : 0
isCandleBelowEma = close < ema ? 1 : 0

isLongCondition  = emaTrend ? isLongCross and isCandleAboveEma ? 1 : 0 : isLongCross
isShortCondition = emaTrend ? isShortCross and isCandleBelowEma ? 1 : 0 : isShortCross

isPositionNone  = strategy.position_size == 0 ? 1 : 0
isPositionLong  = strategy.position_size > 0 ? 1 : 0
isPositionShort = strategy.position_size < 0 ? 1 : 0

var float enterLong     = 0.0
var float stopLossLong  = 0.0
var float targetLong    = 0.0
var float enterShort    = 0.0
var float stopLossShort = 0.0
var float targetShort   = 0.0
var bool isLongEntry    = false
var bool isShortEntry   = false

if (isPositionNone)
    isLongEntry   := false
    isShortEntry  := false
    enterLong     := 0.0
    stopLossLong  := 0.0
    targetLong    := 0.0
    enterShort    := 0.0
    stopLossShort := 0.0
    targetShort   := 0.0
if (isPositionShort or isPositionNone)
    isLongEntry  := false
    enterLong    := 0.0
    stopLossLong := 0.0
    targetLong   := 0.0
if (isPositionLong or isPositionNone)
    isShortEntry  := false
    enterShort    := 0.0
    stopLossShort := 0.0
    targetShort   := 0.0
if (isPositionLong and isLongEntry)
    isLongEntry   := true
    isShortEntry  := false
    enterShort    := 0.0
    stopLossShort := 0.0
    targetShort   := 0.0
if (isPositionShort and isShortEntry)
    isShortEntry := true
    isLongEntry  := false
    enterLong    := 0.0
    stopLossLong := 0.0
    targetLong   := 0.0

if (isLongCondition and not isLongEntry)
    isLongEntry  := true
    enterLong    := close
    stopLossLong := lowestLow
    targetLong   := (enterLong + (math.abs(enterLong - stopLossLong) * targetFactor))
    alertMessage = '{ "side/lado": "buy", "entry/entrada": ' + str.tostring(enterLong) + ', "stop": ' + str.tostring(stopLossLong) + ', "target/alvo": ' + str.tostring(targetLong) + ' }'
    alert(alertMessage)
    strategy.entry('Long', strategy.long)
    strategy.exit('Exit Long', 'Long', stop=stopLossLong, limit=targetLong)

if (isShortCondition and not isShortEntry)
    isShortEntry  := true
    enterShort    := close
    stopLossShort := highestHigh
    targetShort   := (enterShort - (math.abs(enterShort - stopLossShort) * targetFactor))
    alertMessage = '{ "side/lado": "sell", "entry/entrada": ' + str.tostring(enterShort) + ', "stop": ' + str.tostring(stopLossShort) + ', "target/alvo": ' + str.tostring(targetShort) + ' }'
    alert(alertMessage)
    strategy.entry('Short', strategy.short)
    strategy.exit('Exit Short', 'Short', stop=stopLossShort, limit=targetShort)

plot(upper, title='Upper Band', color=color.blue)
plot(middle, title='Middle Band', color=color.gray)
plot(lower, title='Lower Band', color=color.blue)
plot(ema, title='EMA', color=color.white)

barcolor(insideBarPatternCheck and isInsideBar and isBarLong ? color.lime : insideBarPatternCheck and isInsideBar and isBarShort ? color.maroon : na, title='Inside Bar Color in Long Bar Long and in Short Bar Short/Cor do Inside Bar em Barra Longa Longa e em Barra Curta Curta')

tablePosition    = position.bottom_right
tableColumns     = 2
tableRows        = 5
tableFrameWidth  = 1
tableBorderColor = color.gray
tableBorderWidth = 1

tableInfoTrade = table.new(position=tablePosition, columns=tableColumns, rows=tableRows, frame_width=tableFrameWidth, border_color=tableBorderColor, border_width=tableBorderWidth)

table.cell(table_id=tableInfoTrade, column=0, row=0)
table.cell(table_id=tableInfoTrade, column=1, row=0)

table.cell(table_id=tableInfoTrade, column=0, row=1, text='Entry Side/Lado da Entrada', text_color=color.white)
table.cell(table_id=tableInfoTrade, column=0, row=2, text=isLongEntry ? 'LONG' : isShortEntry ? 'SHORT' : 'NONE/NENHUM', text_color=color.yellow)

table.cell(table_id=tableInfoTrade, column=1, row=1, text='Entry Price/Preço da Entrada', text_color=color.white)
table.cell(table_id=tableInfoTrade, column=1, row=2, text=isLongEntry ? str.tostring(enterLong) : isShortEntry ? str.tostring(enterShort) : 'NONE/NENHUM', text_color=color.blue)

table.cell(table_id=tableInfoTrade, column=0, row=3, text='Take Profit Price/Preço Alvo Lucro', text_color=color.white)
table.cell(table_id=tableInfoTrade, column=0, row=4, text=isLongEntry ? str.tostring(targetLong) : isShortEntry ? str.tostring(targetShort) : 'NONE/NENHUM', text_color=color.green)

table.cell(table_id=tableInfoTrade, column=1, row=3, text='Stop Loss Price/Preço Stop Loss', text_color=color.white)
table.cell(table_id=tableInfoTrade, column=1, row=4, text=isLongEntry ? str.tostring(stopLossLong) : isShortEntry ? str.tostring(stopLossShort) : 'NONE/NENHUM', text_color=color.red)