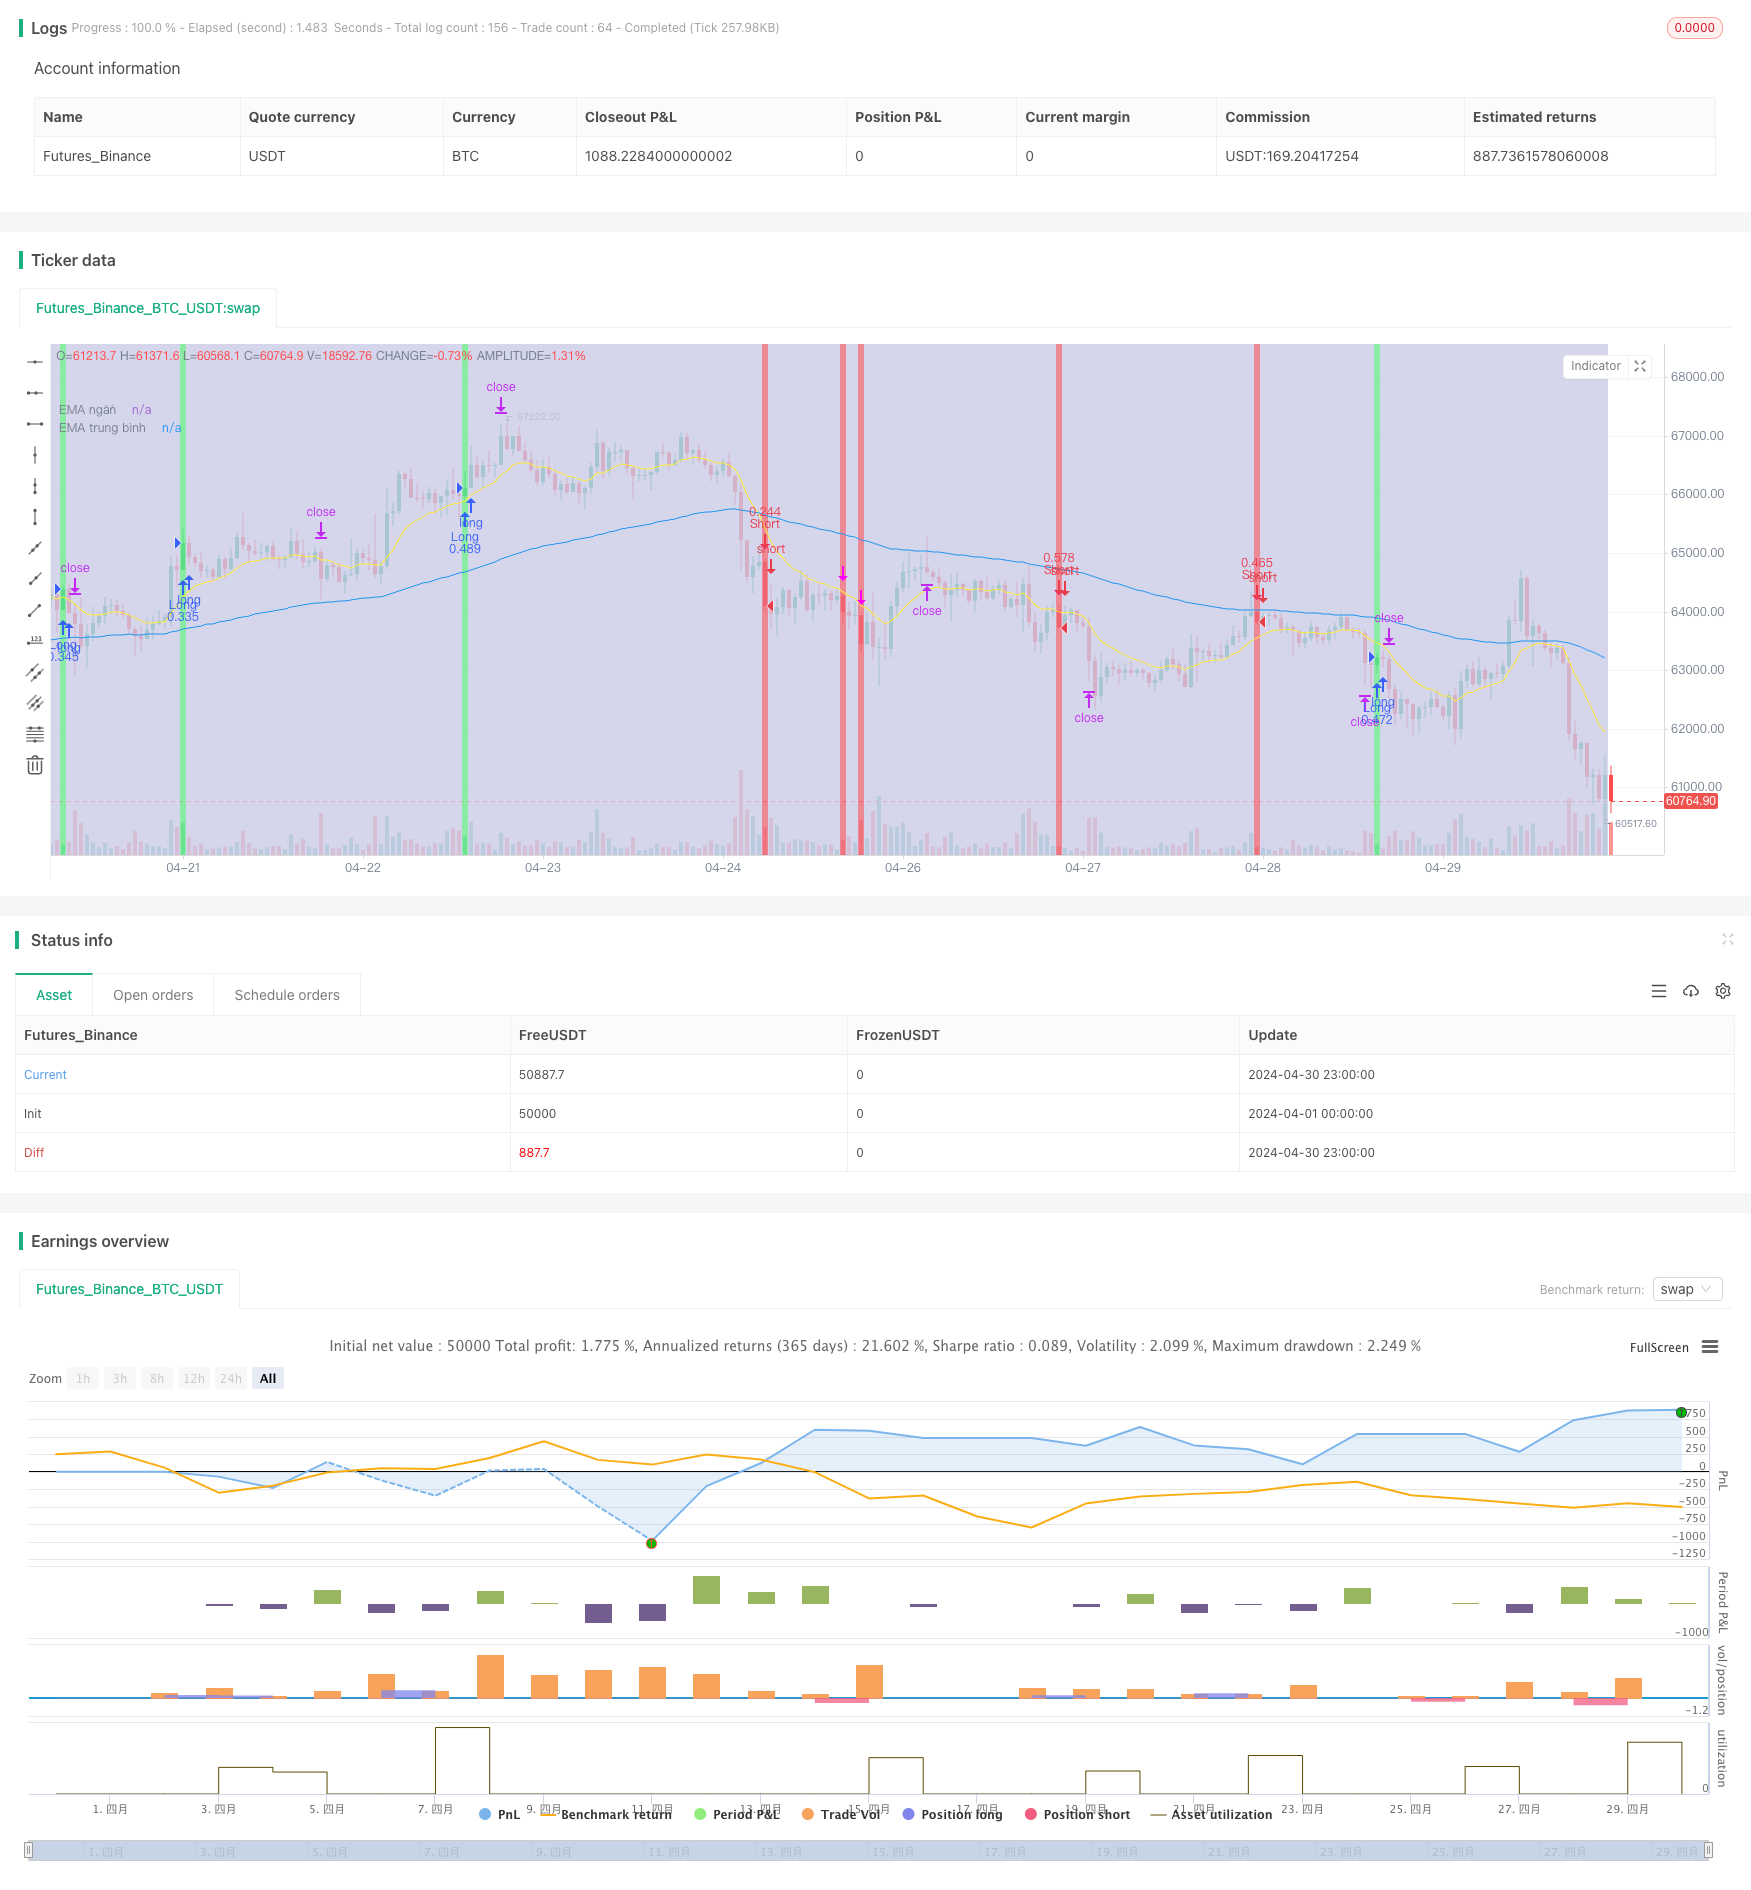
Tổng quan
Chiến lược này sử dụng chỉ số trung bình di chuyển ((EMA) trong ba chu kỳ khác nhau để đánh giá xu hướng thị trường và kết hợp chỉ số tương đối mạnh ((RSI) và sóng thực trung bình ((ATR) để xác định điểm vào và điểm dừng. Chiến lược sẽ kích hoạt tín hiệu mở kho khi giá vượt qua kênh hình thành ba EMA và RSI cũng vượt qua đường trung bình di chuyển của nó. Đồng thời, ATR được sử dụng để kiểm soát quy mô vị trí và thiết lập điểm dừng, trong khi tỷ lệ rủi ro lợi nhuận ((RR) được sử dụng để xác định điểm dừng.
Nguyên tắc chiến lược
- Tính toán EMA cho ba chu kỳ khác nhau: ngắn hạn, trung hạn và dài hạn để đánh giá xu hướng chung của thị trường.
- Sử dụng chỉ số RSI để xác định cường độ và tính bền vững của xu hướng, khi RSI phá vỡ đường trung bình di chuyển của nó, nó cho thấy xu hướng đã thay đổi.
- Kết hợp mối quan hệ của giá với kênh EMA và tín hiệu RSI để tạo ra tín hiệu mở kho: Khi giá phá vỡ kênh EMA và RSI cũng phá vỡ đường trung bình di chuyển của nó, mở kho theo hướng xu hướng.
- ATR được sử dụng để xác định quy mô vị trí và mức dừng lỗ, kiểm soát các lỗ hổng rủi ro cho mỗi giao dịch.
- Dựa trên rủi ro lợi nhuận mặc định (ví dụ: 1,5:1) để thiết lập điểm dừng để đảm bảo khả năng sinh lợi của chiến lược.
Phân tích ưu thế
- Đơn giản và hiệu quả: Chiến lược chỉ sử dụng một vài chỉ số kỹ thuật phổ biến, logic rõ ràng, dễ hiểu và thực hiện.
- Theo xu hướng: Bằng cách kết hợp các kênh EMA và RSI, chiến lược có thể giao dịch theo xu hướng thị trường và nắm bắt sự biến động giá lớn hơn.
- Kiểm soát rủi ro: Sử dụng ATR để thiết lập mức dừng lỗ và kiểm soát quy mô vị trí, hạn chế hiệu quả lỗ hổng rủi ro cho mỗi giao dịch.
- Tính linh hoạt: Các tham số chiến lược (như chu kỳ EMA, chu kỳ RSI, ATR, v.v.) có thể được điều chỉnh theo các thị trường và phong cách giao dịch khác nhau để tối ưu hóa hiệu suất.
Phân tích rủi ro
- Tối ưu hóa tham số: Hiệu suất của chiến lược phụ thuộc rất nhiều vào sự lựa chọn tham số, cài đặt tham số không đúng cách có thể dẫn đến thất bại của chiến lược hoặc hoạt động kém.
- Rủi ro thị trường: Chiến lược có thể chịu tổn thất lớn hơn trong các sự kiện bất ngờ hoặc tình huống cực đoan, đặc biệt là trong thị trường có xu hướng đảo ngược hoặc rung động.
- Quá so sánh: Nếu quá so sánh dữ liệu lịch sử trong quá trình tối ưu hóa tham số, có thể dẫn đến chiến lược không hoạt động tốt trong giao dịch thực tế.
Tiến hành
- Tham số động lực: Tham số chiến lược điều chỉnh động lực theo tình hình thị trường thay đổi, chẳng hạn như sử dụng chu kỳ EMA dài hơn khi xu hướng rõ ràng và sử dụng chu kỳ ngắn hơn trong thị trường rung.
- Kết hợp các chỉ số khác: giới thiệu các chỉ số kỹ thuật khác (như băng Brin, MACD, v.v.) để tăng độ tin cậy và độ chính xác của tín hiệu khai khoang.
- Tham gia cảm xúc thị trường: kết hợp các chỉ số cảm xúc thị trường (như chỉ số sợ hãi và tham lam) để điều chỉnh chiến lược quản lý lỗ hổng rủi ro và kho.
- Phân tích nhiều khung thời gian: Phân tích xu hướng và tín hiệu thị trường trên các khung thời gian khác nhau để có được cái nhìn toàn diện hơn về thị trường và quyết định giao dịch ổn định hơn.
Kết luận
Chiến lược này xây dựng một hệ thống giao dịch theo xu hướng đơn giản và hiệu quả bằng cách kết hợp nhiều chỉ số kỹ thuật phổ biến như EMA, RSI và ATR. Nó sử dụng kênh EMA để đánh giá xu hướng thị trường, RSI để xác nhận sức mạnh của xu hướng và sử dụng ATR để kiểm soát rủi ro.
/*backtest
start: 2024-04-01 00:00:00
end: 2024-04-30 23:59:59
period: 1h
basePeriod: 15m
exchanges: [{"eid":"Futures_Binance","currency":"BTC_USDT"}]
*/

// This source code is subject to the terms of the Mozilla Public License 2.0 at https://mozilla.org/MPL/2.0/
// © hatnxkld

//@version=4
strategy("Win ha", overlay=true)

ss2 = input("0300-1700", title = "Khung thời gian")

t2 = time(timeframe.period,ss2)
c2 = #cacae6

bgcolor(t2 ? c2 : na, transp = 70)


//3ema
emangan=input(title="Ema ngắn", defval = 12)
ngan=ema(close, emangan)
a= plot(ngan, title="EMA ngắn", color=color.yellow)
ematb=input(title="Ema trung bình", defval = 100)
tb=ema(close, ematb)
b= plot(tb, title="EMA trung bình", color=color.blue)
//emadai=input(title="Ema dai", defval = 288)
//dai=ema(close,emadai)
//c= plot(dai, title="EMA dai", color=color.red)


// nhập hệ số nhân ATR
i=input(title="Hệ số nhân với ATR", defval=1.25)

// RSI
rsi=rsi(close, emangan)
marsi=sma(rsi, emangan)

// Kênh keltler
//heso=input(defval=1, title="Hệ số Kênh Keltler")
//atr=atr(emangan)
//tren=ngan+atr*heso
//d=plot(tren, title="Kênh trên", color=color.white)
//duoi=ngan-atr*heso
//e=plot(duoi, title="Kênh dưới", color=color.white)
//fill(d,e, color=color.rgb(48, 58, 53))

ban = ( close[1]>open[1] and (high[1]-close[1])>(close[1]-low[1]) and open>close and close<low[1]   )


//or (    open[1] > close[1] and (high[1]-open[1])>(open[1]-low[1]) and (open[1]-close[1])>(close[1]-low[1]) and open>close and close <low[1]     )   )  //and time(timeframe.period,"2200-1300")
//and (close[1]-open[1])>(open[1]-low[1])
//high > ngan and close < ngan and ngan<tb and
// and time(timeframe.period,"1000-2300")
bgcolor(color = ban ? color.rgb(235, 106, 123) : na)
//bgcolor(color.rgb(82, 255, 154),transp = 100, offset = 1, show_last = 2)
//and time(timeframe.period,"2300-1500") and ((open>ngan and close<ngan) or (open>tren and close<tren))
plotshape(ban , style=shape.arrowdown, location=location.abovebar, color=#ff00ff, size=size.tiny, textcolor=color.rgb(255, 59, 213))
alertcondition(ban, "Ban", "Ban")

mua=  (  open[1]>close[1] and (close[1]-low[1])>(high[1]-close[1]) and close > open and close > high[1]  )  //and time(timeframe.period,"2200-1300")


//or  (  close[1]>open[1] and (open[1]-low[1]) > (high[1]-open[1]) and (close[1]-open[1])>(high[1]-close[1]) and close>open and close>high[1]      ) )
//and (open[1]-close[1])>(high[1]-open[1])
//low < ngan and close > ngan and ngan>tb and
//or  (  close[1]>open[1] and (open[1]-low[1]) > (high[1]-open[1]) and (close[1]-open[1])>(high[1]-close[1]) and close>open and close>high[1]      )

// and time(timeframe.period,"1000-2300")
bgcolor(color= mua? color.rgb(108, 231, 139):na)
//and time(timeframe.period,"2300-1500") and ((open<ngan and close>ngan)or (open<duoi and close>duoi) )
plotshape(mua , style=shape.arrowup, location=location.belowbar, color=#00ff6a, size=size.tiny, textcolor=color.rgb(83, 253, 60))
alertcondition(mua , "Mua", "Mua")


//len1 = ban==true and (high-low)>2*atr
//plotshape(len1 , style=shape.flag, location=location.abovebar, color=#ff00ff, size=size.tiny, title="Sell Signal", text="Xuong 1", textcolor=color.rgb(255, 59, 213))

//bann= ban==true and rsi < marsi and marsi[2]>marsi[1]
//plotshape(bann , style=shape.labeldown, location=location.abovebar, color=#ff00ff, size=size.tiny, title="Sell Signal", text="BAN 2", textcolor=color.rgb(240, 234, 239))

//bannn = mua==true and rsi>marsi and marsi[2]<marsi[1]
//plotshape(bannn , style=shape.labelup, location=location.belowbar, color=#00ff6a, size=size.tiny, title="Buy Signal", text="Mua 2", textcolor=color.rgb(237, 241, 236))

//a1= ban==true and (high - low)<atr
//plotshape(a1 , style=shape.xcross, location=location.bottom, color=#00ff6a, size=size.tiny, title="Sell", text="<atr", textcolor=color.rgb(240, 95, 76))

//a2 = ban ==true and (high - low)>atr and (high - low)<(2*atr)
//plotshape(a2 , style=shape.xcross, location=location.bottom, color=#00ff6a, size=size.tiny, title="Sell", text="<2atr", textcolor=color.rgb(237, 241, 236))

//a3= ban==true and (high - low)>(2*atr)
//plotshape(a3 , style=shape.xcross, location=location.bottom, color=#00ff6a, size=size.tiny, title="Sell", text=">2atr", textcolor=color.rgb(234, 252, 74))


//b1= mua==true and (high - low)<atr
//plotshape(b1 , style=shape.xcross, location=location.bottom, color=#00ff6a, size=size.tiny, title="Buy", text="<atr", textcolor=color.rgb(237, 241, 236))

//b2 = mua ==true and (high - low)>atr and (high - low)<(2*atr)
//plotshape(b2 , style=shape.xcross, location=location.bottom, color=#00ff6a, size=size.tiny, title="Buy", text="<2atr", textcolor=color.rgb(237, 241, 236))

//b3= mua==true and (high - low)>(2*atr)
//plotshape(b3 , style=shape.xcross, location=location.bottom, color=#00ff6a, size=size.tiny, title="Buy", text=">2atr", textcolor=color.rgb(237, 241, 236))

// Đặt SL TP ENTRY
risk= input(title="Rủi ro % per Trade", defval=0.5)
rr= input(title="RR", defval=1.5)
onlylong= input(defval=false)
onlyshort=input(defval=false)

stlong = mua and strategy.position_size<=0 ? low[1]:na
stoplong= fixnan(stlong)

stshort = ban and strategy.position_size>=0 ? high[1]:na
stopshort= fixnan(stshort)

enlong = mua and strategy.position_size<=0 ? close:na
entrylong =fixnan(enlong)

enshort = ban and strategy.position_size>=0 ? close:na
entryshort = fixnan(enshort)

amountL = risk/100* strategy.initial_capital / (entrylong - stoplong)
amountS = risk/100* strategy.initial_capital / (stopshort - entryshort)

TPlong= mua and strategy.position_size<=0? entrylong + (entrylong -stoplong)*rr:na
takeprofitlong =fixnan(TPlong)
TPshort = ban and strategy.position_size>=0? entryshort - (stopshort - entryshort)*rr:na
takeprofitshort = fixnan(TPshort)

strategy.entry("Long", strategy.long , when = enlong and not onlyshort, qty= amountL )
strategy.exit("exitL", "Long", stop = stoplong, limit= takeprofitlong)

strategy.entry("Short", strategy.short , when = enshort and not onlylong, qty= amountS )
strategy.exit("exitS", "Short", stop = stopshort, limit= takeprofitshort)