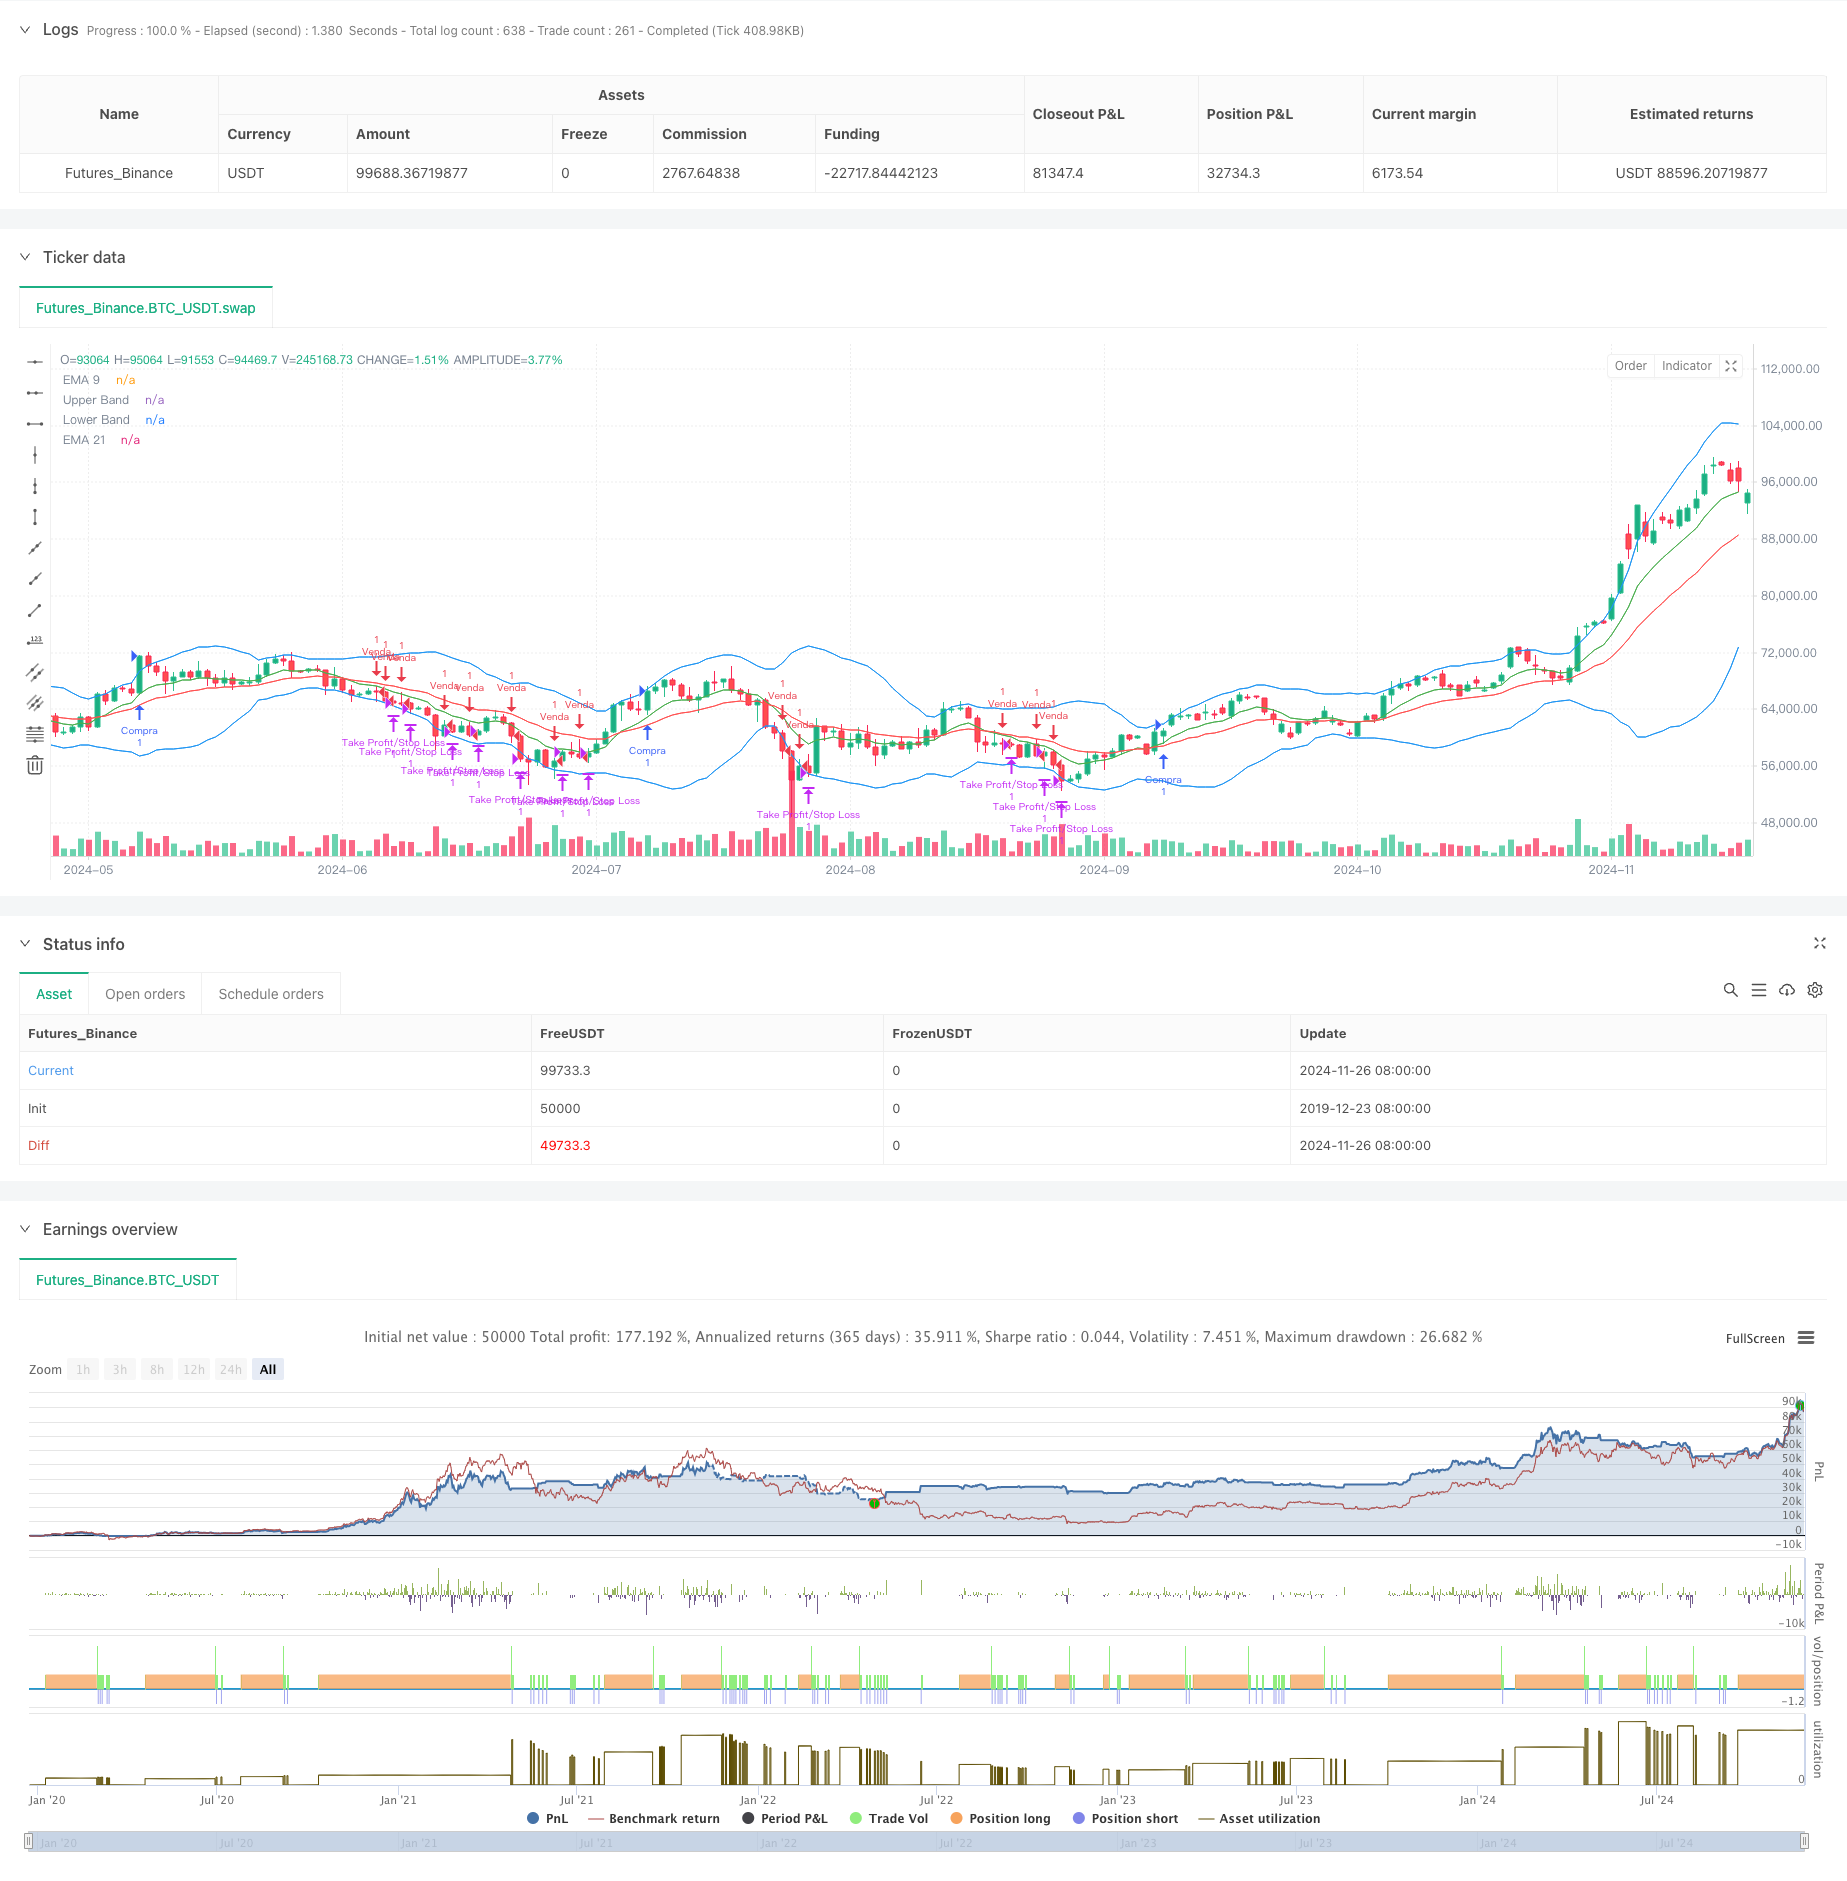
Tổng quan
Chiến lược này là một hệ thống theo dõi xu hướng toàn diện, kết hợp nhiều chỉ số kỹ thuật và phương pháp phân tích động lực. Cốt lõi của chiến lược là sử dụng phương pháp kết hợp chéo ngang, xác nhận xu hướng và chỉ số động lực, kiểm soát rủi ro thông qua tỷ lệ dao động, để nắm bắt xu hướng thị trường và quản lý rủi ro hiệu quả. Chiến lược này thích ứng tốt trong môi trường thị trường có xu hướng rõ ràng trong trung và dài hạn.
Nguyên tắc chiến lược
Chiến lược sử dụng cơ chế xác nhận tín hiệu nhiều cấp, bao gồm các yếu tố chính sau:
- Sử dụng đường trung bình di chuyển chỉ số 9 và 21 ngày (EMA) làm chỉ số đánh giá xu hướng chính
- Xác nhận động lực xu hướng thông qua chỉ số MACD, yêu cầu đường MACD đồng hướng với đường tín hiệu
- Kết hợp với chỉ số RSI để đánh giá quá mua và quá bán, thiết lập phạm vi hợp lý
- Sử dụng Brinband để giám sát phạm vi biến động giá
- Đặt mục tiêu dừng lỗ và lợi nhuận động thông qua chỉ số ATR
- Sử dụng xác nhận khối lượng giao dịch, yêu cầu khối lượng giao dịch lớn hơn trung bình 14 ngày
Các điều kiện giao dịch cho phán quyết tổng hợp đa tín hiệu như sau: Làm nhiều điều kiện: vượt qua EMA21 trên EMA9, đường MACD lớn hơn đường tín hiệu và là giá trị dương, RSI trong khoảng 40-70, giá trên EMA9 Điều kiện làm trống: EMA9 dưới EMA21, đường MACD nhỏ hơn đường tín hiệu và là giá trị âm, RSI trong khoảng 30-60, giá dưới EMA9
Lợi thế chiến lược
- Việc sử dụng kết hợp nhiều chỉ số kỹ thuật giúp tăng độ tin cậy tín hiệu
- Điều chỉnh động vị trí dừng để thích ứng với biến động của thị trường thông qua ATR
- Kết hợp xác nhận khối lượng giao dịch để tăng hiệu quả giao dịch
- Cài đặt RSI hợp lý để tránh đợt tăng và giảm
- Sử dụng Blink để đánh giá thị trường biến động
- Stop Loss Ratio là 2: 1, có tỷ lệ lợi nhuận rủi ro tốt
Rủi ro chiến lược
- Nhiều chỉ số có thể gây ra sự chậm trễ trong tín hiệu và mất cơ hội trong quá trình nhanh chóng
- Tín hiệu sai thường xuyên có thể xảy ra trong thị trường biến động
- Phạm vi RSI cố định có thể hạn chế cơ hội giao dịch trong môi trường thị trường đặc biệt
- Sự phụ thuộc vào khối lượng giao dịch có thể ảnh hưởng đến hiệu suất chiến lược trong môi trường thiếu thanh khoản
- Cài đặt vị trí dừng lỗ có thể được kích hoạt dễ dàng trong điều kiện biến động cao
Hướng tối ưu hóa chiến lược
- Xem xét việc giới thiệu cơ chế điều chỉnh tham số thích ứng, điều chỉnh tham số chỉ số theo tình trạng thị trường động
- Tăng phân loại môi trường thị trường, sử dụng các tổ hợp tham số khác nhau trong các trạng thái thị trường khác nhau
- Có thể xem xét thêm các chỉ số cường độ xu hướng để tăng độ chính xác của phán đoán xu hướng
- Tối ưu hóa cơ chế dừng lỗ, xem xét sử dụng theo dõi dừng lỗ hoặc chiến lược dừng lỗ tổng hợp
- Tăng bộ lọc khối lượng giao dịch để tránh giao dịch trong môi trường thiếu thanh khoản
- Xem xét thêm bộ lọc thời gian để tránh giao dịch trong thời gian bất lợi
Tóm tắt
Chiến lược này xây dựng một hệ thống giao dịch theo dõi xu hướng tương đối hoàn chỉnh thông qua việc sử dụng kết hợp nhiều chỉ số kỹ thuật. Điểm mạnh cốt lõi của chiến lược là độ tin cậy của tín hiệu và tính hợp lý của kiểm soát rủi ro, nhưng đồng thời cũng có một số vấn đề về sự chậm trễ và tối ưu hóa tham số.
/*backtest
start: 2019-12-23 08:00:00
end: 2024-11-27 08:00:00
period: 1d
basePeriod: 1d
exchanges: [{"eid":"Futures_Binance","currency":"BTC_USDT"}]
*/

//@version=5
strategy("Estratégia Cripto - 1D", shorttitle="Estratégia Cripto", overlay=true)

// Definição das Médias Móveis Exponenciais (EMA)
ema9 = ta.ema(close, 9)
ema21 = ta.ema(close, 21)

// Definição do MACD
[macdLine, signalLine, _] = ta.macd(close, 12, 26, 9)

// Definição do RSI
rsi = ta.rsi(close, 14)

// Volume médio
volMedio = ta.sma(volume, 14)

// Definição das Bollinger Bands
basis = ta.sma(close, 20)
dev = ta.stdev(close, 20)
upperBand = basis + 2 * dev
lowerBand = basis - 2 * dev

// Condições de Compra (Long)
longCondition = (ema9 > ema21) and (macdLine > signalLine) and (macdLine > 0) and (volume > volMedio) and (rsi > 40 and rsi < 70) and (close > ema9)
if (longCondition)
    strategy.entry("Compra", strategy.long)

// Condições de Venda (Short)
shortCondition = (ema9 < ema21) and (macdLine < signalLine) and (macdLine < 0) and (volume > volMedio) and (rsi < 60 and rsi > 30) and (close < ema9)
if (shortCondition)
    strategy.entry("Venda", strategy.short)

// Stop Loss e Take Profit
strategy.exit("Take Profit/Stop Loss", from_entry="Compra", loss=200, profit=400)
strategy.exit("Take Profit/Stop Loss", from_entry="Venda", loss=200, profit=400)

// Plotagem das Médias Móveis e Bollinger Bands
plot(ema9, color=color.green, title="EMA 9")
plot(ema21, color=color.red, title="EMA 21")
plot(upperBand, color=color.blue, title="Upper Band")
plot(lowerBand, color=color.blue, title="Lower Band")