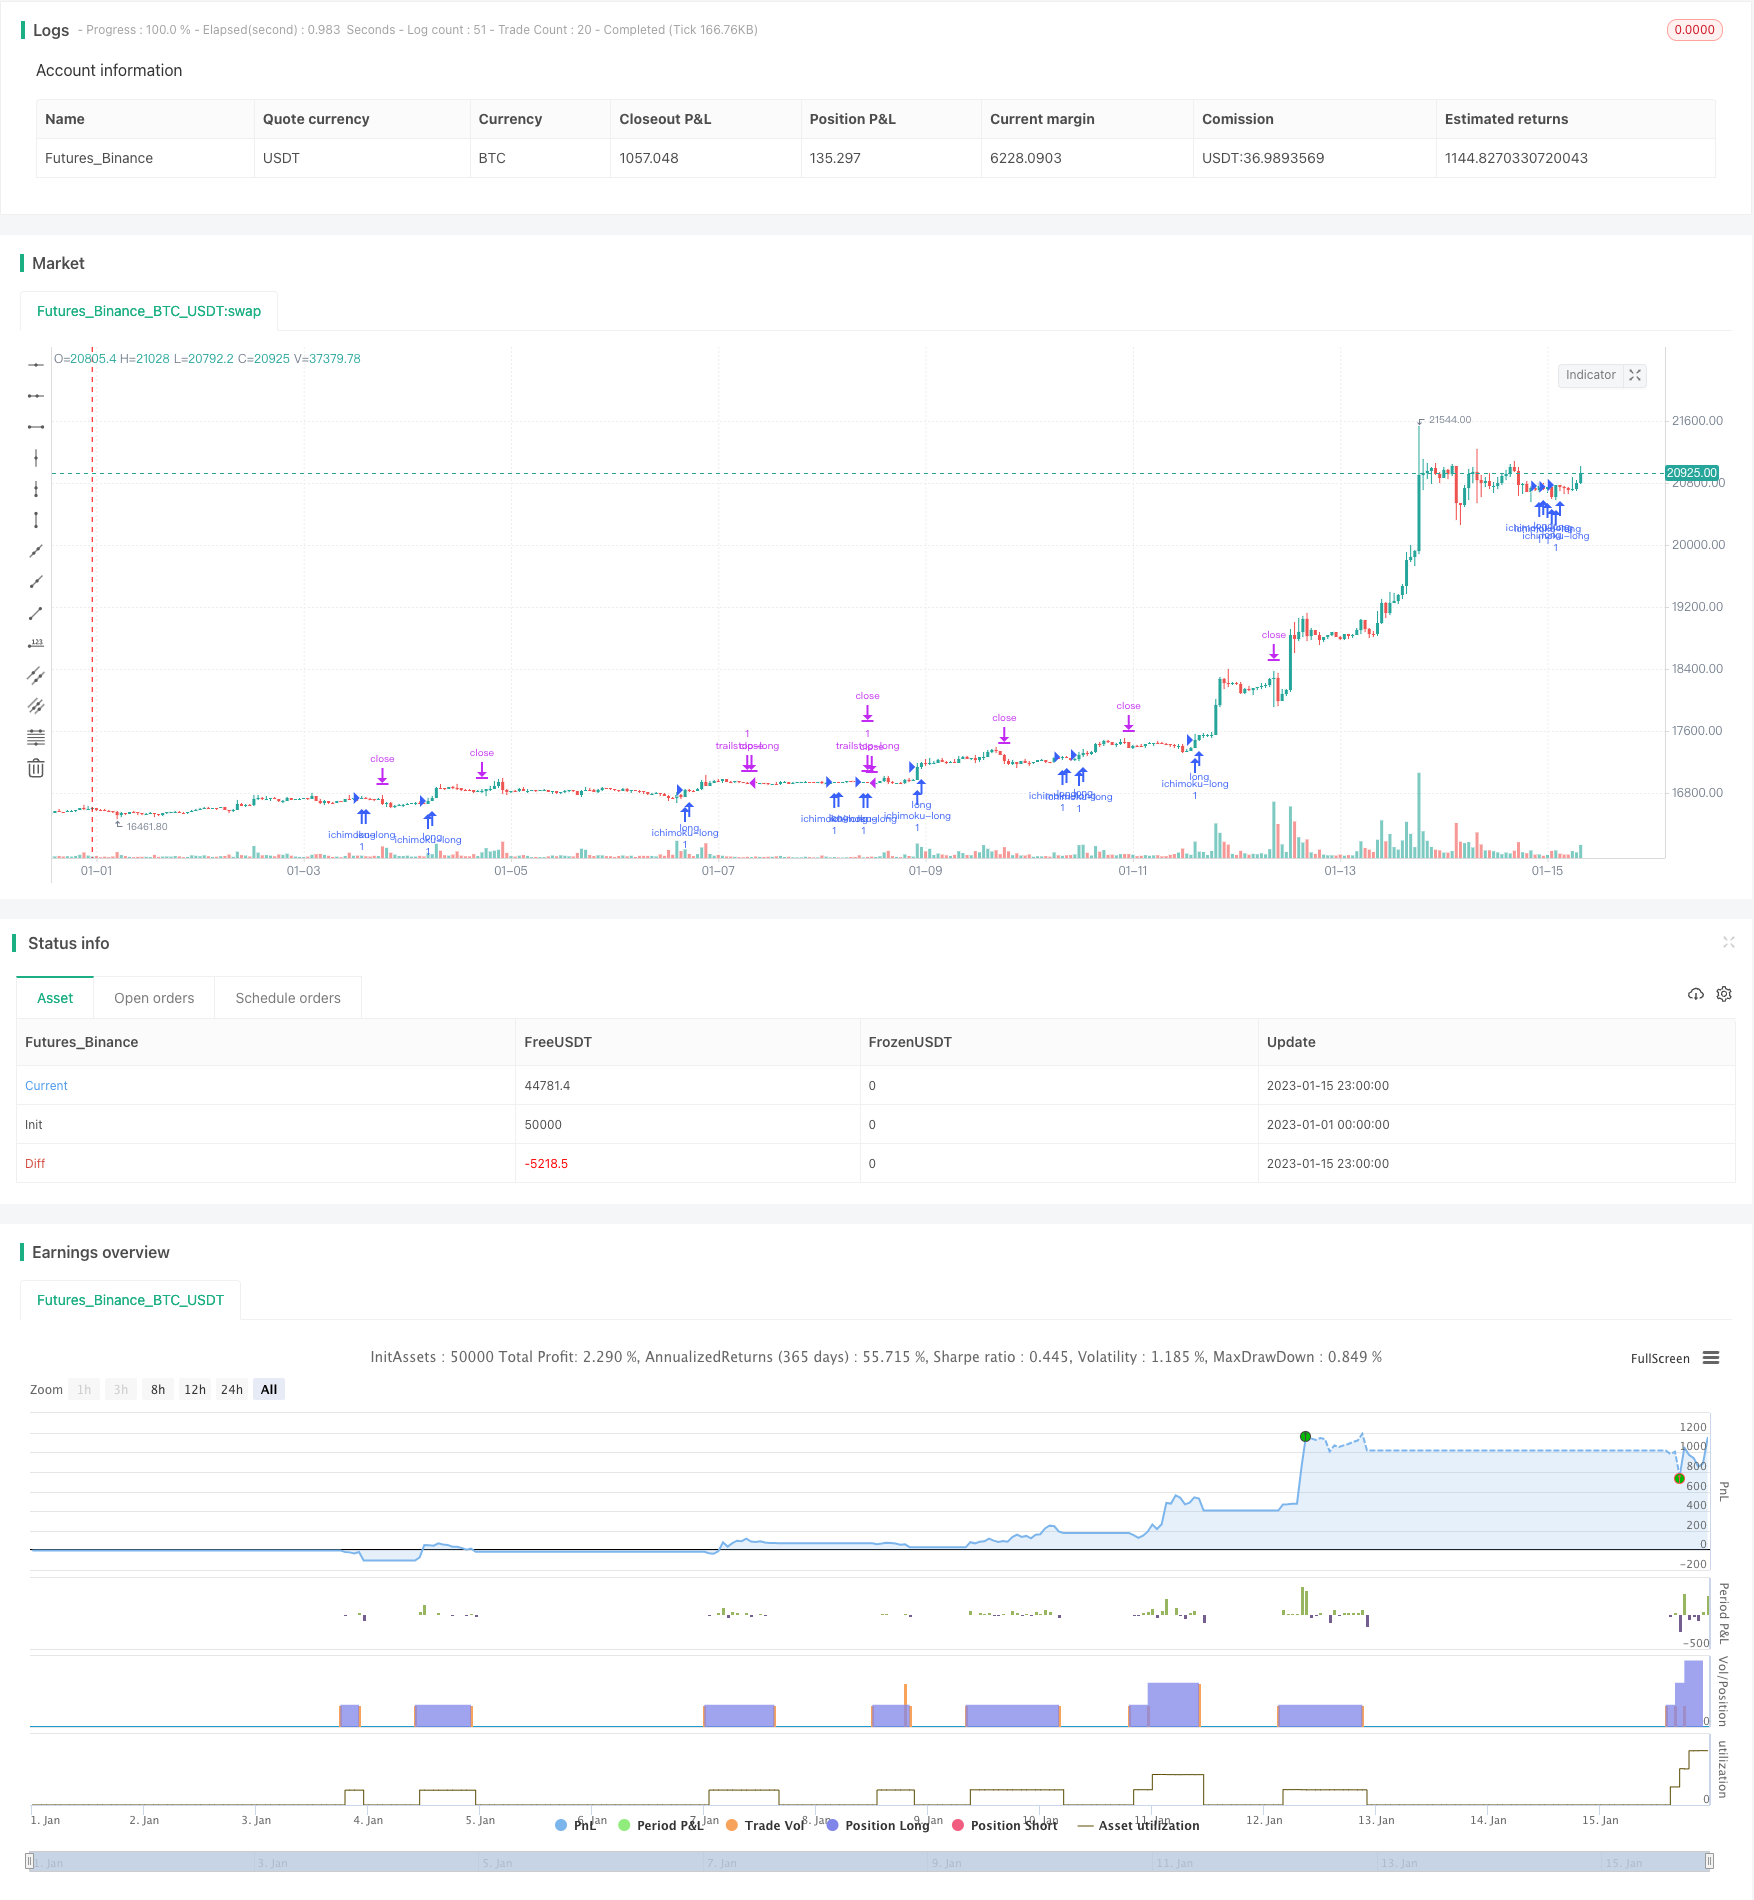
概述
该策略运用一目均衡线实现日内股票交易,属于短线交易策略。它利用一目均衡线的转换线、基准线以及先行线组合进行买卖信号判断,并辅以抛物线SAR进行止损追踪,实现双重保护。
原理
一目均衡线由转换线、基准线、先行1线和先行2线组成。转换线为当日收盘价和过去9日的最高价最低价均价的平均值,反映最近一段时间内的股价均衡态势。基准线为过去26日的最高价最低价均价,代表中长期的均衡态势。先行1线为基准线和转换线的均价,反映未来走势的态势。先行2线为过去52日的最高价最低价均价。这些均衡线组合起来,形成买卖讯号。
当收盘价从下方突破基准线且高于先行2线时,产生买进讯号。当收盘价从上方跌破基准线且低于先行1线时,产生卖出讯号。抛物线SAR用于追踪止损,当价格低于SAR时发出止损信号。
该策略利用均衡线的组合,判断股价的未来趋势和目前趋势的持续性,属于典型的趋势跟踪策略。当出现买进和卖出讯号时,及时追随趋势进行交易。同时,SAR止损让利机制可避免亏损扩大。
优势
- 利用均衡线判断未来趋势,提高判断准确性
均衡线包含不同周期价格信息,能提前反映趋势变化,利用组合判断增加准确性。相比单一指标,能更准确判断买卖点。
- SAR止损追踪,双重保护
SAR能灵活跟踪股票运行,进行止损。与均衡线组合,能在获利后及时止损,避免亏损扩大。
- 简单参数设定,容易实施
该策略只有少量参数,不依赖曲线拟合等复杂技术指标,简单实用,容易实施。参数默认值就可达到不错效果。
- 适用于日内短线交易
利用日内价格变化判断买卖点,属于短线交易策略。可充分利用股票日内波动获利。
风险
- 回撤风险
跟踪趋势买卖带来较高回撤。需要合理设置止损点,控制单次亏损。
- 震荡行情风险
震荡行情中,均衡线产生的讯号可能频繁,不利于获利。可适当调整参数,过滤掉一些讯号。
- 过优化风险
简单的参数容易过优化,实盘效果可能不理想。应进行稳健性测试,防止过拟合。
- 效果因标的不同有所区别
效果与选股标的有关,应选择趋势明显的股票进行交易,使策略发挥最大效果。
优化方向
- 结合其他指标过滤信号
可以结合移动平均线等其他指标,过滤掉一些不确定信号,避免虚拟交易。
- 动态调整止损点
可以根据市场波动程度,动态调整SAR的参数,使止损更灵活。
- 优化参数组合
可以通过更系统的优化和组合测试,寻找更佳的参数组合,提高策略效果。
- 根据市场环境调整持仓
可以根据大盘走势等市场环境,动态调整策略的仓位和头寸,控制风险。
总结
该策略利用均衡线的买卖信号,配合抛物线SAR实现止损追踪,是一种较为简单实用的短线交易策略。有效利用均衡线预测未来趋势的功能,对突破进行买卖操作。同时止损机制避免亏损加大。实施时需要注意回撤控制,选股以及参数优化等问题。如果解决了这些问题,它是一个易于实施且效果不俗的日内交易策略。
/*backtest
start: 2023-01-01 00:00:00
end: 2023-01-16 00:00:00
period: 1h
basePeriod: 15m
exchanges: [{"eid":"Futures_Binance","currency":"BTC_USDT"}]
*/

//@version=3
//
//  Based on the trading strategy described at
//    http://stockcharts.com/school/doku.php?id=chart_school:trading_strategies:ichimoku_cloud
//
//  See Also:
//    - Backtesting and forwardtesting (of TradingView Strategies) <https://www.tradingview.com/wiki/Strategies#Backtesting_and_forwardtesting>
//    - 9 Mistakes Quants Make that Cause Backtests to Lie <https://blog.quantopian.com/9-mistakes-quants-make-that-cause-backtests-to-lie-by-tucker-balch-ph-d/>
//    - When Backtests Meet Reality <http://financial-hacker.com/Backtest.pdf>
//    - Why MT4 backtesting does not work <http://www.stevehopwoodforex.com/phpBB3/viewtopic.php?f=28&t=4020>
//
//
// -----------------------------------------------------------------------------
// Copyright 2018 sherwind
//
// This program is free software: you can redistribute it and/or modify
// it under the terms of the GNU General Public License as published by
// the Free Software Foundation, either version 3 of the License, or
// any later version.
//
// This program is distributed in the hope that it will be useful,
// but WITHOUT ANY WARRANTY; without even the implied warranty of
// MERCHANTABILITY or FITNESS FOR A PARTICULAR PURPOSE.  See the
// GNU General Public License for more details.
//
// The GNU General Public License can be found here
// <http://www.gnu.org/licenses/>.
//
// -----------------------------------------------------------------------------
//

strategy(title="Ichimoku Cloud Strategy", shorttitle="Ichimoku Strategy", overlay=true, pyramiding=3)

conversionPeriods   = input(9,  minval=1, title="Conversion Line Periods"),
basePeriods         = input(26, minval=1, title="Base Line Periods")
laggingSpan2Periods = input(52, minval=1, title="Lagging Span 2 Periods"),
displacement        = input(26, minval=1, title="Displacement")

usePSARTrailStop    = input(true, title="Use Parabolic SAR for Trailing Stop")
psarStart           = input(0.02, title="Parabolic SAR Start")
psarIncrement       = input(0.02, title="Parabolic SAR Increment")
psarMaximum         = input(0.2,  title="Parabolic SAR Maximum")


donchian(len) => avg(lowest(len), highest(len))

conversionLine = donchian(conversionPeriods)
baseLine  = donchian(basePeriods)
leadLine1 = avg(conversionLine, baseLine)
leadLine2 = donchian(laggingSpan2Periods)
leadLineDisp1 = leadLine1[displacement]
leadLineDisp2 = leadLine2[displacement]

psar = sar(psarStart, psarIncrement, psarMaximum)

// BUY Signal:
// close > leading span b and
// leading span a > leading span b and
// close crosses over base line and
// close > parabolic sar
buySignal = close > leadLineDisp2 and
  leadLineDisp1 > leadLineDisp2 and
  crossover(close, baseLine) and
  (usePSARTrailStop ? close > psar : not usePSARTrailStop)

// Sell Signal:
// close < leading span a and
// leading span a < leading span b and
// close crosses under base line and
// close < psar
sellSignal = close < leadLineDisp1 and
  leadLineDisp1 < leadLineDisp2 and
  crossunder(close, baseLine) and
  (usePSARTrailStop ? close < psar : not usePSARTrailStop)

hasLong  = strategy.position_size > 0
hasShort = strategy.position_size < 0


strategy.entry("ichimoku-long", strategy.long, when = buySignal)
strategy.entry("ichimoku-short", strategy.short, when = sellSignal)

strategy.exit("trailstop-long", "ichimoku-long", stop = psar, when = hasLong and usePSARTrailStop)
strategy.exit("trailstop-short", "ichimoku-short", stop = psar, when = hasShort and usePSARTrailStop)