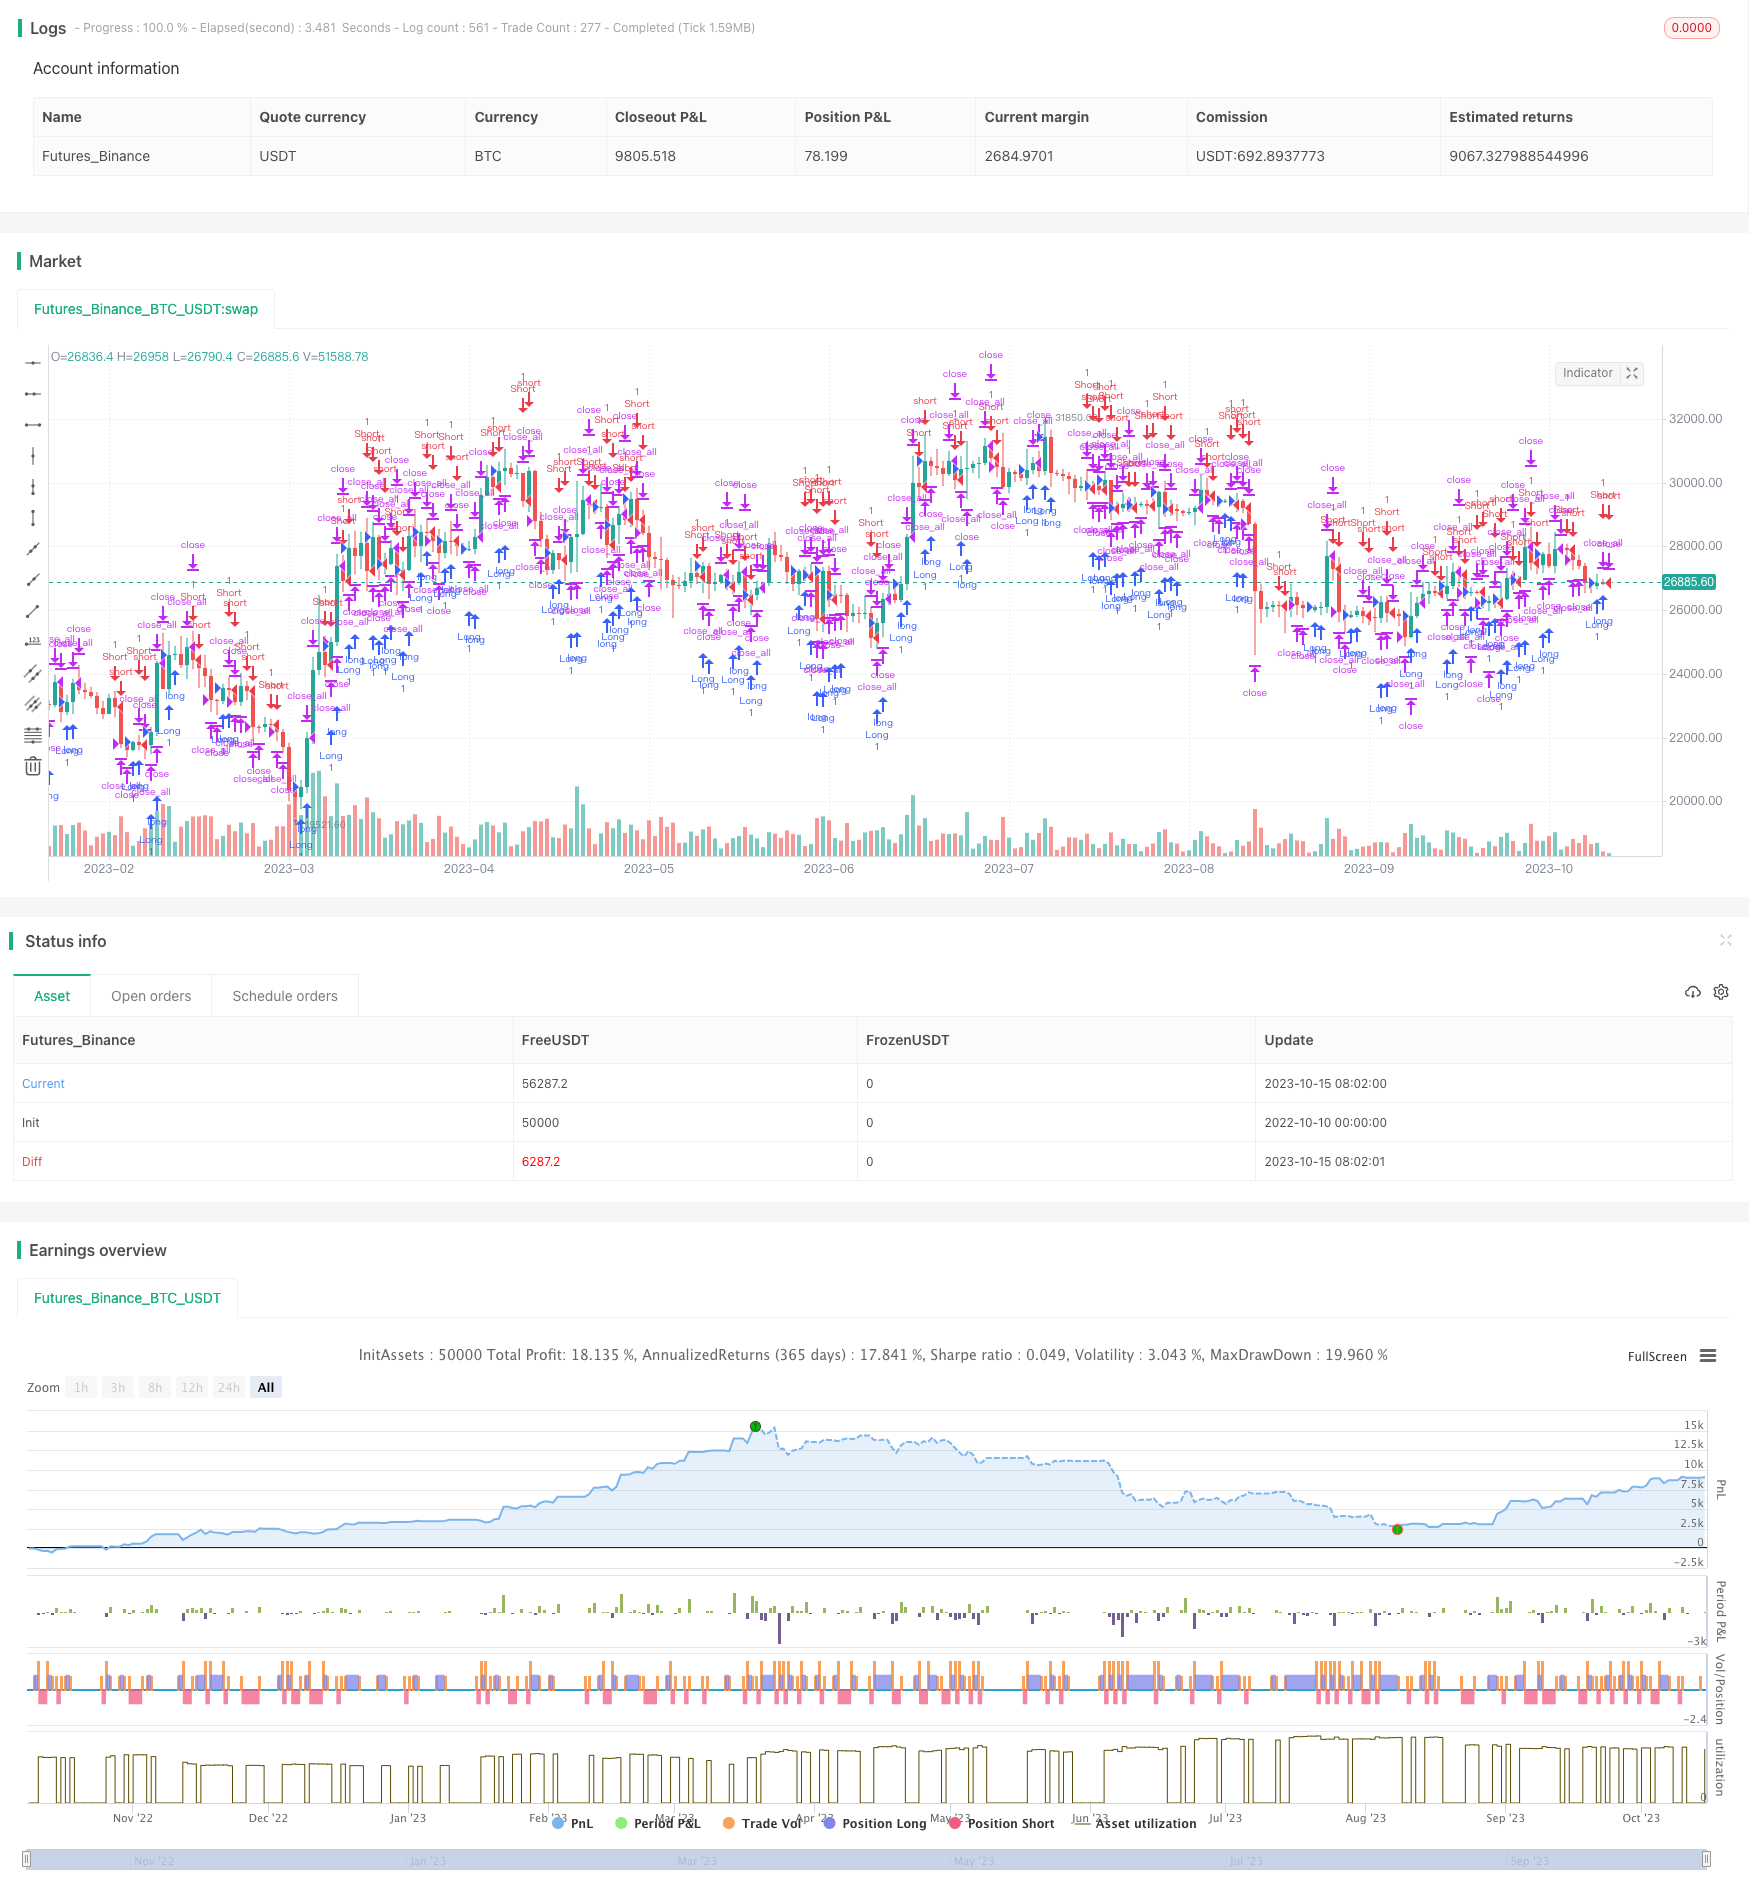
概述
这个策略通过组合使用多种蜡烛形态模型来进行股票交易。它结合了包裹线模型、空心蜡烛模型和十字星模型,可以在不同的市场条件下捕捉交易机会。
原理
该策略的核心逻辑是构建若干蜡烛形态判断规则,然后综合这些规则来产生交易信号。
首先,它定义了一些基础变量来描述蜡烛线的属性,如蜡烛实体大小body,开盘价open,收盘价close等。
然后,它根据蜡烛的收盘价与开盘价的关系,定义了3个trading bar类型:1代表涨,-1代表跌,0代表不涨不跌。
在此基础上,构建了3个蜡烛形态判断规则:
包裹线模型(Engulfing Pattern):当前K线包住上一K线,产生买入或卖出信号。
空心蜡烛模型(Harami Pattern): 上一K线包住当前K线,产生买入或卖出信号。
十字星模型(Harami Cross Pattern):空心蜡烛与十字星的组合,产生买入或卖出信号。
根据这些蜡烛形态规则,可以确定买入和卖出的时机。并结合一些附加条件,如交易时间范围限制,来过滤掉不符合要求的交易信号。
交易部分中,会先判断持仓情况,如果与蜡烛信号方向相反,会先平仓,然后再按照信号方向开仓。
优势
多种形态结合,稳定性强。单一形态可能受特定市场环境影响较大,组合使用形态可以提高稳定性。
同方向形态确认,综合判断,避免误判。不同的形态模型从不同角度判断趋势,可以相互验证信号。
参数可调整,适应性强。用户可以自由组合选择不同的形态模型,调整交易时间范围等参数,灵活应对市场变化。
完善的交易逻辑。结合持仓判断与止损退出逻辑,可以有效控制风险。
风险
多参数组合增加复杂度。需要测试各个参数的组合匹配性,不当的参数组合可能降低效果。
shape参数设置依赖经验。形态参数如实体大小是否合适需要积累经验来调整。
单边持仓带来的风险。仅做多或仅做空会限制获利空间。可以通过参数设置同时做多做空。
可能错过趋势反转点。此策略以形态识别为主,无法有效判断趋势反转。可以结合其他指标来判断时机。
优化
增加止损策略,以降低单边持仓带来的风险。
结合其他技术指标,判断大趋势走向,避免逆势交易。如MACD, Bollinger Band等。
测试不同品种的参数偏好,建立适合不同品种的形态组合。
增加机器学习算法,通过AI来辅助参数优化和形态识别。
总结
该策略通过综合运用多种蜡烛形态的优势,构建了一个相对稳定和可靠的短线交易系统。但部分参数设置和风险控制还需要进一步优化,以适应更复杂的市场环境。整体来说,该策略思路合理,在积累足够经验和数据的基础上,通过机器学习等手段进行智能优化,前景广阔。
/*backtest
start: 2022-10-10 00:00:00
end: 2023-10-16 00:00:00
period: 1d
basePeriod: 1h
exchanges: [{"eid":"Futures_Binance","currency":"BTC_USDT"}]
*/

//Noro
//2018

//@version=3
strategy(title = "Noro's CandleModels Tests", shorttitle = "CandleModels tests", overlay = true, default_qty_type = strategy.percent_of_equity, default_qty_value = 100, pyramiding = 0)

//Settings
needlong = input(true, defval = true, title = "Long")
needshort = input(true, defval = true, title = "Short")

eng = input(true, defval = true, title = "Model Engulfing")
har = input(true, defval = true, title = "Model Harami")
harc = input(true, defval = true, title = "Model Harami Cross")

fromyear = input(1900, defval = 1900, minval = 1900, maxval = 2100, title = "From Year")
toyear = input(2100, defval = 2100, minval = 1900, maxval = 2100, title = "To Year")
frommonth = input(01, defval = 01, minval = 01, maxval = 12, title = "From Month")
tomonth = input(12, defval = 12, minval = 01, maxval = 12, title = "To Month")
fromday = input(01, defval = 01, minval = 01, maxval = 31, title = "From day")
today = input(31, defval = 31, minval = 01, maxval = 31, title = "To day")
rev = input(false, defval = false, title = "Reversive trading")

//Body
body = abs(close - open)
abody = sma(body, 10)

//MinMax Bars
min = min(close, open)
max = max(close, open)

//Signals
bar = close > open ? 1 : close < open ? -1 : 0
doji = body < abody / 10
up1 = eng and bar == 1 and bar[1] == -1 and min <= min[1] and max >= max[1]
dn1 = eng and bar == -1 and bar[1] == 1 and min <= min[1] and max >= max[1]
up2 = har and bar == 1 and bar[1] == -1 and min >= min[1] and max <= max[1]
dn2 = har and bar == -1 and bar[1] == 1 and min >= min[1] and max <= max[1]
up3 = harc and doji and bar[1] == -1 and low >= min[1] and high <= max[1]
dn3 = harc and doji and bar[1] == 1 and low >= min[1] and high <= max[1]
exit = ((strategy.position_size > 0 and bar == 1) or (strategy.position_size < 0 and bar == -1)) and body > abody / 2 and rev == false

//Trading
if up1 or up2 or up3
    if strategy.position_size < 0
        strategy.close_all()

    strategy.entry("Long", strategy.long, needlong == false ? 0 : na, when=(time > timestamp(fromyear, frommonth, fromday, 00, 00) and time < timestamp(toyear, tomonth, today, 23, 59)))

if dn1 or dn2 or dn3
    if strategy.position_size > 0
        strategy.close_all()

    strategy.entry("Short", strategy.short, needshort == false ? 0 : na, when=(time > timestamp(fromyear, frommonth, fromday, 00, 00) and time < timestamp(toyear, tomonth, today, 23, 59)))

if time > timestamp(toyear, tomonth, today, 23, 59) or exit
    strategy.close_all()