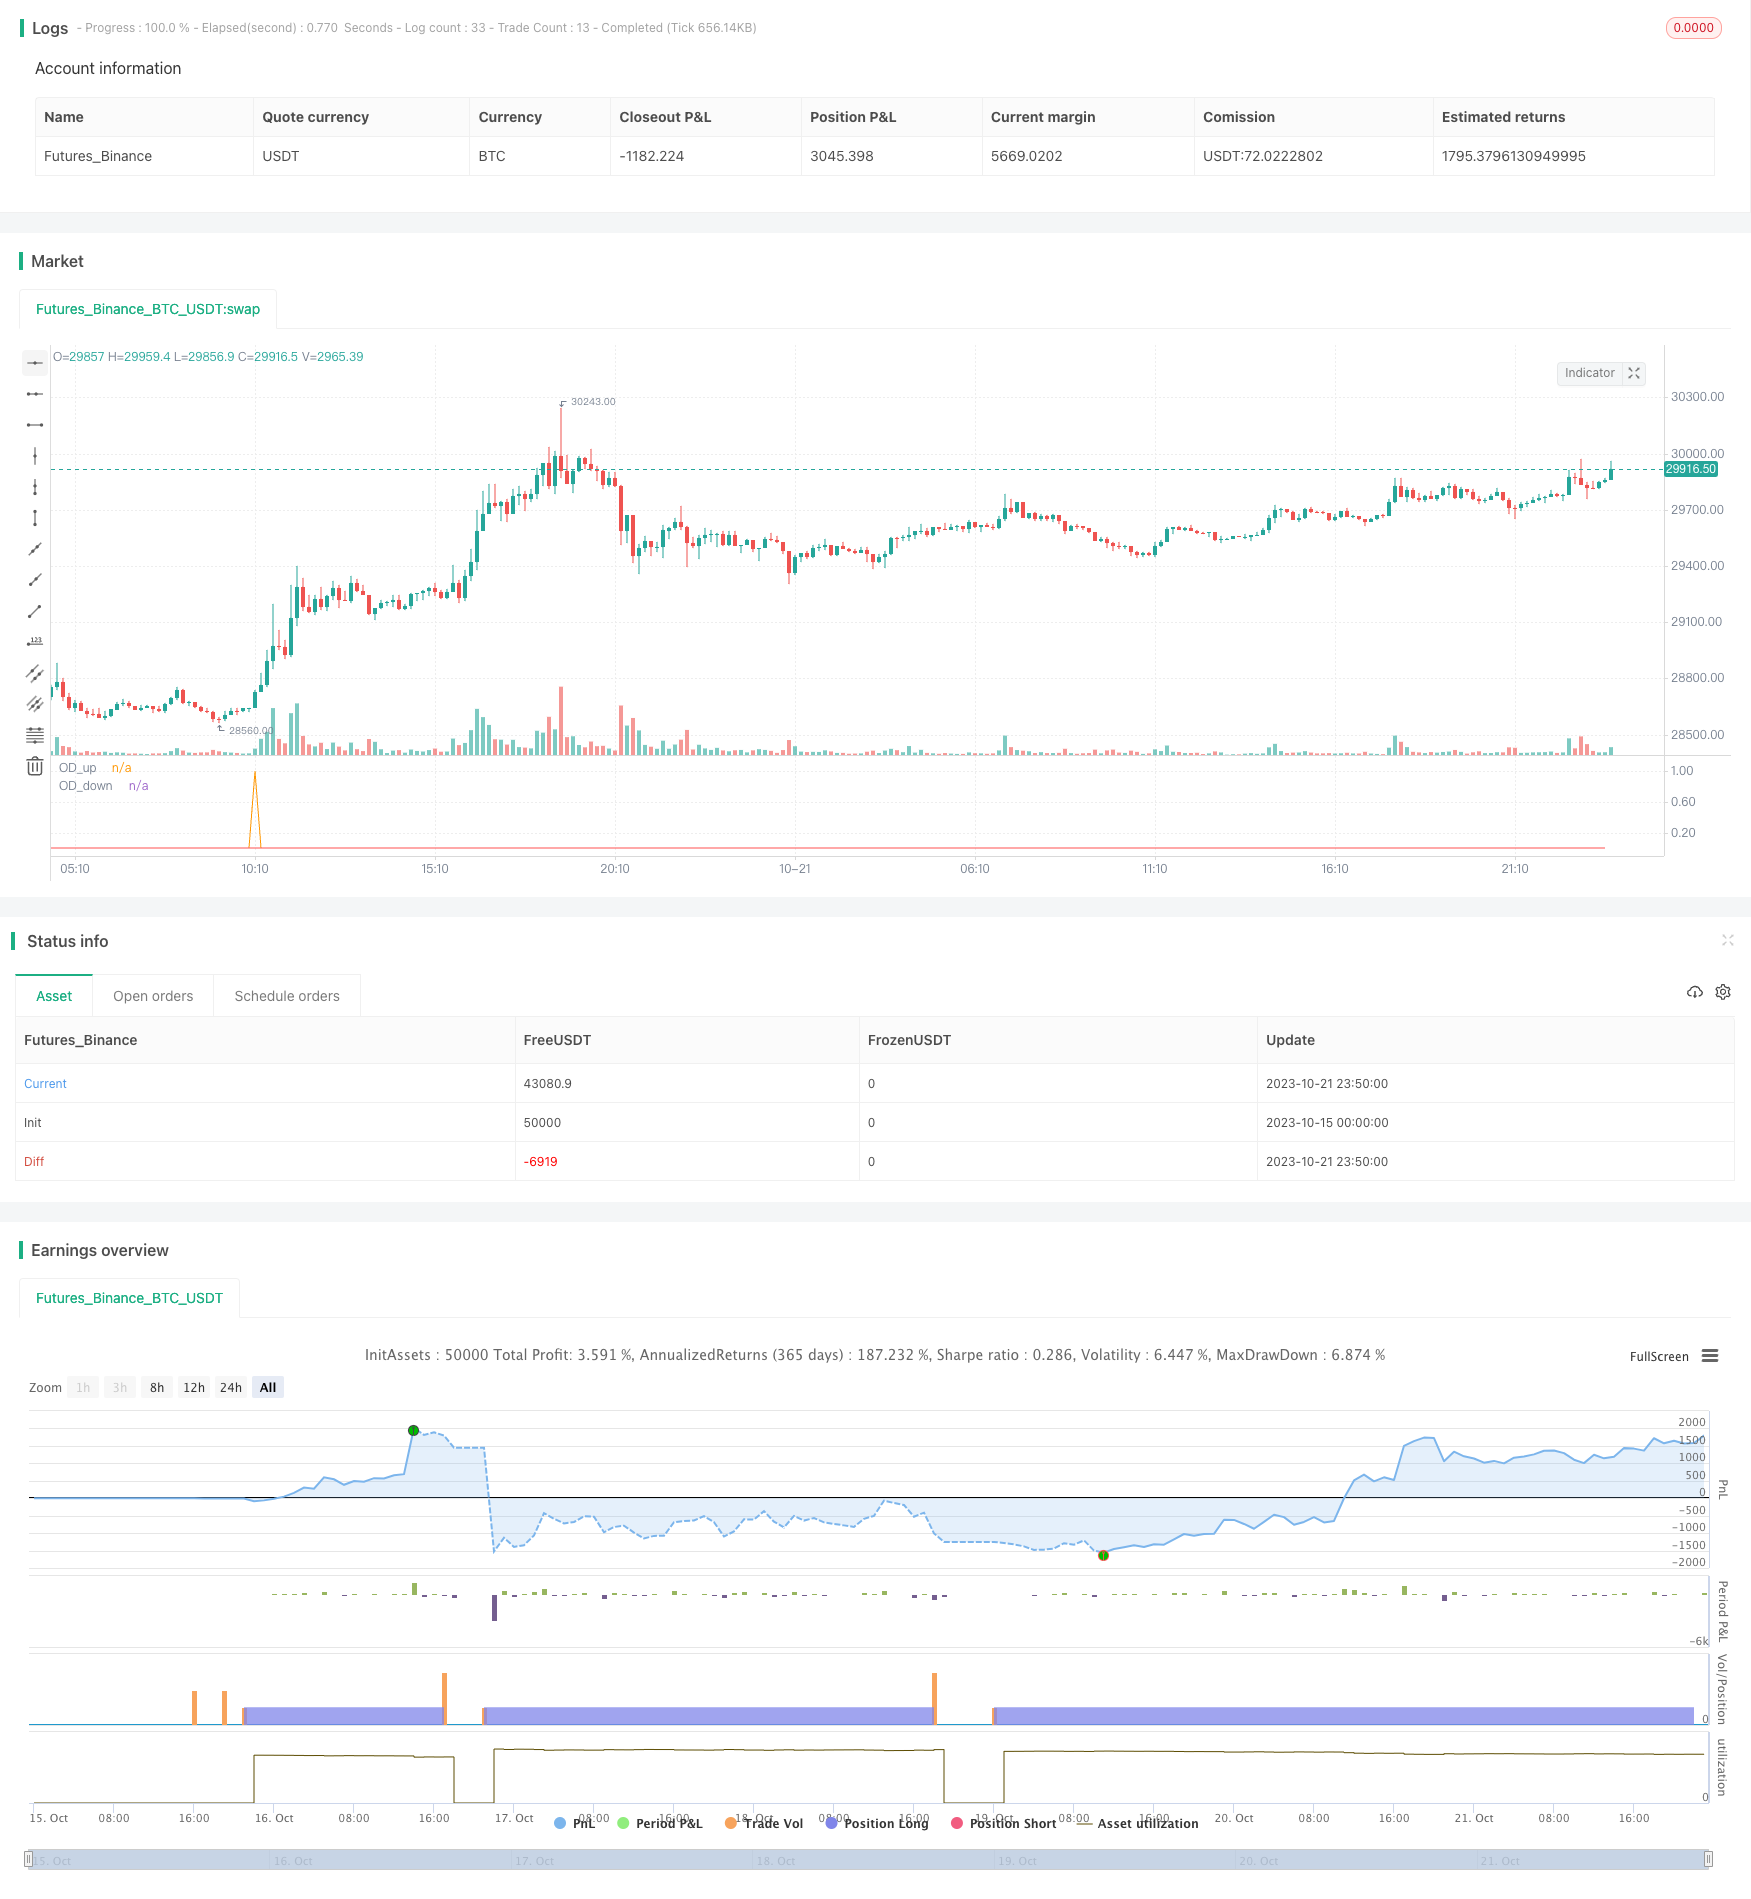
概述
开盘驱动策略通过观察交易日开盘后的前30分钟的价格行为,识别出价格的强势突破方向,并随后进入该方向的趋势交易。该策略主要利用开盘后的流动性和交易量增加,能产生较大的价格波动和方向性力量的特点。
策略原理
该策略使用30分钟K线,因需要有足够的时间区间来判断开盘后的价格行为。
识别出以下开盘时段的K线:0700-0715、0800-0815、1300-1315、1430-1445。
判断开盘K线是否满足以下条件:
开盘价接近该K线最低价,收盘价接近最高价(长K线)
或开盘价接近最高价,收盘价接近最低价(短K线)
并且该K线的最高价超过之前5根K线最高价1倍范围,或最低价低于之前5根K线最低价1倍范围(表明有突破)
如果上述条件成立,则在该K线发生后的第3根K线进行进入该方向的趋势交易。
并设置止损线为入场K线的最高价或最低价。
持仓3根K线后离场,即90分钟。
优势分析
- 利用开盘后的高流动性特征,能捕捉到较大方向性行情
- 突破过滤条件避免了震荡趋势产生的假信号
- 较高时间周期过滤了过多频繁交易
- 有止损设置避免亏损扩大
风险分析
- 固定的开盘区间时间存在被趋势突破的风险
- 突破阈值设定不恰当可能滤除部分有效信号
- 固定持仓时间无法根据特定行情调整
- 没有移动止损,无法追踪趋势
可以考虑:
- 利用更多参数动态确定开盘区间
- 优化突破阈值参数
- 根据波动程度调整持仓时间
- 添加移动止损措施
优化方向
- 可以结合更多指标判断趋势方向,提高信号质量
- 可以在更低时间帧入场,提高操作频率
- 可以根据回测结果优化参数,如开盘区间、突破阈值、止损设定等
- 可以考虑动态止损、移动止损、再次入场等策略提高收益
- 可以尝试多品种回测,确定最佳适用品种
总结
开盘驱动策略通过捕捉开盘后价格的强势突破方向实现趋势跟踪。相比随机入场,具有较好的风险回报特征。关键是要把握好参数设定,选择合适的品种,在避免过于频繁出入场的同时,提高获利概率。此策略适合有经验的交易者在适当辅助分析的基础上运用。
策略源码
/*backtest
start: 2023-10-15 00:00:00
end: 2023-10-22 00:00:00
period: 10m
basePeriod: 1m
exchanges: [{"eid":"Futures_Binance","currency":"BTC_USDT"}]
*/

// This source code is subject to the terms of the Mozilla Public License 2.0 at https://mozilla.org/MPL/2.0/
// © Marcns_

//@version=5
// a script that highlights open drives around cash market opens throughout the day
// this indicator identifies the following cash open, open drives 0700 - 0715 / 0800 - 0815 / 1300 - 1315 / 1430 - 1445
// an open drive is when a cash market opens and price runs either up or down away from the opening price, often this will be the high or the low the remainer of the session or day
// and often identify a trend session
strategy("Open Drive", commission_type =  strategy.commission.cash_per_contract, commission_value = 3.8 )

// open drive filter times - all times GMT
eu_sev = time(timeframe.period, "0700-0715", "GB")
eu_eig = time(timeframe.period, "0800-0815", "GB")
us_one = time(timeframe.period, "1300-1315", "GB")
us_two = time(timeframe.period, "1430-1445", "GB")


// identify bar that opens at low and closes at high + vice versa
// bar needs to open at one extreme and close at another
TrndExThreshold_Open = 0.15
TrndExThreshold_Close = 0.15

// add a bar range expansion filter - range of bar correlates to volume, high volume = wider range. This script will be able to filter for a break of a 5 bar range +100% or -100%

fbhi = ta.highest(5)
fblo = ta.lowest(5)

fbr = (fbhi - fblo)

RangeEx_up = 0.0

if high >= (fbhi[1] + fbr[1])
    RangeEx_up := 1.0
else
    na

// range ex down

RangeEx_do = 0.0

if low <= (fblo[1] - fbr[1])
    RangeEx_do := 1.0
else
    na


//#1 open within 5% of low

OpenAtLow = 0.0

if (close > open) and (open-low) / (high-low) < TrndExThreshold_Open
    OpenAtLow := 1.0
else
    na

//#2 close within 5% of high

CloseAtHigh = 0.0

if (close > open) and (high-close) / (high-low) < TrndExThreshold_Close
    CloseAtHigh := 1.0
else
    na

OD_Up = 0.0

if (OpenAtLow + CloseAtHigh + RangeEx_up == 3.0) and ( eu_sev or eu_eig or us_one or us_two)
    OD_Up := 1
else
    na

plot(OD_Up, title = "OD_up")


OpenAtHigh = 0.0

if (close < open) and (high-open) / (high-low) < TrndExThreshold_Open
    OpenAtHigh := 1.0
else
    na

//#2 close within 5% of high

CloseAtLow = 0.0

if (close < open) and (close-low) / (high-low) < TrndExThreshold_Close
    CloseAtLow := 1.0
else
    na

OD_Down = 0.0

if (OpenAtHigh + CloseAtLow + RangeEx_do == 3.0) and ( eu_sev or eu_eig or us_one or us_two)
    OD_Down := -1
else
    na

plot(OD_Down, title = "OD_down", color = color.red)


//3sma

ma = ta.sma(close,3)

// one time framing - highlight bars the make a series of lower highs or higher lows to identify trend
// one time frame up
otf_u = 0.0

if close > ma and close[1] > ma[1]
    otf_u := 1
else
    na
// one time frame down
otf_d = 0.0

if close < ma and close[1] < ma[1]
    otf_d := 1
else
    na


//bgcolor(otf_u ? color.rgb(76, 175, 79, 70) : na)
//bgcolor(otf_d ? color.rgb(255, 82, 82, 66) : na)

// record high and low of entry bar into variable for absolute stop
// buy stop
bs = 0.0

if OD_Up
    bs := low[1]
else
    na

// sell stop
ss = 0.0

if OD_Down
    ss := high[1]
else
    na


// strategy entry and exits
// long
if OD_Up
    strategy.entry("el", strategy.long, 2)
if ta.barssince(OD_Up)> 3
    strategy.exit(id = "ex" , from_entry = "el", limit = close)

// short
if OD_Down
    strategy.entry("es", strategy.short, 2)
if ta.barssince(OD_Down)> 3
    strategy.exit(id = "ex" , from_entry = "es", limit = close)