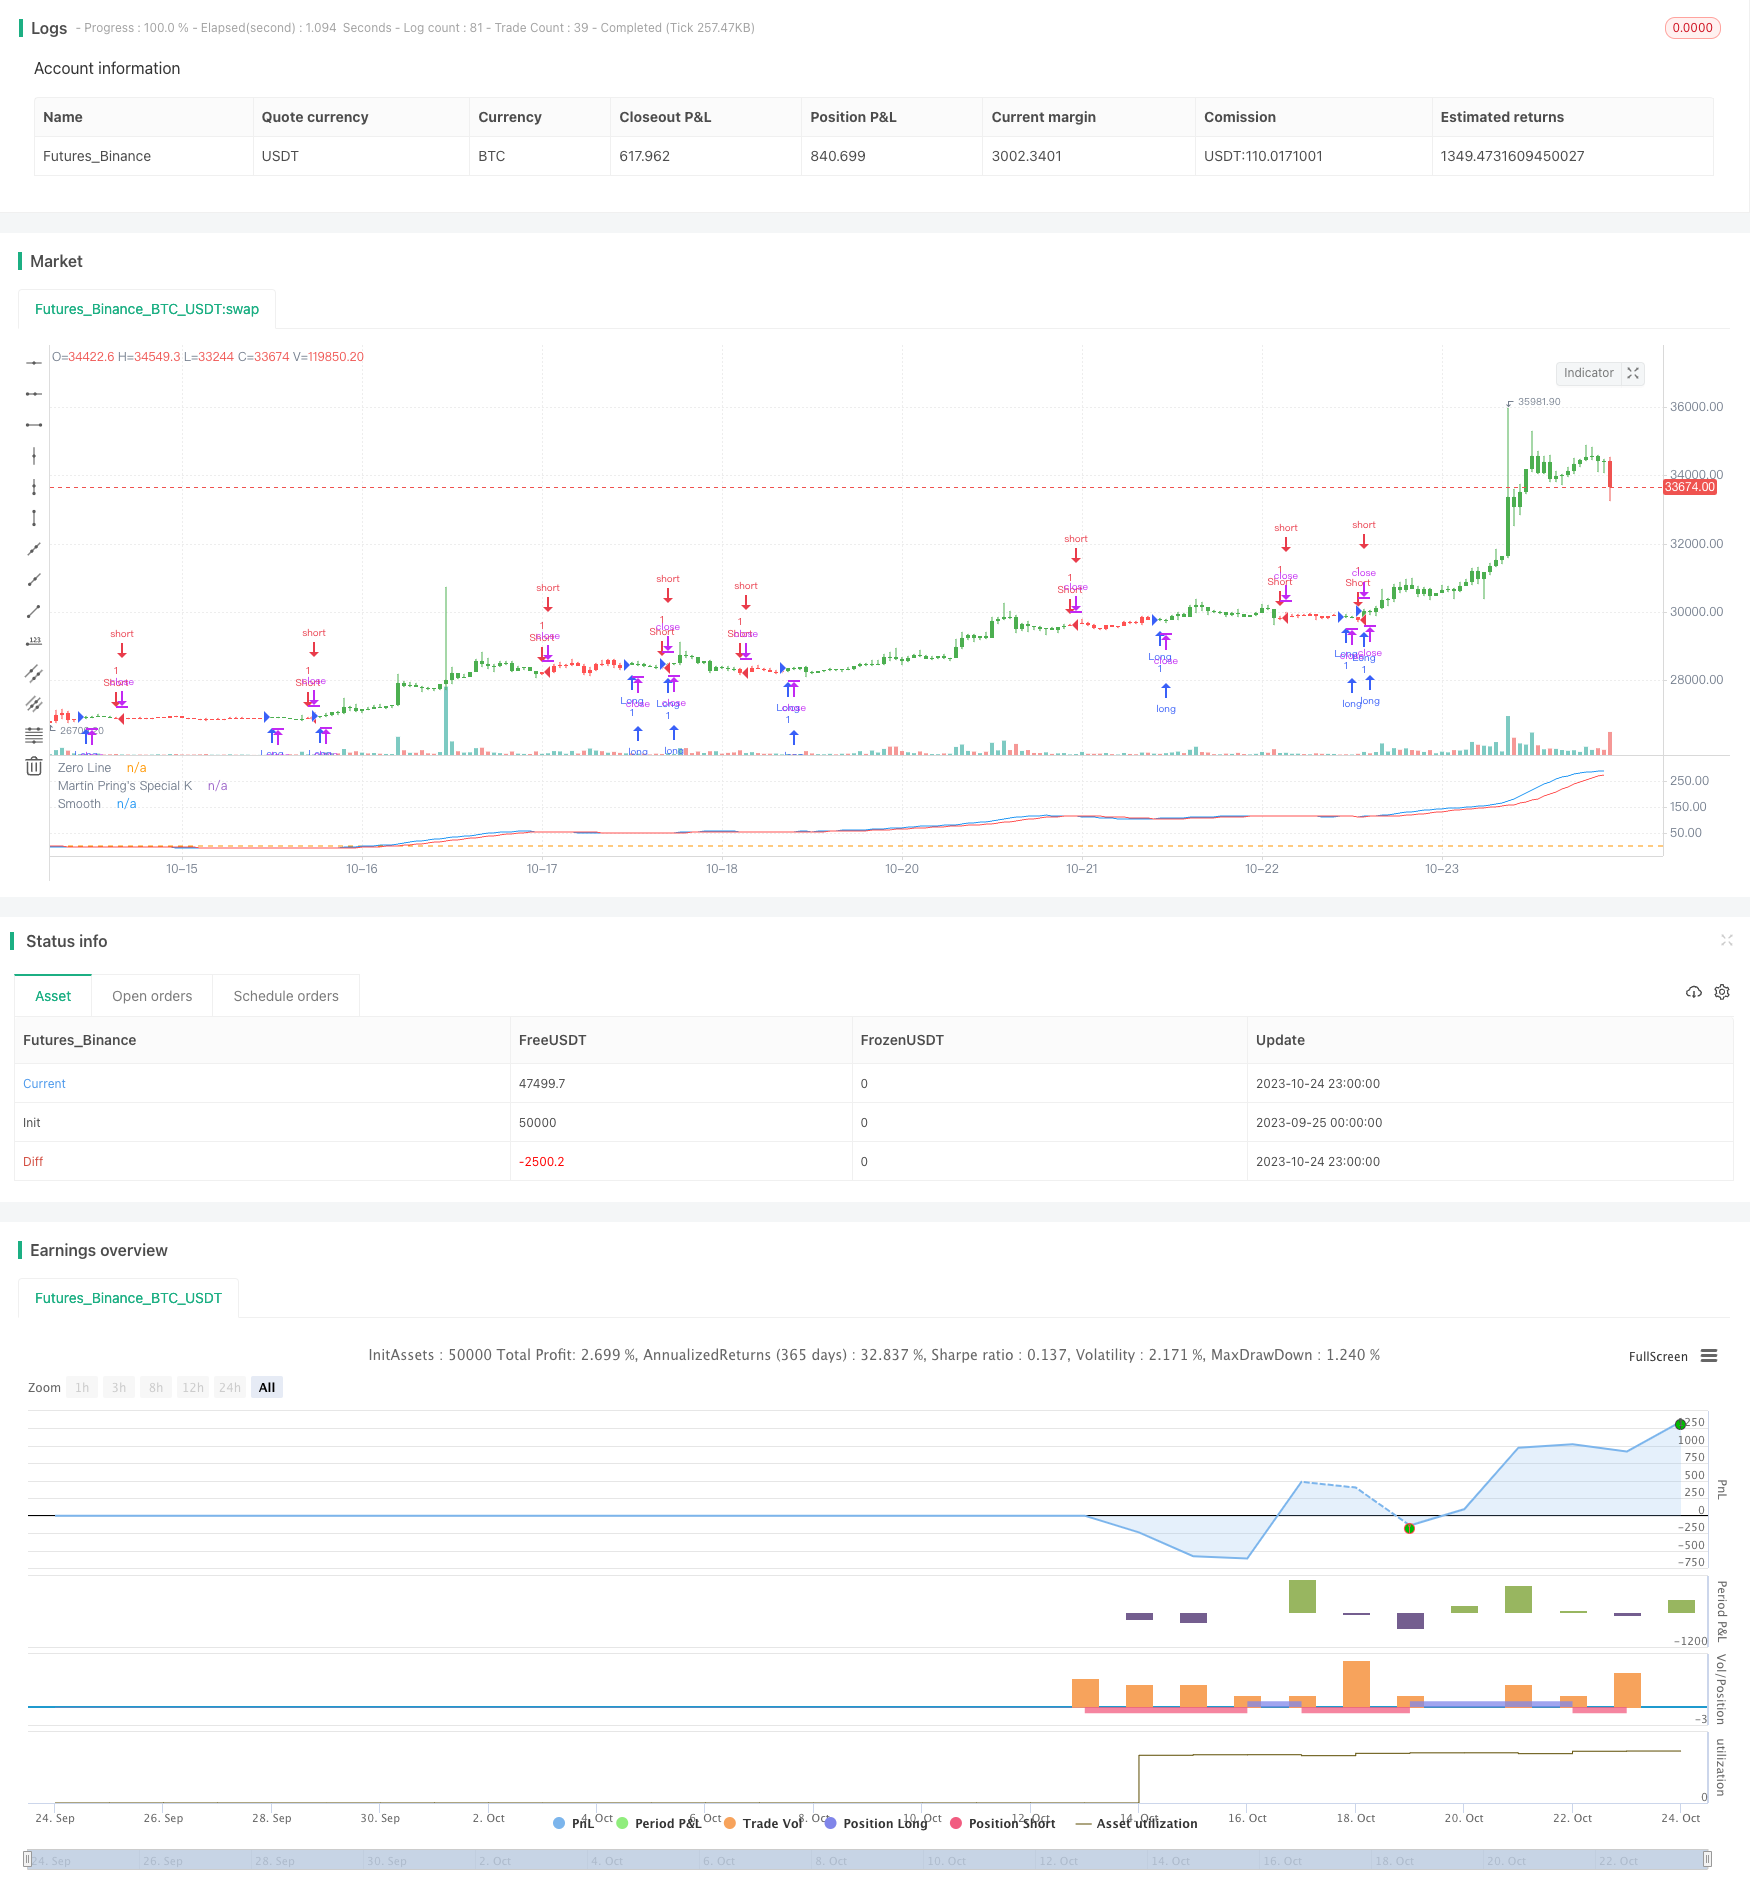
概述
春秋叠加动量策略主要是通过计算不同周期的变化率ROC,并按比例赋权叠加,形成一个综合动量指标,以判断行情趋势方向的策略。该策略将短期、中期和长期的动量指标进行叠加,能够平衡短期和长期趋势,避免产生假信号。
策略原理
该策略首先计算10日、15日、20日等不同周期的ROC指标,然后对ROC进行平滑处理,并按照1-4的比例进行赋权叠加,计算公式如下:
roc1 = (sma(roc(close,10),10)*1)
roc2 = (sma(roc(close,15),10)*2)
...
osc = roc1+roc2+roc3+roc4+...
其中,roc1-roc12代表不同周期ROC的计算,分别对应10日、15日至530日周期。 Computes the Rate of Change (ROC) over the specified period.
接着对osc进行a天(默认10天)的SMA平滑处理,得到oscsmt。
然后比较osc与oscsmt的大小关系,当osc上穿oscsmt时为看涨信号,进入做多方向;当osc下穿oscsmt时为看跌信号,进入做空方向。
最后,可选择反转交易方向。
策略优势
将短期和长期动量指标进行叠加,能够同时捕捉短期和长期趋势,避免产生假信号。
通过差价比较osc和oscsmt,可以减少平盘区域的无谓交易。
可自定义参数,调整计算ROC的周期参数,以及SMA的平滑参数。
可选择反转交易方向,满足不同交易风格。
可视化指标,直观判断买卖点。
策略风险及优化
ROC指标对突发异常价格非常敏感,可能产生错误信号。可适当增大SMA平滑参数a,降低ROC指标的灵敏度。
默认参数可能不适用于所有品种,需要根据不同品种特点优化参数,找到最佳参数组合。
仅基于osc和oscsmt的差价比较产生交易信号,可结合其他指标过滤信号,降低错误交易概率。
本策略更适合中长线交易,短线交易效果可能不佳。可调整ROC的计算周期,优化本策略的使用场景。
总结
春秋叠加动量策略通过计算多个周期的ROC指标,并进行叠加得到综合动量指标,能够同时兼顾短期和长期趋势,避免产生假信号。相比单一ROC指标,该策略可大大提高信号质量和可靠性。但本策略也存在一定监控风险,需优化参数并结合其他指标使用,方能发挥最大效用。
/*backtest
start: 2023-09-25 00:00:00
end: 2023-10-25 00:00:00
period: 1h
basePeriod: 15m
exchanges: [{"eid":"Futures_Binance","currency":"BTC_USDT"}]
*/

//@version=2
////////////////////////////////////////////////////////////
//  Copyright by HPotter 08/08/2017
// Pring's Special K is a cyclical indicator created by Martin Pring.
// His method combines short-term, intermediate and long-term velocity
// into one complete series. Useful tool for Long Term Investors
// Modified for any source.
//
// You can change long to short in the Input Settings
// Please, use it only for learning or paper trading. Do not for real trading.
////////////////////////////////////////////////////////////
strategy(title="Martin Pring's Special K Backtest", shorttitle="UCS_Pring_sK")
a = input(10, title = "Smooth" )
sources = input(title="Source",  defval=close)
reverse = input(false, title="Trade reverse")
roc1 = (sma(roc(sources,10),10)*1)
roc2 = (sma(roc(sources,15),10)*2)
roc3 = (sma(roc(sources,20),10)*3)
roc4 = (sma(roc(sources,30),15)*4)
roc5 = (sma(roc(sources,40),50)*1)
roc6 = (sma(roc(sources,65),65)*2)
roc7 = (sma(roc(sources,75),75)*3)
roc8 = (sma(roc(sources,100),100)*4)
roc9 = (sma(roc(sources,195),130)*1)
roc10 = (sma(roc(sources,265),130)*2)
roc11 = (sma(roc(sources,390),130)*3)
roc12 = (sma(roc(sources,530),195)*4)
osc = roc1+roc2+roc3+roc4+roc5+roc6+roc7+roc8+roc9+roc10+roc11+roc12
oscsmt = sma(osc,a)
pos = iff(osc > oscsmt, 1,
	     iff(osc < oscsmt, -1, nz(pos[1], 0)))
possig = iff(reverse and pos == 1, -1,
          iff(reverse and pos == -1, 1, pos))
if (possig == 1)
    strategy.entry("Long", strategy.long)
if (possig == -1)
    strategy.entry("Short", strategy.short)
barcolor(possig == -1 ? red: possig == 1 ? green : blue )
plot(osc, color=blue, title="Martin Pring's Special K")
plot(oscsmt, color = red, title = "Smooth")
hline(0, title="Zero Line")