概述
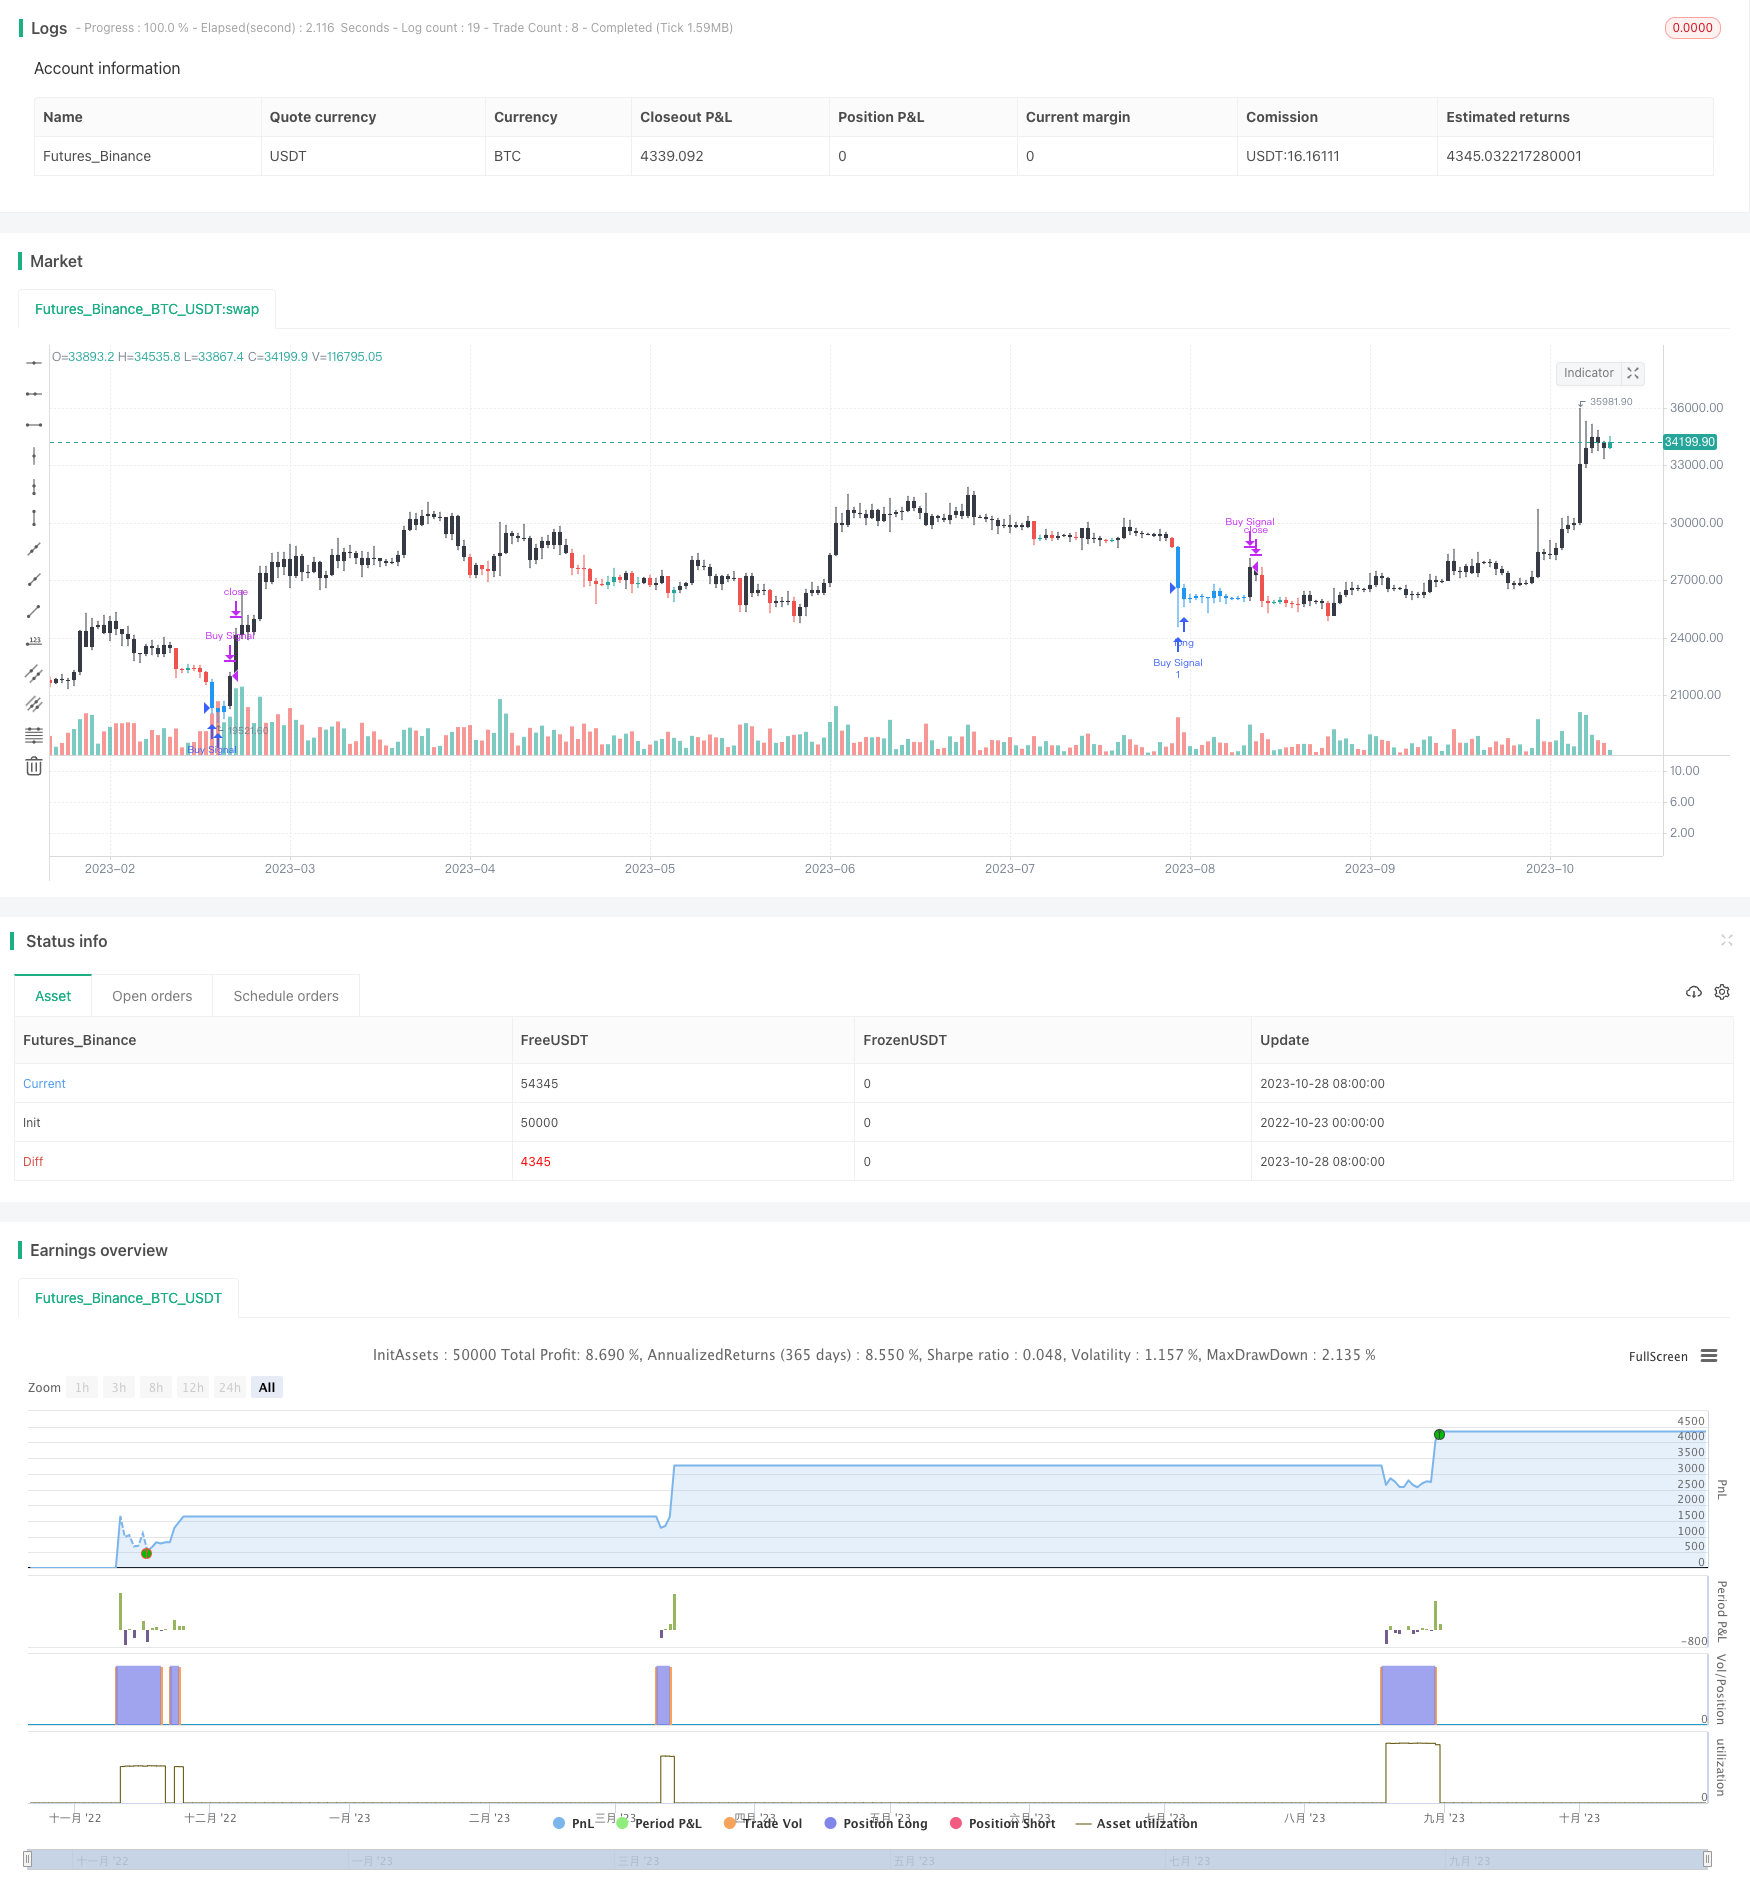
该策略基于相对强弱指标RSI实现了一个简单的阈值交易策略。当RSI低于阈值30时买入,当RSI高于阈值40时卖出。持仓时间固定为10天。该策略适合中短期交易。
策略原理
该策略主要基于RSI指标的过卖区和过买区实现交易信号的产生。RSI指标反映了一个周期内涨跌幅的快慢。RSI低于30表示处于超过卖区,股价可能反弹;RSI高于70表示处于超过买区,股价可能下跌。
具体来说,该策略首先计算10日RSI,然后设定阈值30和40。当10日RSI低于30时产生买入信号,当10日RSI高于40时产生卖出信号。收到买入信号后,开仓买入。收到卖出信号后,如果持仓天数超过10天则直接卖出平仓;如果持仓天数不足10天,则继续持仓至第10天卖出。
该策略简单并且容易理解,通过RSI指标判断超卖超买区域,实现了一个基于指标的阈值交易策略。
策略优势
- 使用广泛的RSI指标,参数优化空间大
该策略使用了广泛应用的RSI指标。RSI参数可以进行调整优化,适用于不同周期和市场环境。
- 实现了简单的趋势跟踪
RSI可以反映价格变化趋势。策略根据RSI指标来判断价格走势,实现了简单的趋势跟踪。
- 风险控制较好
策略采用了固定持仓期限,可以有效控制单笔损失。同时,RSI参数可以进行调整,降低错误交易概率。
策略风险
- RSI参数容易过优化
RSI的参数可以灵活设置,但是过度优化及回测偏差会带来实盘风险。
- 存在一定的滞后性
RSI属于趋势跟踪指标,对突发事件反应较慢,存在一定滞后性。应结合其他指标优化。
- 固定持仓时间不够灵活
固定的持仓时间强制了止盈止损点,无法根据市场变化进行调整。希望进一步优化成动态调整止盈止损。
策略优化方向
优化RSI参数,测试不同的参数对策略的影响
增加其他指标,形成指标组合,利用不同指标的优势
优化止盈止损策略,使其能够根据市场变化进行动态调整
优化仓位管理,根据市场情况动态调整仓位
测试适合该策略的品种,选择流动性好、波动较大的品种
优化交易时间,测试不同的交易时间对策略的影响
总结
该策略整体较为简单,通过RSI指标实现了基于阈值的交易策略。策略优点是简单、易于理解,风险控制相对较好。但是也存在RSI参数优化困难、止盈止损不灵活等问题。未来的优化方向包括参数优化、止盈止损优化、仓位管理等。需要进一步优化后方可实盘。
/*backtest
start: 2022-10-23 00:00:00
end: 2023-10-29 00:00:00
period: 1d
basePeriod: 1h
exchanges: [{"eid":"Futures_Binance","currency":"BTC_USDT"}]
*/

// This source code is subject to the terms of the Mozilla Public License 2.0 at https://mozilla.org/MPL/2.0/
// © Bitduke

//@version=4
// strategy("Simple RSI Buy/Sell at a level", shorttitle="Simple RSI Strategy", overlay=true,calc_on_every_tick=false,pyramiding=1, default_qty_type=strategy.cash,default_qty_value=1000, currency=currency.USD, initial_capital=1000,commission_type=strategy.commission.percent, commission_value=0.075)
overbought = input(40, title="overbought value")
oversold = input(30, title="oversold value")
// Component Test Periods Code Begin
testStartYear = input(2018, "Backtest Start Year")
testStartMonth = input(1, "Backtest Start Month")
testStartDay = input(1, "Backtest Start Day")
testPeriodStart = timestamp(testStartYear,testStartMonth,testStartDay,0,0)

testStopYear = input(2021, "Backtest Stop Year")
testStopMonth = input(16, "Backtest Stop Month")
testStopDay = input(2, "Backtest Stop Day")
testPeriodStop = timestamp(testStopYear,testStopMonth,testStopDay,0,0)

// A switch to control background coloring of the test period
testPeriodBackground = input(title="Color Background?", type=input.bool, defval=true)
testPeriodBackgroundColor = testPeriodBackground and (time >= testPeriodStart) and (time <= testPeriodStop) ? #00FF00 : na
bgcolor(testPeriodBackgroundColor, transp=97)

testPeriod() => true
// Component Test Periods Code End
//////////////////////////////////////////////////////////////////////

myrsi = rsi(close, 10) > overbought
myrsi2 = rsi(close, 10) < oversold

barcolor(myrsi ? color.black : na)
barcolor(myrsi2 ? color.blue : na)


myEntry = myrsi2 and hour(time) <= 9

strategy.entry("Buy Signal", strategy.long, when = myEntry and testPeriod())

// Close 10 bar periods after the condition that triggered the entry

//if (myEntry[10])
    //strategy.close("Buy Signal")
strategy.close("Buy Signal", when = barssince(myEntry) >= 10 or myrsi and testPeriod())

//strategy.entry("Sell Signal",strategy.short, when = myrsi2)