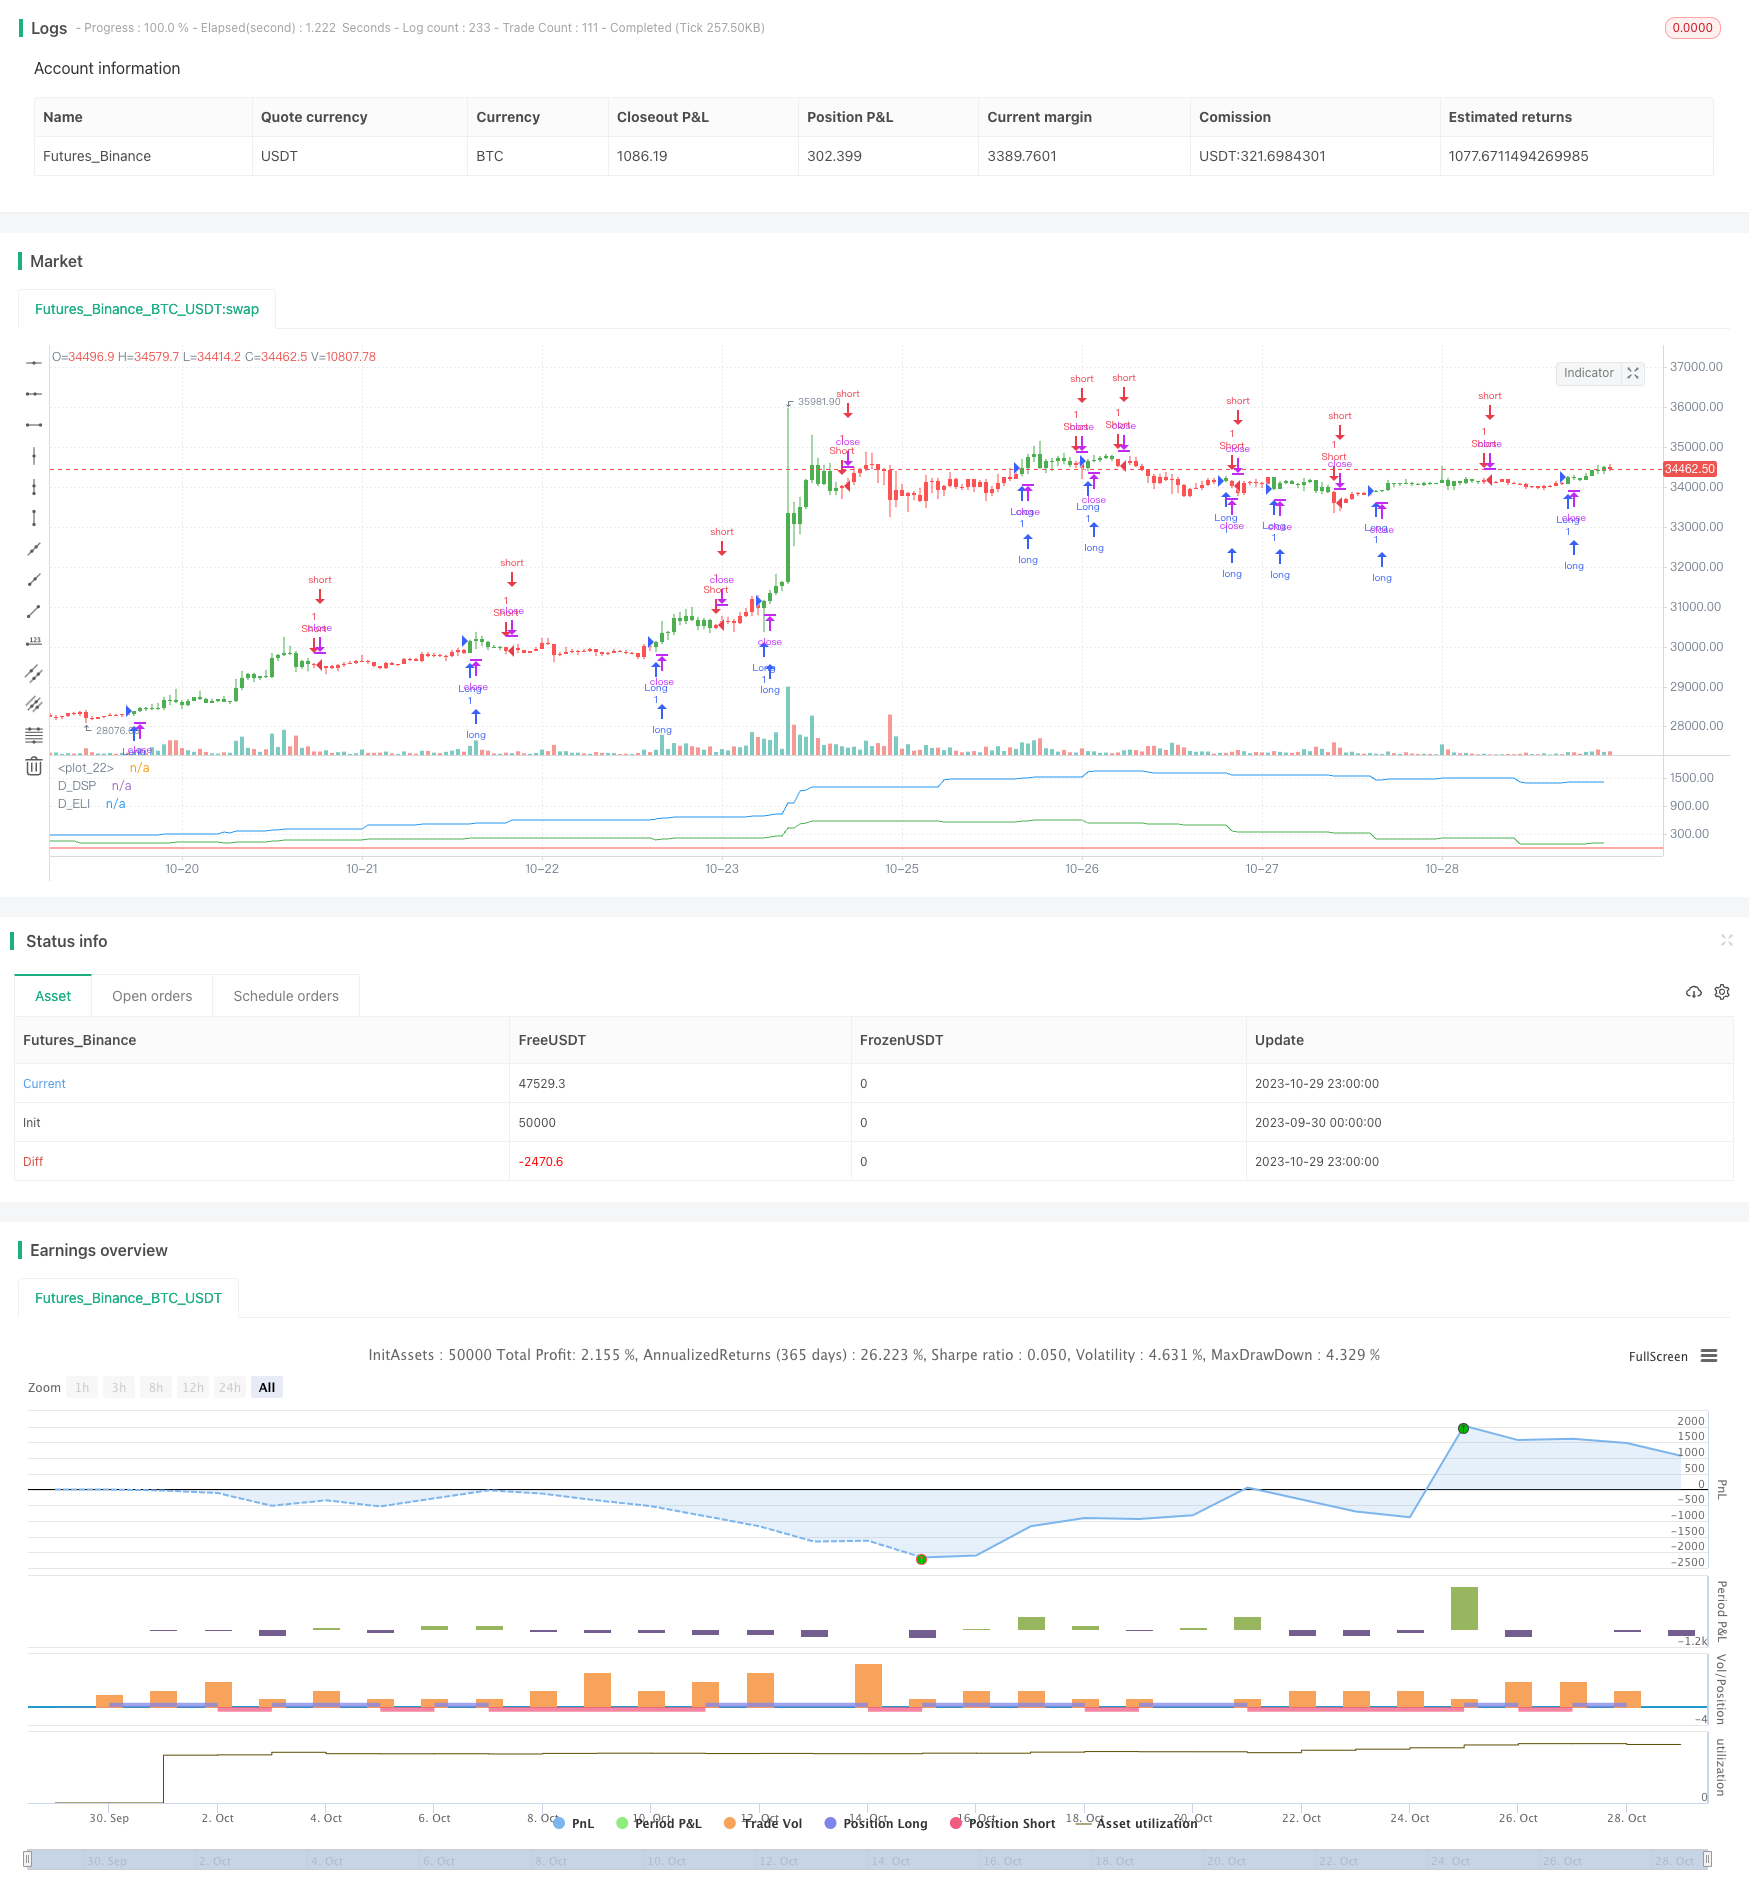
概述
该策略基于技术分析大师约翰·埃勒斯的思想,使用埃勒斯引领指标来判断价格的历史周期情况,发出买入和卖出信号。策略结合去趋势合成价格和埃勒斯引领指标,利用指标线穿越去趋势合成价格产生交易信号。
策略原理
该策略首先计算去趋势合成价格(Detrended Synthetic Price,DSP),DSP通过减去一个3阶巴特沃斯滤波器和2阶巴特沃斯滤波器的值,得到一个与真实价格主导周期同步的函数。
然后计算埃勒斯引领指标(Ehlers Leading Indicator,ELI),ELI是通过减去去趋势合成价格的简单移动平均和去趋势合成价格得到的,它可以提前发出周期转折点的信号。
最后,当埃勒斯引领指标线穿越去趋势合成价格时,产生买入和卖出信号。如果ELI上穿DSP,产生买入信号;如果ELI下穿DSP,产生卖出信号。
优势分析
该策略最大的优势在于利用埃勒斯引领指标提前判断价格走势的转折点,可以在价格开始反转前就开仓建立头寸,从而获取更高的获利空间。
另外,该策略结合去趋势价格进行交易信号判断,可过滤掉价格中无关的低频信息,使策略更加专注于价格周期性规律,不会被短期市场噪音干扰。
风险及优化
该策略主要风险在于埃勒斯引领指标存在错误识别信号的可能,导致超前开仓亏损。可以通过调整指标参数来优化指标的灵敏度。
另外,交易者需要关注该策略只适用于具有明显周期规律的品种,对于价格走势较为混乱的品种效果会打折扣。建议考察品种的周期规律性再决定是否使用该策略。
可以通过结合其他指标进行确认,或者调整持仓管理策略来控制风险。例如设置止损线,或缩小单笔交易规模等。
总结
该策略利用埃勒斯引领指标判断价格周期性,在价格开始新一轮周期前建立头寸,是一种典型的趋势跟随策略。该策略对周期性明显的品种效果很好,但也存在一定的假信号风险。通过参数调优和风险管理可以使策略更稳定可靠。
/*backtest
start: 2023-09-30 00:00:00
end: 2023-10-30 00:00:00
period: 1h
basePeriod: 15m
exchanges: [{"eid":"Futures_Binance","currency":"BTC_USDT"}]
*/

//@version=2
////////////////////////////////////////////////////////////
//  Copyright by HPotter v1.0 23/03/2017
// This Indicator plots a single
// Daily DSP (Detrended Synthetic Price) and a Daily ELI (Ehlers Leading
// Indicator) using intraday data.
// Detrended Synthetic Price is a function that is in phase with the dominant
// cycle of real price data. This one is computed by subtracting a 3 pole Butterworth
// filter from a 2 Pole Butterworth filter. Ehlers Leading Indicator gives an advanced
// indication of a cyclic turning point. It is computed by subtracting the simple
// moving average of the detrended synthetic price from the detrended synthetic price.
// Buy and Sell signals arise when the ELI indicator crosses over or under the detrended
// synthetic price.
// See "MESA and Trading Market Cycles" by John Ehlers pages 64 - 70.
//
// You can change long to short in the Input Settings
// Please, use it only for learning or paper trading. Do not for real trading
////////////////////////////////////////////////////////////
strategy(title="D_ELI (Ehlers Leading Indicator)", shorttitle="D_ELI (Ehlers Leading Indicator)")
Length = input(7, minval=1)
reverse = input(false, title="Trade reverse")
hline(0, color=red, linestyle=line)
xHL2 = request.security(syminfo.tickerid, 'D', hl2)
xEMA1 = ema(xHL2, Length)
xEMA2 = ema(xHL2, 2 * Length)
xEMA1_EMA2 = xEMA1 - xEMA2
xResultEMA = ema(xEMA1_EMA2, Length)
nRes = xEMA1_EMA2 - xResultEMA
pos = iff(nRes > 0, 1,
	     iff(nRes < 0, -1, nz(pos[1], 0)))
possig = iff(reverse and pos == 1, -1,
          iff(reverse and pos == -1, 1, pos))
if (possig == 1)
    strategy.entry("Long", strategy.long)
if (possig == -1)
    strategy.entry("Short", strategy.short)
barcolor(possig == -1 ? red: possig == 1 ? green : blue )
plot(request.security(syminfo.tickerid, "D", xEMA1_EMA2), color=blue, title="D_DSP")
plot(request.security(syminfo.tickerid, "D", nRes), color=green, title="D_ELI")