概述
双移动均线交叉策略通过计算不同周期的移动均线,判断价格趋势方向,实现趋势跟踪。当短周期均线上穿长周期均线时做多,当短周期均线下穿长周期均线时做空,属于典型的趋势跟踪策略。
策略原理
该策略基于9周期、21周期和50周期的指数移动均线(EMA)。其中,9周期EMA代表短期趋势,21周期EMA代表中期趋势,50周期EMA代表长期趋势。
当9周期EMA上穿21周期EMA时,表示短期趋势转为上升,做多;当9周期EMA下穿21周期EMA时,表示短期趋势转为下降,做空。这里using了交叉函数crossover()来判断均线的交叉情况。
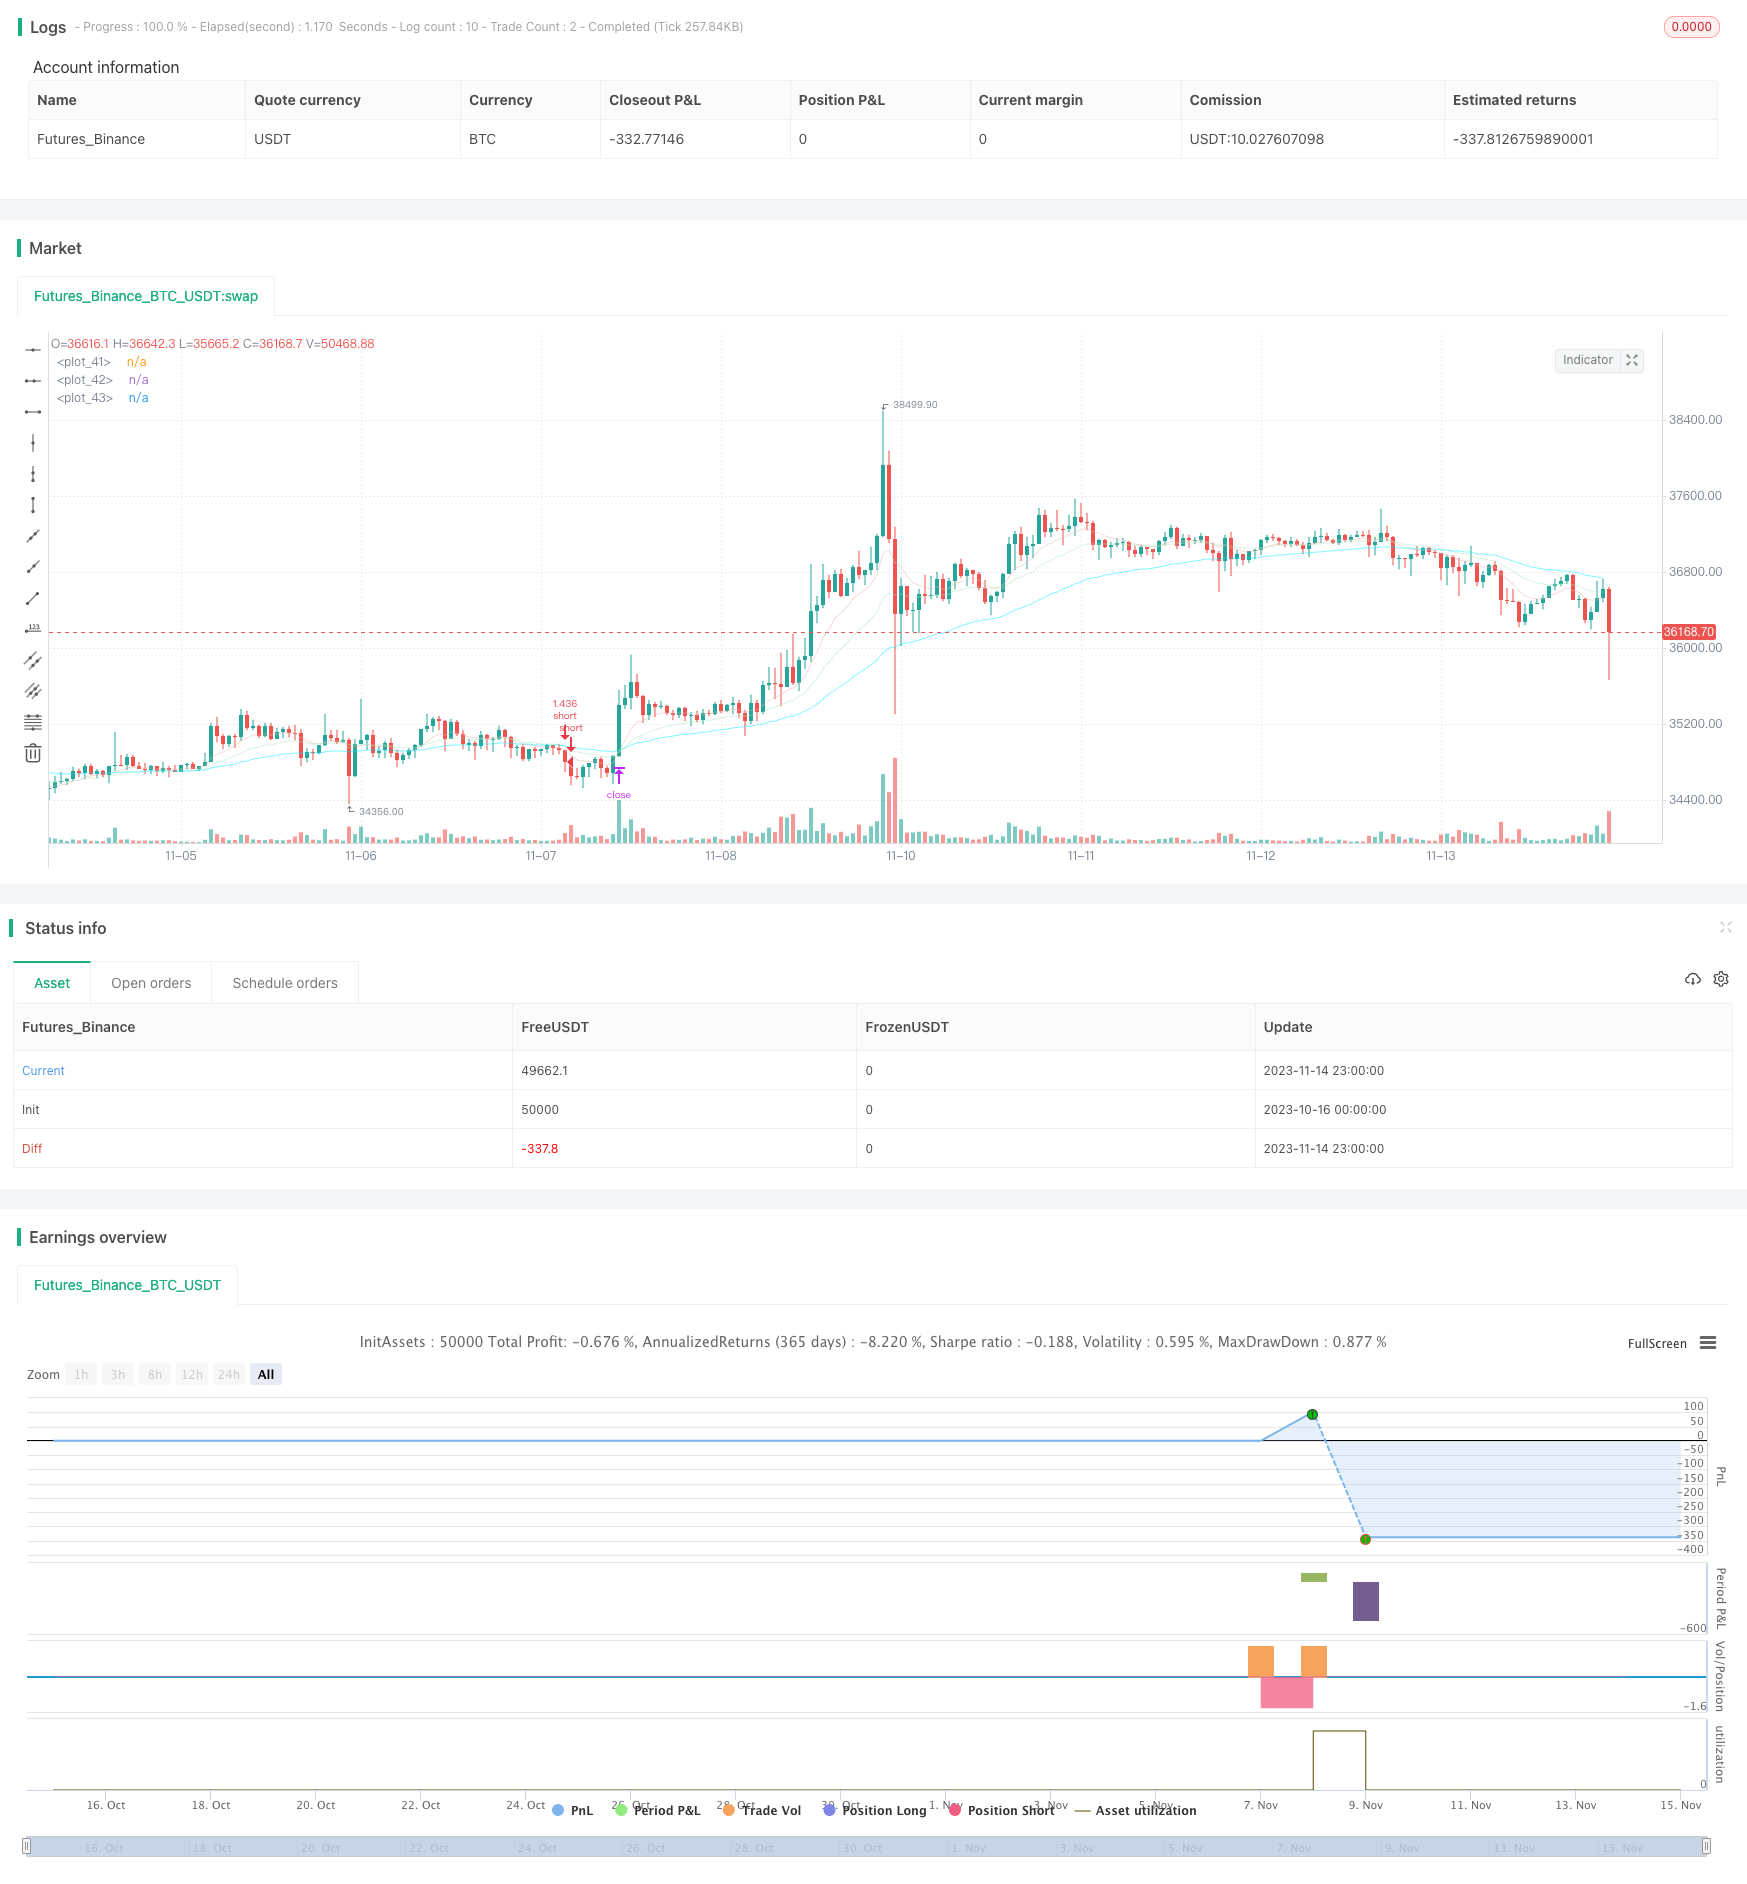
代码中设置了长仓和空仓的开仓、止盈、止损逻辑。开仓条件为均线上穿或下穿。多头止盈为进入价×(1+ 输入的止盈比例),空头止盈为进入价×(1- 输入的止盈比例)。多头止损为进入价×(1- 输入的止损比例),空头止损为进入价×(1+ 输入的止损比例)。
此外,代码还加入了一些过滤条件,如趋势性过滤,要求均线上下穿之前的K线不能震荡,以及资金利用率过滤,要求策略权益不能低于N天均线,避免亏损过多时仍然交易。这些过滤条件可以一定程度上避免虚假信号。
总的来说,该策略使用双EMA交叉来判断价格趋势方向,以及合理的止盈止损逻辑,可以捕捉中长线趋势。但作为单因素策略,其信号可能不够稳定,可进一步优化。
优势分析
- 使用双移动均线交叉判断趋势方向,原理简单,容易理解实现。
- 采用不同周期EMA,可以对长短期趋势进行判断。
- 设置止盈止损逻辑,可以锁定盈利,控制风险。
- 加入过滤条件,可以一定程度上过滤假信号。
- 可以自由设置参数,优化周期组合,适应不同市场环境。
风险分析
- 作为单因素策略,交易信号可能不够稳定。价格震荡时,可能出现多次无谓交易。
- EMA交叉时,价格可能已运行一段距离,存在追高杀跌风险。
- 未考虑交易成本,实盘时收益可能减少。
- 未设立止损,无法控制极端行情下的亏损。
应对方法: 1. 优化MA周期参数,使信号更稳定。 2. 结合其他指标过滤信号。 3. 加大交易数量,降低成本影响。 4. 设置止损点,限制最大损失。
优化方向
该策略可以从以下方面进行优化:
优化移动均线的周期参数,找到最佳周期组合。可以引入自适应优化技术,动态优选周期。
增加其他技术指标过滤信号,如MACD,KD等,提高信号质量。或引入机器学习对信号进行评分,自动过滤虚假信号。
结合交易量分析。如突破均线但交易量不足时,不采信信号。
在突破发生时,考察前期的波动情况,如在震荡区间突破,可能是假突破。
建立动态止损机制,如跟踪型止损、Chandelier Exit等,减小止损距离,但确保止损有效。
优化仓位管理,如固定仓位、动态仓位、杠杆仓位等,让盈亏比例更合理。
全面考虑交易成本,滑点影响。优化止盈止损比例,确保策略在实盘中依然盈利。
总结
本策略整体结构合理,原理简单,通过双EMA交叉判断趋势方向,并设置了止盈止损逻辑,可以捕捉趋势。但作为单因素策略,可进一步优化参数设定、信号过滤等,使策略更稳健。加入止损和仓位管理等机制后,可以进一步降低风险。整体来说,该策略提供了一个可靠的趋势跟踪策略框架,在优化调整后可以获得稳定的投资回报。
/*backtest
start: 2023-10-16 00:00:00
end: 2023-11-15 00:00:00
period: 1h
basePeriod: 15m
exchanges: [{"eid":"Futures_Binance","currency":"BTC_USDT"}]
*/

// This source code is subject to the terms of the Mozilla Public License 2.0 at https://mozilla.org/MPL/2.0/
// © TradingMentalist

//@version=4
strategy("Initial template",initial_capital=1000, overlay=true, pyramiding=0, commission_type=strategy.commission.percent, commission_value=0.04, default_qty_type = strategy.percent_of_equity, default_qty_value = 100, currency = currency.USD)

////////////////////////////////////////////////////////////////////////////////////////////////////////////////////////////////////////////////inputs
//turn on/off longs/shorts / extraneous conditions
longinc=input(true, title="include longs?")
lConSw2=input(true, title="condition two?")
lConSw3=input(true, title="condition three?")
shotinc=input(true, title="include shorts?")
sConSw2=input(true, title="condition two?")
sConSw3=input(true, title="condition three?")

//turn on/off / adjust trade filters (average range/average equity)
sidein2     = input(200, step=10, title='lookback for average range (bars)')
sidein      = input(1, title='filter trades if range is less than (%)')/100
equityIn    = input(40, title='filter trades if equity is below ema()')
sidewayssw  = input(true, title='sideways filter?')
equitysw    = input(true, title='equity filter?')
longtpin    = input(1,step=0.1, title='long TP %')/100
longslin    = input(0.4,step=0.1, title='long SL %')/100
shorttpin   = input(1,step=0.1, title='short TP %')/100
shortslin   = input(0.4,step=0.1, title='short SL %')/100

////////////////////////////////////////////////////////////////////////////////////////////////////////////////////////////////////////////////filters
//(leave as is)
side1       = (close[1] + close[sidein2]) / 2
side2       = close[1] - close[sidein2]
side3       = side2 / side1
notsideways = side3 > sidein
equityMa    = equitysw ? ema(strategy.equity, equityIn) : 0
equityCon   = strategy.equity >= equityMa

////////////////////////////////////////////////////////////////////////////////////////////////////////////////////////////////////////////////indicators
ma1 = ema(close, 9)
ma2 = ema(close, 21)
ma3 = ema(close, 50)

plot(ma1, color=color.new(#E8B6B0,50))
plot(ma2, color=color.new(#B0E8BE,50))
plot(ma3, color=color.new(#00EEFF,50))

////////////////////////////////////////////////////////////////////////////////////////////////////////////////////////////////////////////////conditions
//adjust conditions
//-------------------------------------------
longCondition1  = crossover(ma2,ma3)
longCondition2  = close[5] > close[10]
longCondition3  = close[1] > close[2]

shortCondition1 = crossover(ma3,ma2)
shortCondition2 = close[5] < close[10]
shortCondition3 = close[1] < close[2]

closelong       = shortCondition1
closeshort      = longCondition1
//-------------------------------------------

//(leave as is)
longCondition1in  = longCondition1
longCondition2in  = lConSw2 ? longCondition2 : true
longCondition3in  = lConSw3 ? longCondition3 : true
shortCondition1in = shortCondition1
shortCondition2in = sConSw2 ? shortCondition2: true
shortCondition3in = sConSw3 ? shortCondition3: true
longConditions    = longCondition1in and longCondition2in and longCondition3in
shortConditions   = shortCondition1in and shortCondition2in and shortCondition3in

////////////////////////////////////////////////////////////////////////////////////////////////////////////////////////////////////////////////execution
//(leave as is)
long            = sidewayssw ? notsideways and equityCon and longConditions : equityCon and longConditions
short           = sidewayssw ? notsideways and equityCon and shortConditions : equityCon and shortConditions

////////////////////////////////////////////////////////////////////////////////////////////////////////////////////////////////////////////////risk
//(leave as is)
longtplevel     = strategy.position_avg_price * (1 + longtpin)
longsllevel     = strategy.position_avg_price * (1 - longslin)
shorttplevel    = strategy.position_avg_price * (1 - shorttpin)
shortsllevel    = strategy.position_avg_price * (1 + shortslin)

///////////////////////////////////////////////////////////////////////////////////////////////////////////////////////////////////////////////timeframe
//adjust timeframe
//-------------------------------------------
startyear   = 2000
startmonth  = 1
startday    = 1

stopyear    = 9999
stopmonth   = 12
stopday     = 31
//-------------------------------------------

//(leave as is)
startperiod = timestamp(startyear,startmonth,startday,0,0)
periodstop  = timestamp(stopyear,stopmonth,stopday,0,0)
timeframe()    =>
    time >= startperiod and time <= periodstop ? true : false

////////////////////////////////////////////////////////////////////////////////////////////////////////////////////////////////////////////////orders
//comments are empty characters for clear chart
if timeframe()
    if longinc
        if strategy.position_size == 0 or strategy.position_size > 0
            strategy.entry(id="long", long=true, when=long, comment=" ")
            strategy.exit("stop","long", limit=longtplevel, stop=longsllevel,comment=" ")
            strategy.close(id="long", when=closelong, comment = " ")
    if shotinc
        if strategy.position_size == 0 or strategy.position_size < 0
            strategy.entry(id="short", long=false, when=short, comment = " ")
            strategy.exit("stop","short", limit=shorttplevel, stop=shortsllevel,comment = " ")
            strategy.close(id="short", when=closeshort, comment = " ")