概述
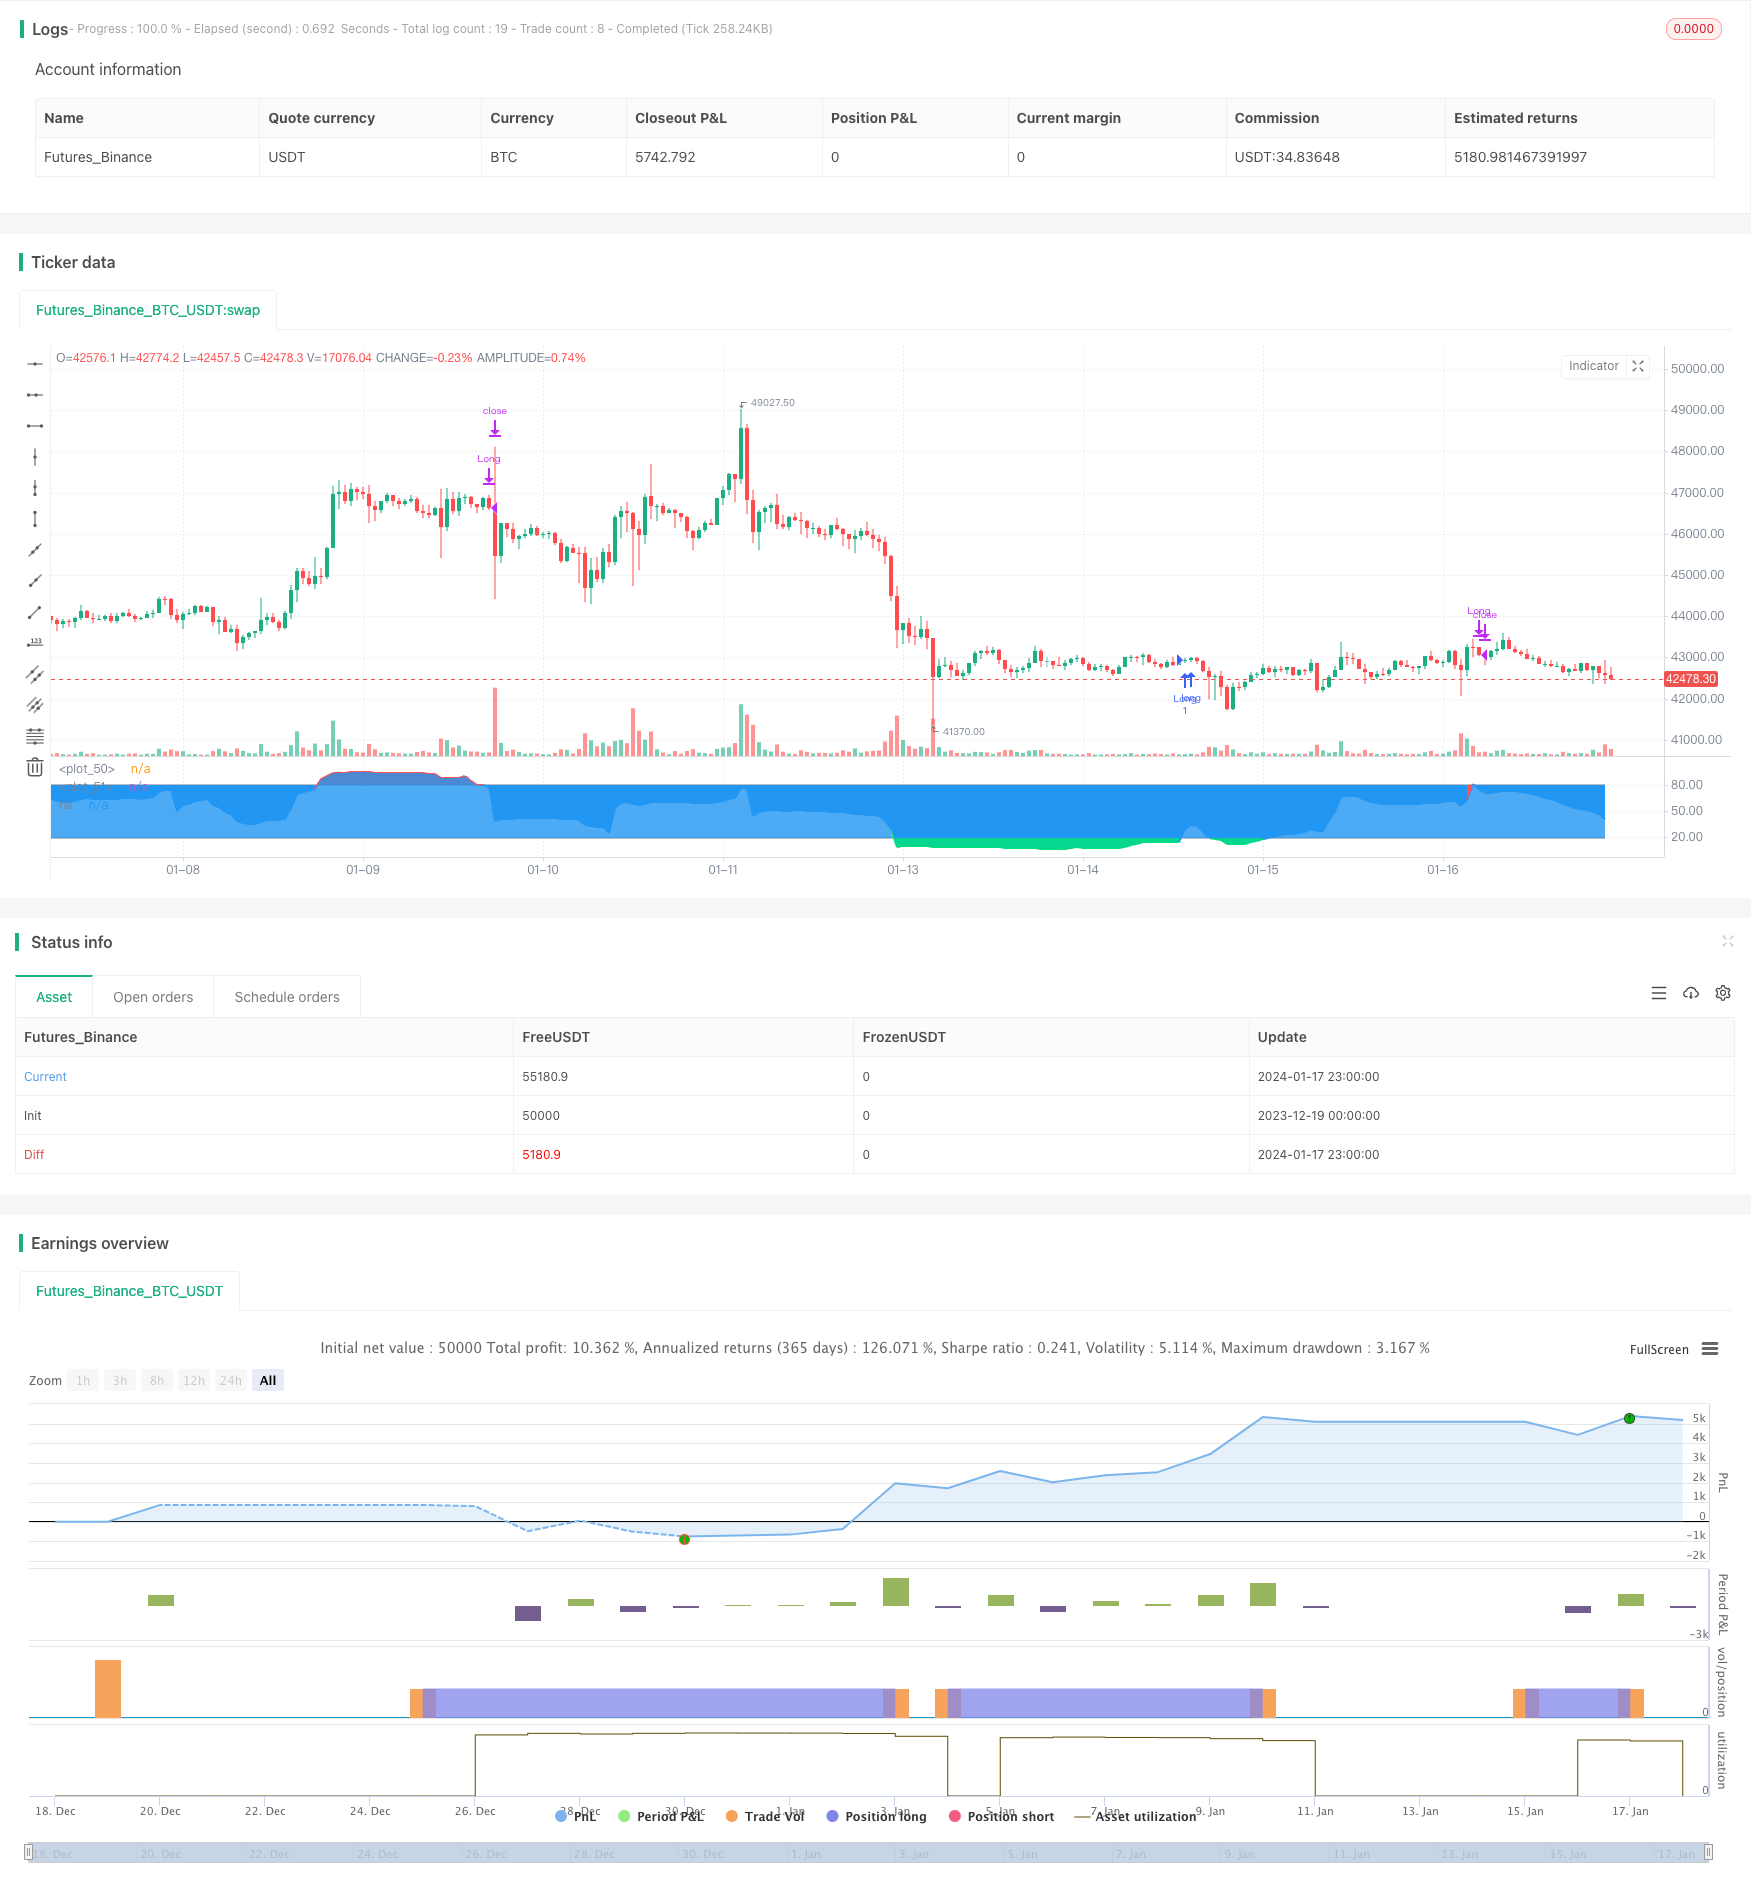
本策略命名为“RSI-VWAP短线策略”。该策略采用RSI指标和成交量加权平均价(VWAP)作为技术指标,设定多空头信号,进而产生买卖决策。策略追求在短线上捕捉市场的超买超卖现象,以期获得超额收益。
策略原理
- 使用RSI指标判断市场是否处于超买或超卖状态。RSI指标值高于80为超买区,低于20为超卖区。
- RSI指标使用VWAP而不是收盘价作为源数据。VWAP更能反映当日的平均成交价。
- 当RSI指标值从超卖区上穿20时产生买入信号。当RSI指标值从超买区下穿80时产生卖出信号。
- 本策略只做多头,不做空头。即只在超卖买入,超买卖出。
优势分析
- 使用VWAP作为RSI的数据源,使RSI指标对市场的判断更准确,避免被假突破误导。
- 只做多头,降低操作频率,有利于获得长期稳定收益。
- RSI指标参数为17,适合短线操作。
- 采用期望交易次数不高的短线操作方式,降低交易成本,有利于获得更高收益率。
风险分析
- 量化策略回测存在过拟合风险,实盘结果可能与回测不符。
- 只做多头无法及时抓住下跌行情的机会。
- 超买超卖判断标准可能不适合所有品种,需要针对不同品种调整参数。
- 任何技术指标都可能产生错误信号,无法完全避免亏损的发生。
可通过适当放宽超买超卖标准、结合其他指标确认信号、调整参数区间等方法降低风险。
优化方向
- 测试不同参数对策略效果的影响,优化RSI长度和超买超卖阈值。
- 增加止损策略,通过移动止损、时间止损等方式锁定部分盈利,降低回撤。
- 结合其他指标进行信号过滤,提高信号准确率。
- 根据不同品种特点设定独立的参数区间,使策略能更好适应不同品种。
总结
该策略总体而言是一个简单实用的短线策略。使用VWAP使RSI指标判断更准确,只做多头降低操作频率。策略思路清晰,易于理解和实现,适合量化交易的入门。但任何单一指标策略都难以完美,仍需不断优化使其产生更好的实盘效果。
策略源码
/*backtest
start: 2023-12-19 00:00:00
end: 2024-01-18 00:00:00
period: 1h
basePeriod: 15m
exchanges: [{"eid":"Futures_Binance","currency":"BTC_USDT"}]
*/

// This source code is subject to the terms of the Mozilla Public License 2.0 at https://mozilla.org/MPL/2.0/
// © Xaviz

//#####©ÉÉÉɶN###############################################
//####*..´´´´´´,,,»ëN########################################
//###ë..´´´´´´,,,,,,''%©#####################################
//###'´´´´´´,,,,,,,'''''?¶###################################
//##o´´´´´´,,,,,,,''''''''*©#################################
//##'´´´´´,,,,,,,'''''''^^^~±################################
//#±´´´´´,,,,,,,''''''''^í/;~*©####æ%;í»~~~~;==I±N###########
//#»´´´´,,,,,,'''''''''^;////;»¶X/í~~/~~~;=~~~~~~~~*¶########
//#'´´´,,,,,,''''''''^^;////;%I^~/~~/~~~=~~~;=?;~~~~;?ë######
//©´´,,,,,,,''''''''^^~/////X~/~~/~~/~~»í~~=~~~~~~~~~~^;É####
//¶´,,,,,,,''''''''^^^;///;%;~/~~;í~~»~í?~?~~~?I/~~~~?*=íÑ###
//N,,,,,,,'''''''^^^^^///;;o/~~;;~~;£=»í»;IX/=~~~~~~^^^^'*æ##
//#í,,,,,''''''''^^^^^;;;;;o~»~~~~íX//~/»~;í?IíI»~~^/*?'''=N#
//#%,,,'''''''''^^^^^^í;;;;£;~~~//»I»/£X/X/»í*&~~~^^^^'^*~'É#
//#©,,''''''''^^^^^^^^~;;;;&/~/////*X;í;o*í»~=*?*===^'''''*£#
//##&''''''''^^^^^^^^^^~;;;;X=í~~~»;;;/~;í»~»±;^^^^^';=''''É#
//##N^''''''^^^^^^^^^^~~~;;;;/£;~~/»~~»~~///o~~^^^^''''?^',æ#
//###Ñ''''^^^^^^^^^^^~~~~~;;;;;í*X*í»;~~IX?~~^^^^/?'''''=,=##
//####X'''^^^^^^^^^^~~~~~~~~;;íííííí~~í*=~~~~Ií^'''=''''^»©##
//#####£^^^^^^^^^^^~~~~~~~~~~~íííííí~~~~~*~^^^;/''''='',,N###
//######æ~^^^^^^^^~~~~~~~~~~~~~~íííí~~~~~^*^^^'=''''?',,§####
//########&^^^^^^~~~~~~~~~~~~~~~~~~~~~~~^^=^^''=''''?,íN#####
//#########N?^^~~~~~~~~~~~~~~~~~~~~~~~~^^^=^''^?''';í@#######
//###########N*~~~~~~~~~~~~~~~~~~~~~~~^^^*'''^='''/É#########
//##############@;~~~~~~~~~~~~~~~~~~~^^~='''~?'';É###########
//#################É=~~~~~~~~~~~~~~^^^*~'''*~?§##############
//#####################N§£I/~~~~~~»*?~»o§æN##################

//@version=4
strategy("RSI-VWAP INDICATOR", overlay=false)

// ================================================================================================================================================================================
// RSI VWAP INDICATOR
// ================================================================================================================================================================================

// Initial inputs
Act_RSI_VWAP = input(true, "RSI VOLUME WEIGHTED AVERAGE PRICE")
RSI_VWAP_length = input(17, "RSI-VWAP LENGTH")
RSI_VWAP_overSold = input(19, "RSI-VWAP OVERSOLD", type=input.float)
RSI_VWAP_overBought = input(80, "RSI-VWAP OVERBOUGHT", type=input.float)

// RSI with VWAP as source
RSI_VWAP = rsi(vwap(close), RSI_VWAP_length)

// Plotting, overlay=false
r=plot(RSI_VWAP, color = RSI_VWAP > RSI_VWAP_overBought ? color.red : RSI_VWAP < RSI_VWAP_overSold ? color.lime : color.blue, title="rsi", linewidth=2, style=plot.style_line)
h1=plot(RSI_VWAP_overBought, color = color.gray, style=plot.style_stepline)
h2=plot(RSI_VWAP_overSold, color = color.gray, style=plot.style_stepline)
fill(r,h1, color = RSI_VWAP > RSI_VWAP_overBought ? color.red : na, transp = 60)
fill(r,h2, color = RSI_VWAP < RSI_VWAP_overSold ? color.lime : na, transp = 60)

// Long only Backtest
strategy.entry("Long", strategy.long, when = (crossover(RSI_VWAP, RSI_VWAP_overSold)))
strategy.close("Long", when = (crossunder(RSI_VWAP, RSI_VWAP_overBought)))