概述
EMA跟踪策略是一种利用EMA指标进行跟踪的趋势策略。该策略通过计算价格的EMA值,并结合设置的比例带,来判断价格趋势并产生交易信号。
策略原理
该策略的核心指标是EMA。EMA代表指数移动平均线,是一种趋势跟踪指标。EMA根据历史价格及设置的时间周期,计算出当前的平均价格。EMA还具有平滑价格的作用。
该策略首先计算出价格的50周期EMA值,作为主要的判断指标。然后根据EMA值的一定比例,设置上轨和下轨。这里设置为EMA值的正负0.3%。当价格上扫EMA轨时产生买入信号;当价格下破EMA轨时产生卖出信号。这样可以跟踪EMA周期内的价格趋势变化。
优势分析
- 使用EMA指标判断趋势,可避免价格震荡的干扰
- EMA平滑价格,将随机波动转为清晰趋势,利于判断
- 设置EMA上下轨,形成范围带,可减少错误信号
- 策略思路清晰易理解,参数调整也较为简单
风险分析
- EMA指标存在滞后,在趋势转折点时信号较晚
- 固定比例的上下轨容易在震荡阶段产生错误信号
- 回测数据拟合风险,实盘价格震荡可能更大
- 没有止损设置,无法控制损失
优化方向
- 增加参数优化,寻找最佳参数组合
- 添加止损机制,控制策略最大回撤
- 优化上下轨的计算方式,降低错误信号率
- 增加条件过滤,避免震荡行情的误入场
- 结合其他指标确认,提高策略稳定性
总结
EMA跟踪策略整体思路清晰,通过EMA指标判断价格趋势,并设置范围带产生交易信号。优点是规则简单易于理解,可避免部分噪音。但也存在参数调整空间有限,信号滞后,回撤控制差等问题。下一步可通过多指标结合、止损优化等手段进行改进,使策略更实用稳定。
策略源码
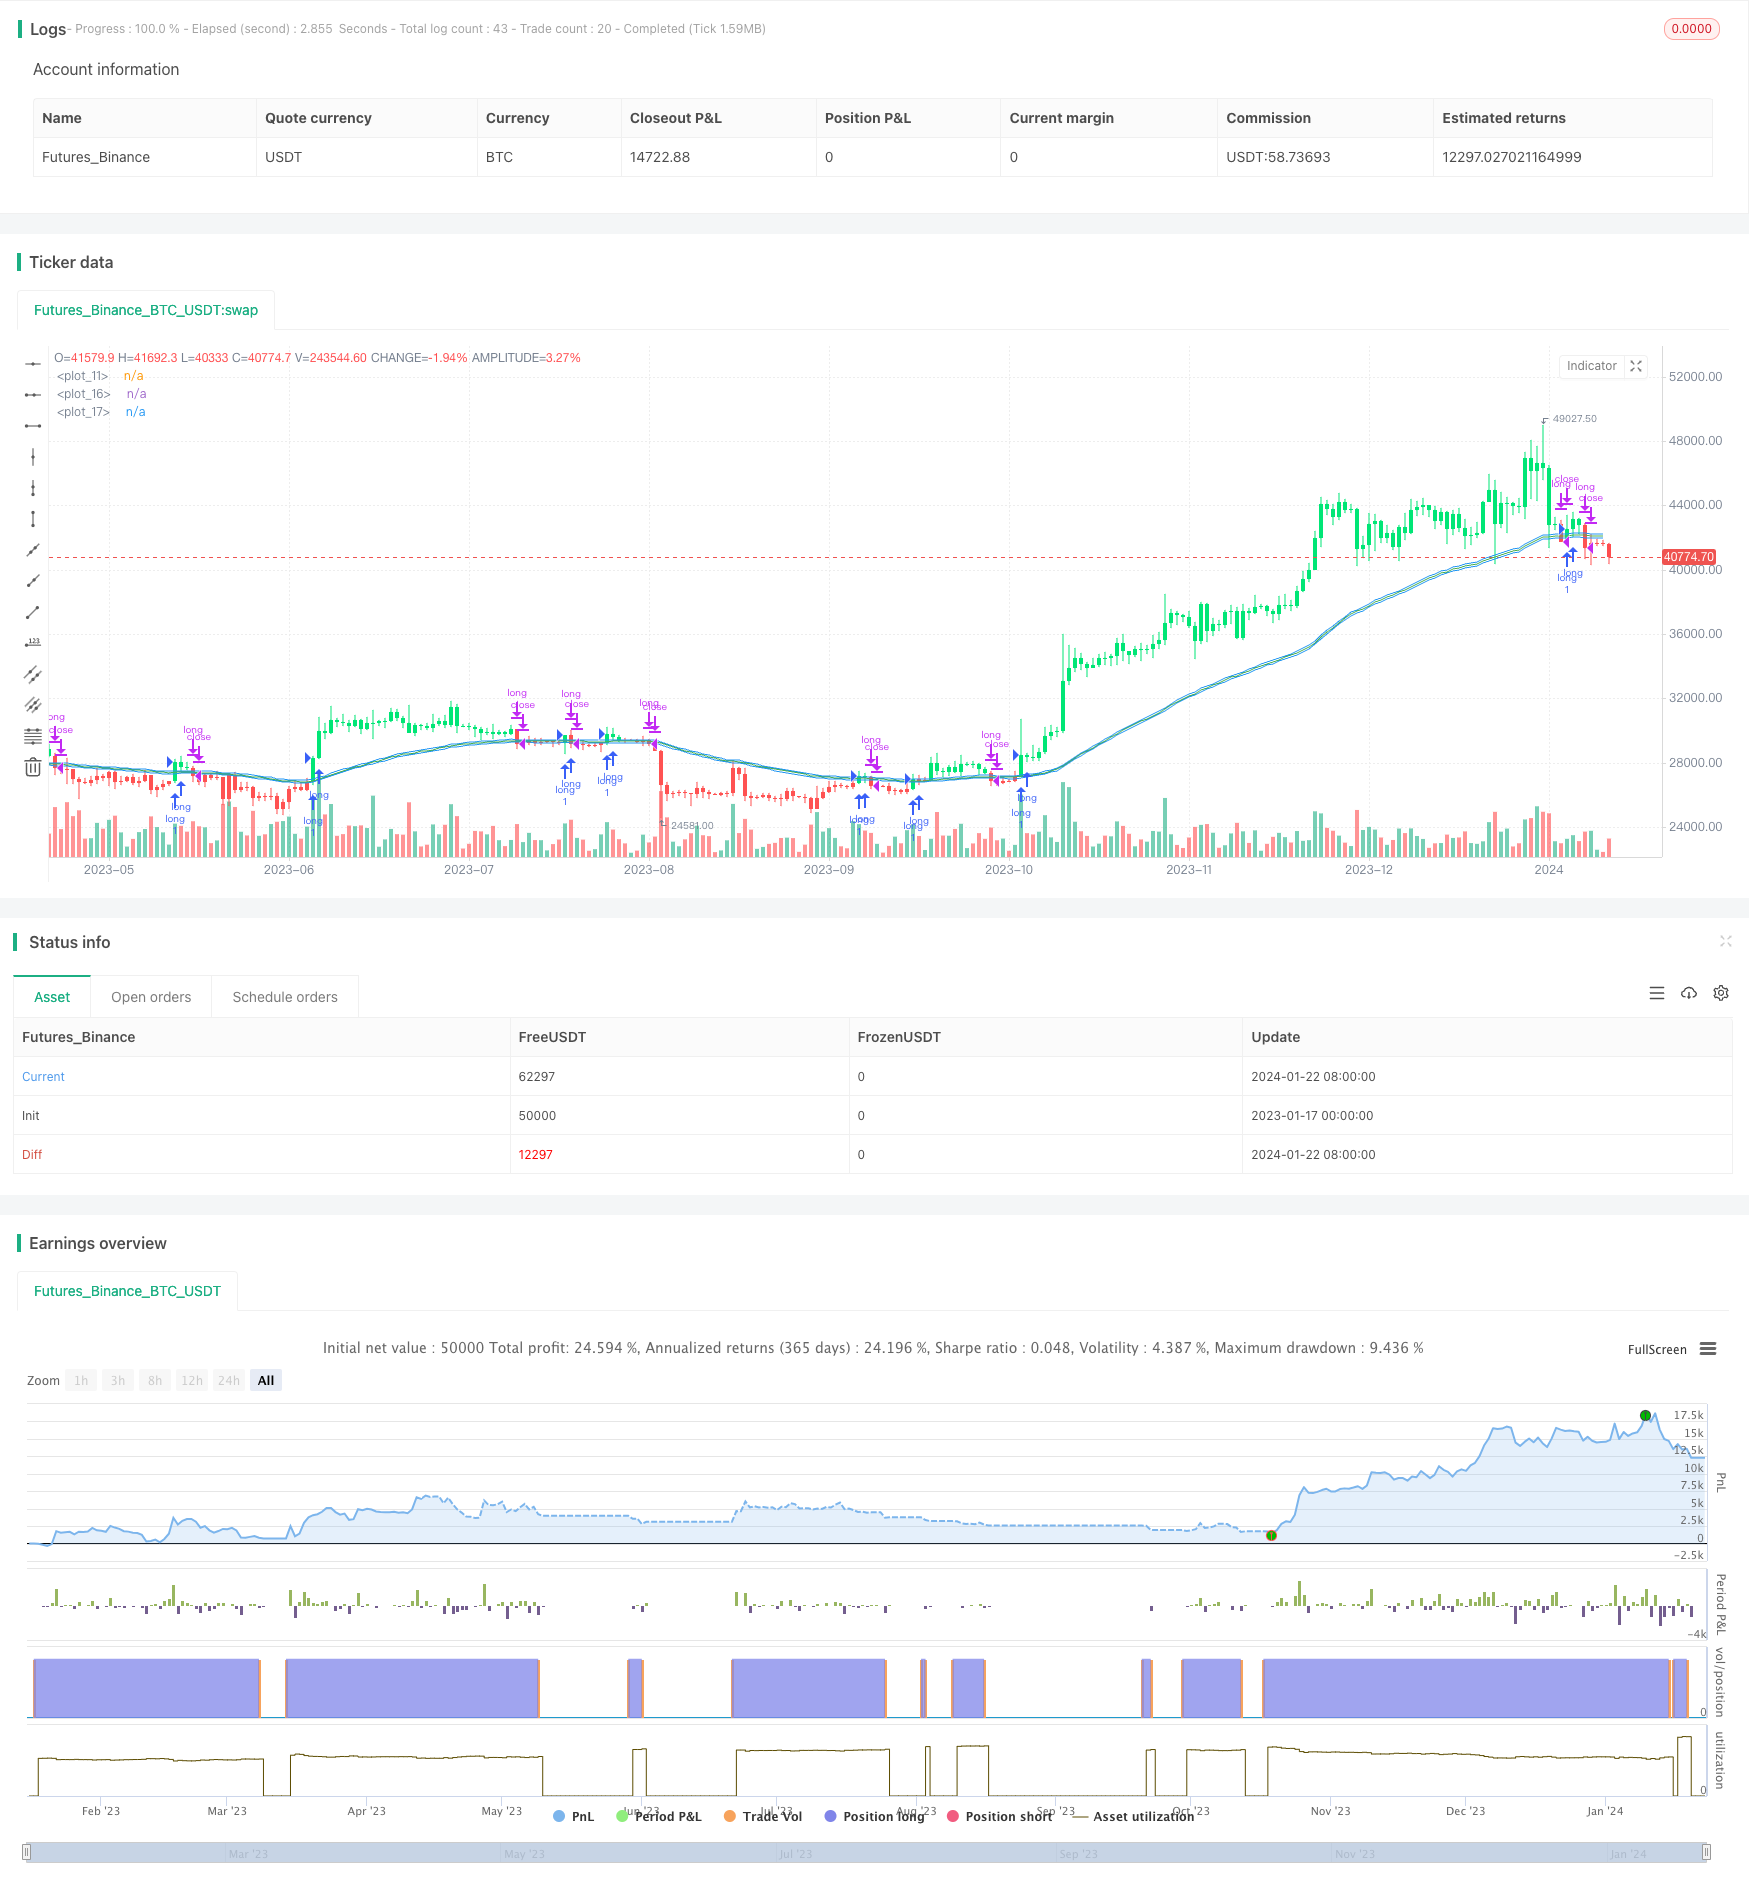
/*backtest
start: 2023-01-17 00:00:00
end: 2024-01-23 00:00:00
period: 1d
basePeriod: 1h
exchanges: [{"eid":"Futures_Binance","currency":"BTC_USDT"}]
*/

//@version=3
strategy(title="PingEMA50V.3 Piw", shorttitle="EMA50 Piw", overlay=true)

// input
src = input(title="Data Array",defval=close)
ema_period = input(title="EMA period", defval=50)
percent = input(title="Band %", type=float,defval=0.003)

// ema
ema50 = ema(src, ema_period)
plot(ema50, color=green)

// upper lower
upper = ema50 + (ema50*percent)
lower = ema50 - (ema50*percent)
plot(upper, color=blue)
plot(lower, color=blue)

// signal
buy = src > upper
sell = src < lower

// bar color
bcolor = buy ? lime : red
barcolor(color=bcolor)

// trade
if (buy)
    strategy.entry("long", strategy.long)
if (sell)
    strategy.close("long")