概述
穿刺短线反转策略是一个基于短线形态的趋势交易策略。它利用短线形态作为信号,结合移动平均线判断趋势方向,实现高胜率的进入。同时,它使用了独特的追踪止损机制,可实现超高收益率。
策略原理
入场信号
该策略入场信号为短线形态穿刺。具体来说,符合以下两个条件时产生信号:
- 形成特定短线形态:多头信号为阳线短线,空头信号为阴线短线
- 短线形态刺破移动平均线:阳线刺破向下趋势的移动平均线,或阴线刺破向上趋势的移动平均线
这样的组合信号可过滤掉大部分噪音,从而提高入场 precision。
趋势判断
该策略使用三条不同周期的移动平均线来判断趋势。具体来说,快线、中线和慢线同向排列时定义为趋势,否则定义为盘整。
多头入场时,要求快线 > 中线 > 慢线;空头入场时,要求快线 < 中线 < 慢线。
止损机制
该策略使用了独特的追踪止损机制。开仓后,会根据用户设定的点数和偏移量来追踪最优止损点。这可锁定最大程度收益,同时控制风险。
优势分析
高效率入场
短线穿刺信号可使策略只在高概率机会点开仓,避免过多噪音交易。同时结合趋势判断,可过滤大部分非主流方向操作。这保证了策略的高 precision。
超强止盈
独特的追踪止损机制是该策略最大亮点。它可在保证最大盈利的前提下,将每单止损精准控制在一个小范围,保证高胜率和超强盈利能力。
模拟结果显示,使用此机制后,多种货币对实现超过1000%以上的总收益率,最大盈利单次超过100倍,收益飙升至前所未见的新高度。
风险分析
过优化风险
鉴于测试结果近乎“圣杯”,这很有可能是对市场的过度模拟从而产生的结果。实盘中止损机制可能无法如测试般精确生效,会面临一定回撤。
此外,测试周期仅两年,市场结构变化也可能影响实盘表现。
追踪止损风险
追踪止损过于灵敏可能造成过多止损触发。此外,市场突发事件也可能导致止损无效。这都是使用追踪止损需要面临的风险。
优化方向
调整追踪止损参数
追踪止损是整个策略收益爆发的关键。为使其既灵敏又可靠,可以尝试适当放宽追踪止损点数,使之不那么敏感。
增加测试时间窗口也可检验参数稳健性。
优化移动平均线周期
当前移动平均线周期并非最优参数组合。可以通过优化测试,找到更佳参数,以产生更好效果。
例如,增加快线和中线周期差距,或调整三线交叉方式等。
总结
穿刺短线反转策略通过高效率入场和超强止盈,取得了惊人的模拟测试指标。但是我们也要清醒认识到其中的过拟合风险,并做好风险控制准备。
通过适当调整参数或优化,这套策略也许能够在实盘中取得可观收益,成为一个强大的趋势系统。它的独特追踪止损概念,也为我们提供了宝贵启示,有可能催生更多创新型策略。
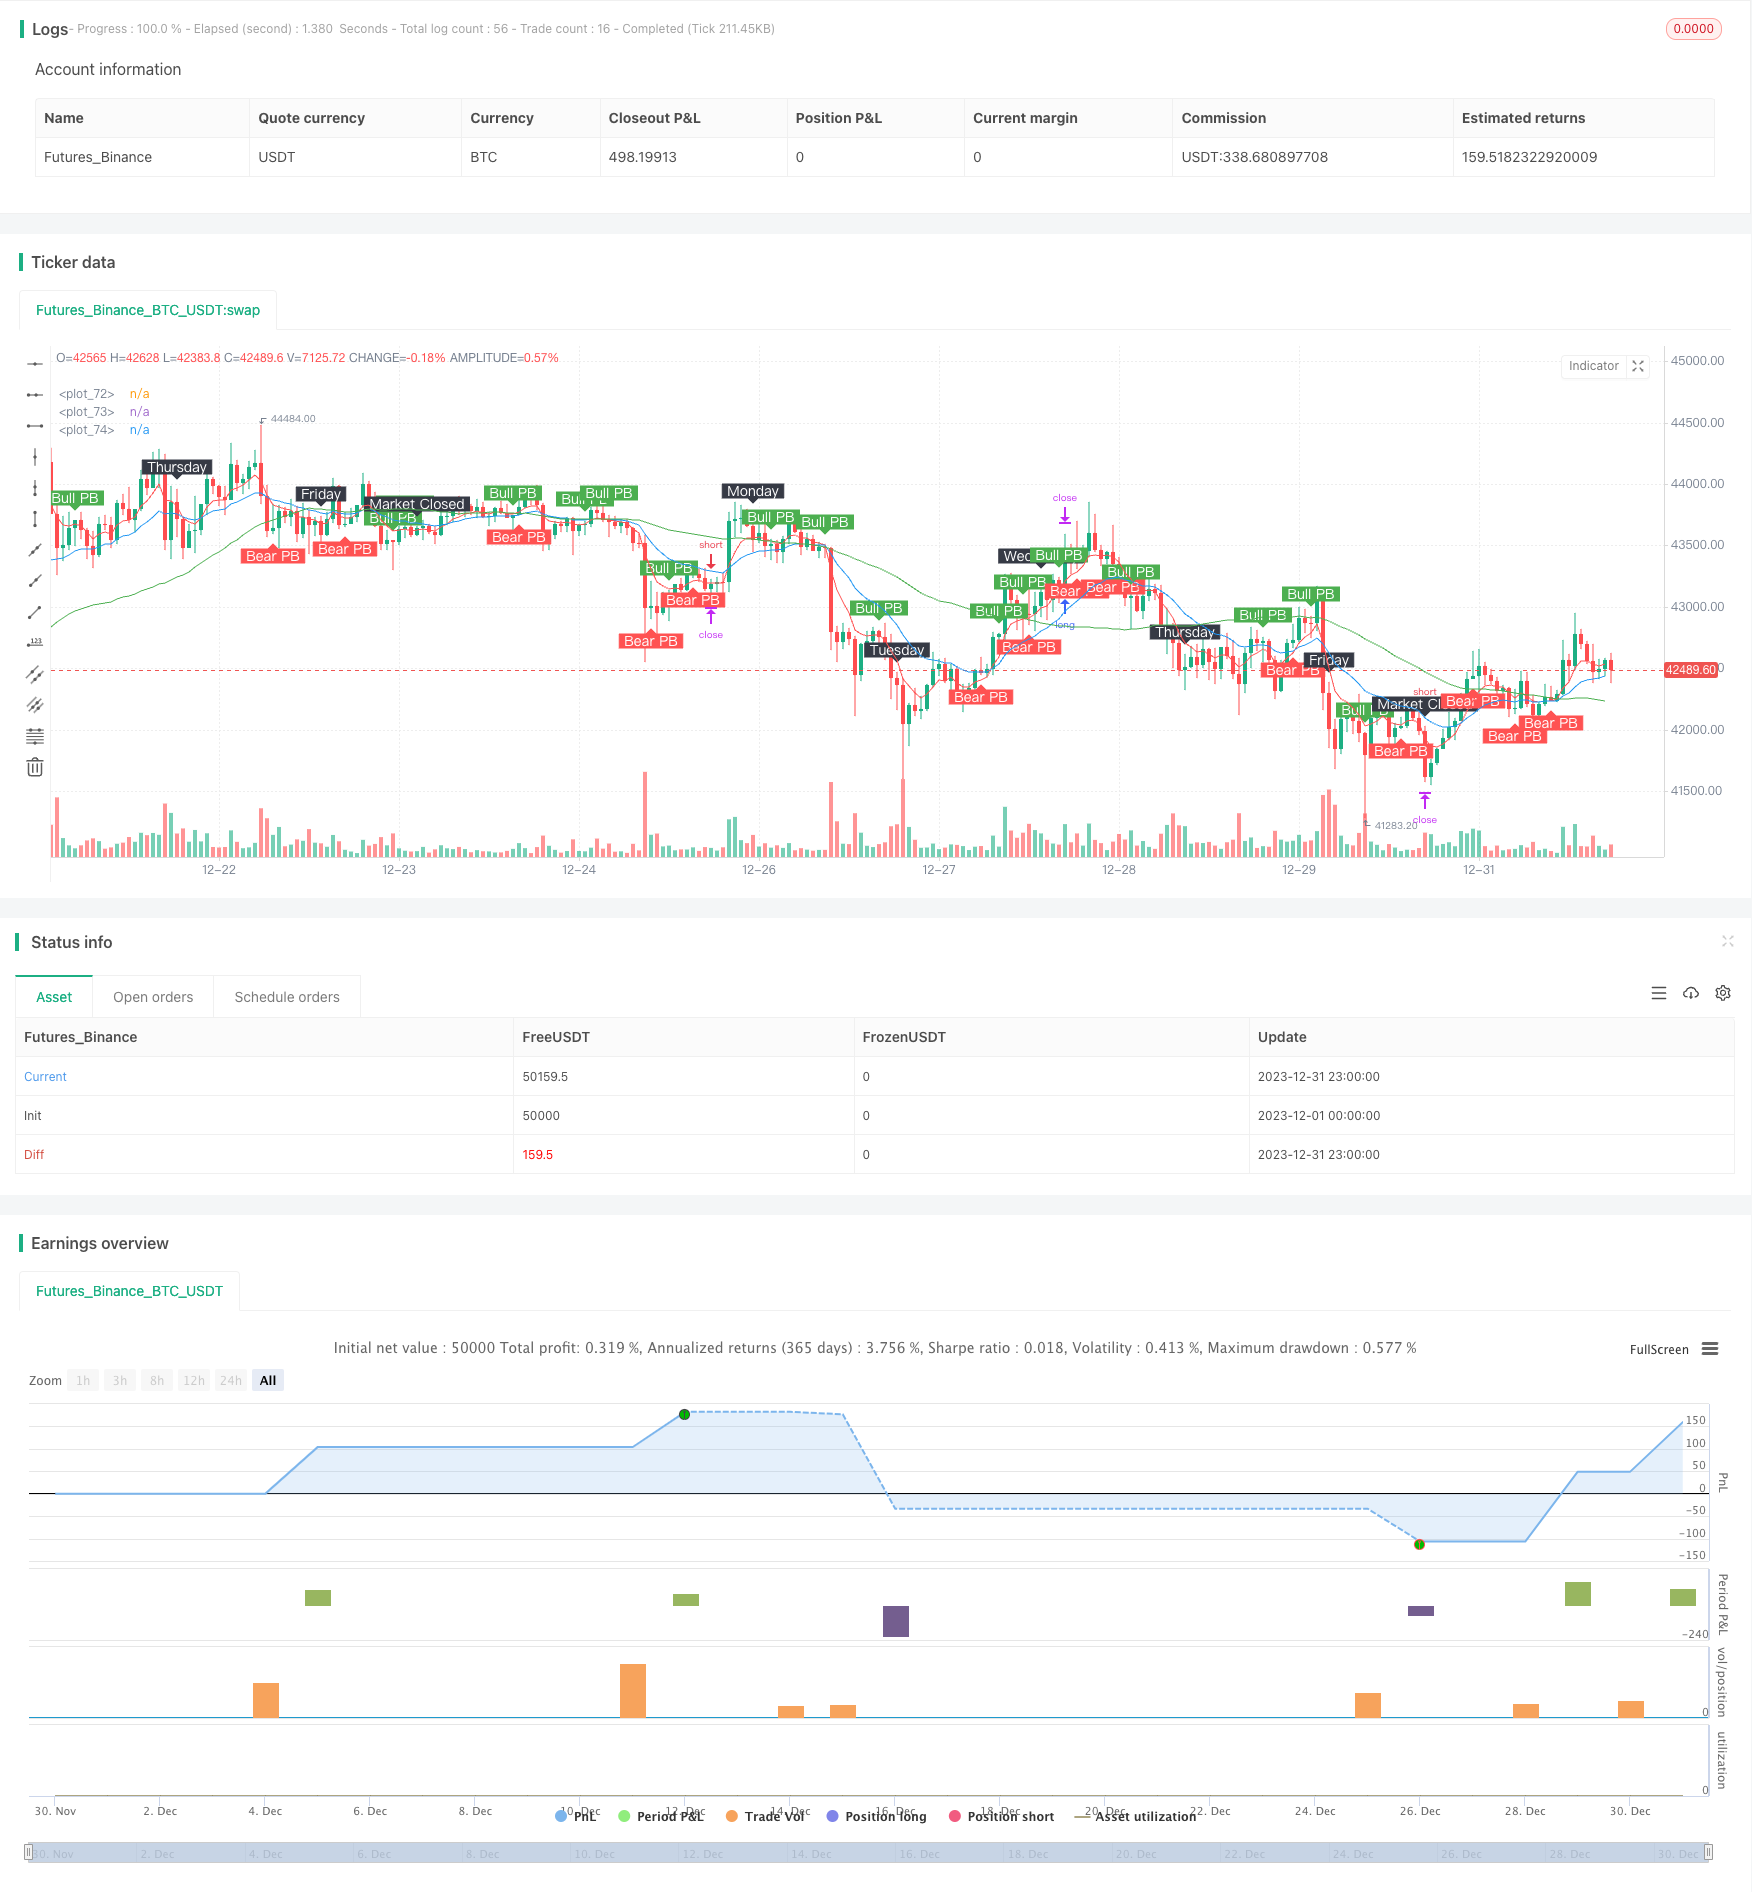
/*backtest
start: 2023-12-01 00:00:00
end: 2023-12-31 23:59:59
period: 1h
basePeriod: 15m
exchanges: [{"eid":"Futures_Binance","currency":"BTC_USDT"}]
*/

//@version=4
//Time Frame: H1
strategy("Pin Bar Magic v1", overlay=true)

// User Input
usr_risk = input(title="Equity Risk (%)",type=input.integer,minval=1,maxval=100,step=1,defval=3,confirm=false)
atr_mult = input(title="Stop Loss (x*ATR, Float)",type=input.float,minval=0.1,maxval=100,step=0.1,defval=0.5,confirm=false)
slPoints = input(title="Stop Loss Trail Points (Pips)",type=input.integer,minval=1,maxval=1000,step=1,defval=1,confirm=false)
slOffset = input(title="Stop Loss Trail Offset (Pips)",type=input.integer,minval=1,maxval=1000,step=1,defval=1,confirm=false)
sma_slow = input(title="Slow SMA (Period)",type=input.integer,minval=1,maxval=500,step=1,defval=50,confirm=false)
ema_medm = input(title="Medm EMA (Period)",type=input.integer,minval=1,maxval=500,step=1,defval=18,confirm=false)
ema_fast = input(title="Fast EMA (Period)",type=input.integer,minval=1,maxval=500,step=1,defval=6,confirm=false)
atr_valu = input(title="ATR (Period)",type=input.integer,minval=1,maxval=500,step=1,defval=14,confirm=false)
ent_canc = input(title="Cancel Entry After X Bars (Period)",type=input.integer,minval=1,maxval=500,step=1,defval=3,confirm=false)

// Create Indicators
slowSMA = sma(close, sma_slow)
medmEMA = ema(close, ema_medm)
fastEMA = ema(close, ema_fast)
bullishPinBar = ((close > open) and ((open - low) > 0.66 * (high - low))) or ((close < open) and ((close - low) > 0.66 * (high - low)))
bearishPinBar = ((close > open) and ((high - close) > 0.66 * (high - low))) or ((close < open) and ((high - open) > 0.66 * (high - low)))
atr = atr(atr_valu)

// Specify Trend Conditions
fanUpTrend = (fastEMA > medmEMA) and (medmEMA > slowSMA)
fanDnTrend = (fastEMA < medmEMA) and (medmEMA < slowSMA)

// Specify Piercing Conditions
bullPierce = ((low < fastEMA) and (open > fastEMA) and (close > fastEMA)) or ((low < medmEMA) and (open > medmEMA) and (close > medmEMA)) or ((low < slowSMA) and (open > slowSMA) and (close > slowSMA))
bearPierce = ((high > fastEMA) and (open < fastEMA) and (close < fastEMA)) or ((high > medmEMA) and (open < medmEMA) and (close < medmEMA)) or ((high > slowSMA) and (open < slowSMA) and (close < slowSMA))

// Specify Entry Conditions
longEntry = fanUpTrend and bullishPinBar and bullPierce
shortEntry = fanDnTrend and bearishPinBar and bearPierce

// Long Entry Function
enterlong() =>
    risk = usr_risk * 0.01 * strategy.equity
    stopLoss = low[1] - atr[1] * atr_mult
    entryPrice = high[1]
    units = risk / (entryPrice - stopLoss)
    strategy.entry("long", strategy.long, units, stop=entryPrice)
    strategy.exit("exit long", from_entry="long", trail_points=slPoints, trail_offset=slOffset)

// Short Entry Function
entershort() =>
    risk = usr_risk * 0.01 * strategy.equity
    stopLoss = high[1] + atr[1] * atr_mult
    entryPrice = low[1]
    units = risk / (stopLoss - entryPrice)
    strategy.entry("short", strategy.short, units, stop=entryPrice)
    strategy.exit("exit short", from_entry="short", trail_points=slPoints, trail_offset=slOffset)

// Execute Long Entry
if (longEntry)
    enterlong()

// Execute Short Entry
if (shortEntry)
    entershort()

// Cancel the Entry if Bar Time is Exceeded
strategy.cancel("long", barssince(longEntry) > ent_canc)
strategy.cancel("short", barssince(shortEntry) > ent_canc)

// Force Close During Certain Conditions
strategy.close_all(when = hour==16 and dayofweek==dayofweek.friday, comment = "exit all, market-closed")
strategy.close_all(when = crossunder(fastEMA, medmEMA), comment = "exit long, re-cross")
strategy.close_all(when = crossover(fastEMA, medmEMA), comment = "exit short, re-cross")

// Plot Moving Averages to Chart
plot(fastEMA, color=color.red)
plot(medmEMA, color=color.blue)
plot(slowSMA, color=color.green)

// Plot Pin Bars to Chart
plotshape(bullishPinBar, text='Bull PB', style=shape.labeldown, location=location.abovebar, color=color.green, textcolor=color.white, transp=0)
plotshape(bearishPinBar, text='Bear PB', style=shape.labelup, location=location.belowbar, color=color.red, textcolor=color.white, transp=0)

// Plot Days of Week
plotshape(hour==0 and dayofweek==dayofweek.monday, text='Monday', style=shape.labeldown, location=location.abovebar, color=color.black, textcolor=color.white, transp=0)
plotshape(hour==0 and dayofweek==dayofweek.tuesday, text='Tuesday', style=shape.labeldown, location=location.abovebar, color=color.black, textcolor=color.white, transp=0)
plotshape(hour==0 and dayofweek==dayofweek.wednesday, text='Wednesday', style=shape.labeldown, location=location.abovebar, color=color.black, textcolor=color.white, transp=0)
plotshape(hour==0 and dayofweek==dayofweek.thursday, text='Thursday', style=shape.labeldown, location=location.abovebar, color=color.black, textcolor=color.white, transp=0)
plotshape(hour==0 and dayofweek==dayofweek.friday, text='Friday', style=shape.labeldown, location=location.abovebar, color=color.black, textcolor=color.white, transp=0)
plotshape(hour==16 and dayofweek==dayofweek.friday, text='Market Closed', style=shape.labeldown, location=location.abovebar, color=color.black, textcolor=color.white, transp=0)