概述
该策略基于MACD指标的Histogram进行交易决策。它利用Histogram的上升趋势和下降趋势来产生买入和卖出信号。当Histogram连续上升或下降达到一定周期后,产生相应的信号。
策略原理
该策略使用MACD指标的快线、慢线和Histogram。首先计算快线EMA和慢线EMA。然后快线减去慢线得到MACD,MACD再减去其移动平均线Signal得到Histogram。
当Histogram连续上升趋势达到设定的周期后,产生买入信号。这表示MACD正在加速向上突破其信号线,预测价格可能上涨。
当Histogram连续下降趋势达到设定的周期后,产生卖出信号。这表示MACD正在加速向下跌破其信号线,预测价格可能下跌。
优势分析
该策略具有以下优势:
利用MACD Histogram的趋势性,能抓住价格变化的转折点,增强获利概率。
结合Histogram连续上升或下降的周期条件,可以过滤掉部分噪音交易,减少不必要的损失。
允许自定义MACD参数和Histogram趋势周期,可以调整来适应不同品种和交易时段。
策略逻辑简单清晰,容易理解和修改,也方便与其他指标或策略组合使用。
风险分析
该策略也存在一些风险:
当价格处于震荡区间时,可能产生错误信号,需要结合趋势指标等过滤。
Histogram上升或下降后,MACD线可能无法突破信号线,无法获利退出,需要设置止损来控制风险。
未考虑交易成本和滑点等实际交易问题,实盘时收益可能会减少。
参数设置(如MACD周期、Histogram趋势周期等)不当可能导致策略效果变差,需要针对品种和时段优化。
可以通过与趋势指标组合、设置止损机制、优化参数等方法来控制和减少这些风险。
优化方向
该策略可以从以下几个方向进行优化:
结合其他指标判断大致趋势方向,避免交易震荡区间。例如20日线判断中长线趋势等。
增加止损机制。例如MACD重新跌破信号线时止损。
优化MACD参数,适应不同周期的品种。例如对高频数据可以缩短周期参数。
优化Histogram连续上升或下降的最小周期数,平衡信号频繁程度与可靠性。
尝试Breakout失败后追踪信号的策略逻辑。即 Histogram反转后再追踪反向信号。
与其他指标组合,例如量能指标、波动率指标等判断市场热度,过滤信号。
总结
该MACD Histogram Trend策略通过捕捉Histogram趋势变化,实现 对价格变化转折点的判断。结合参数优化和组合指标判断,可以有效滤掉错误信号。MACD Histogram作为一个量化交易中非常重要的辅助判断工具,该策略提供了一种简单实用的交易思路。
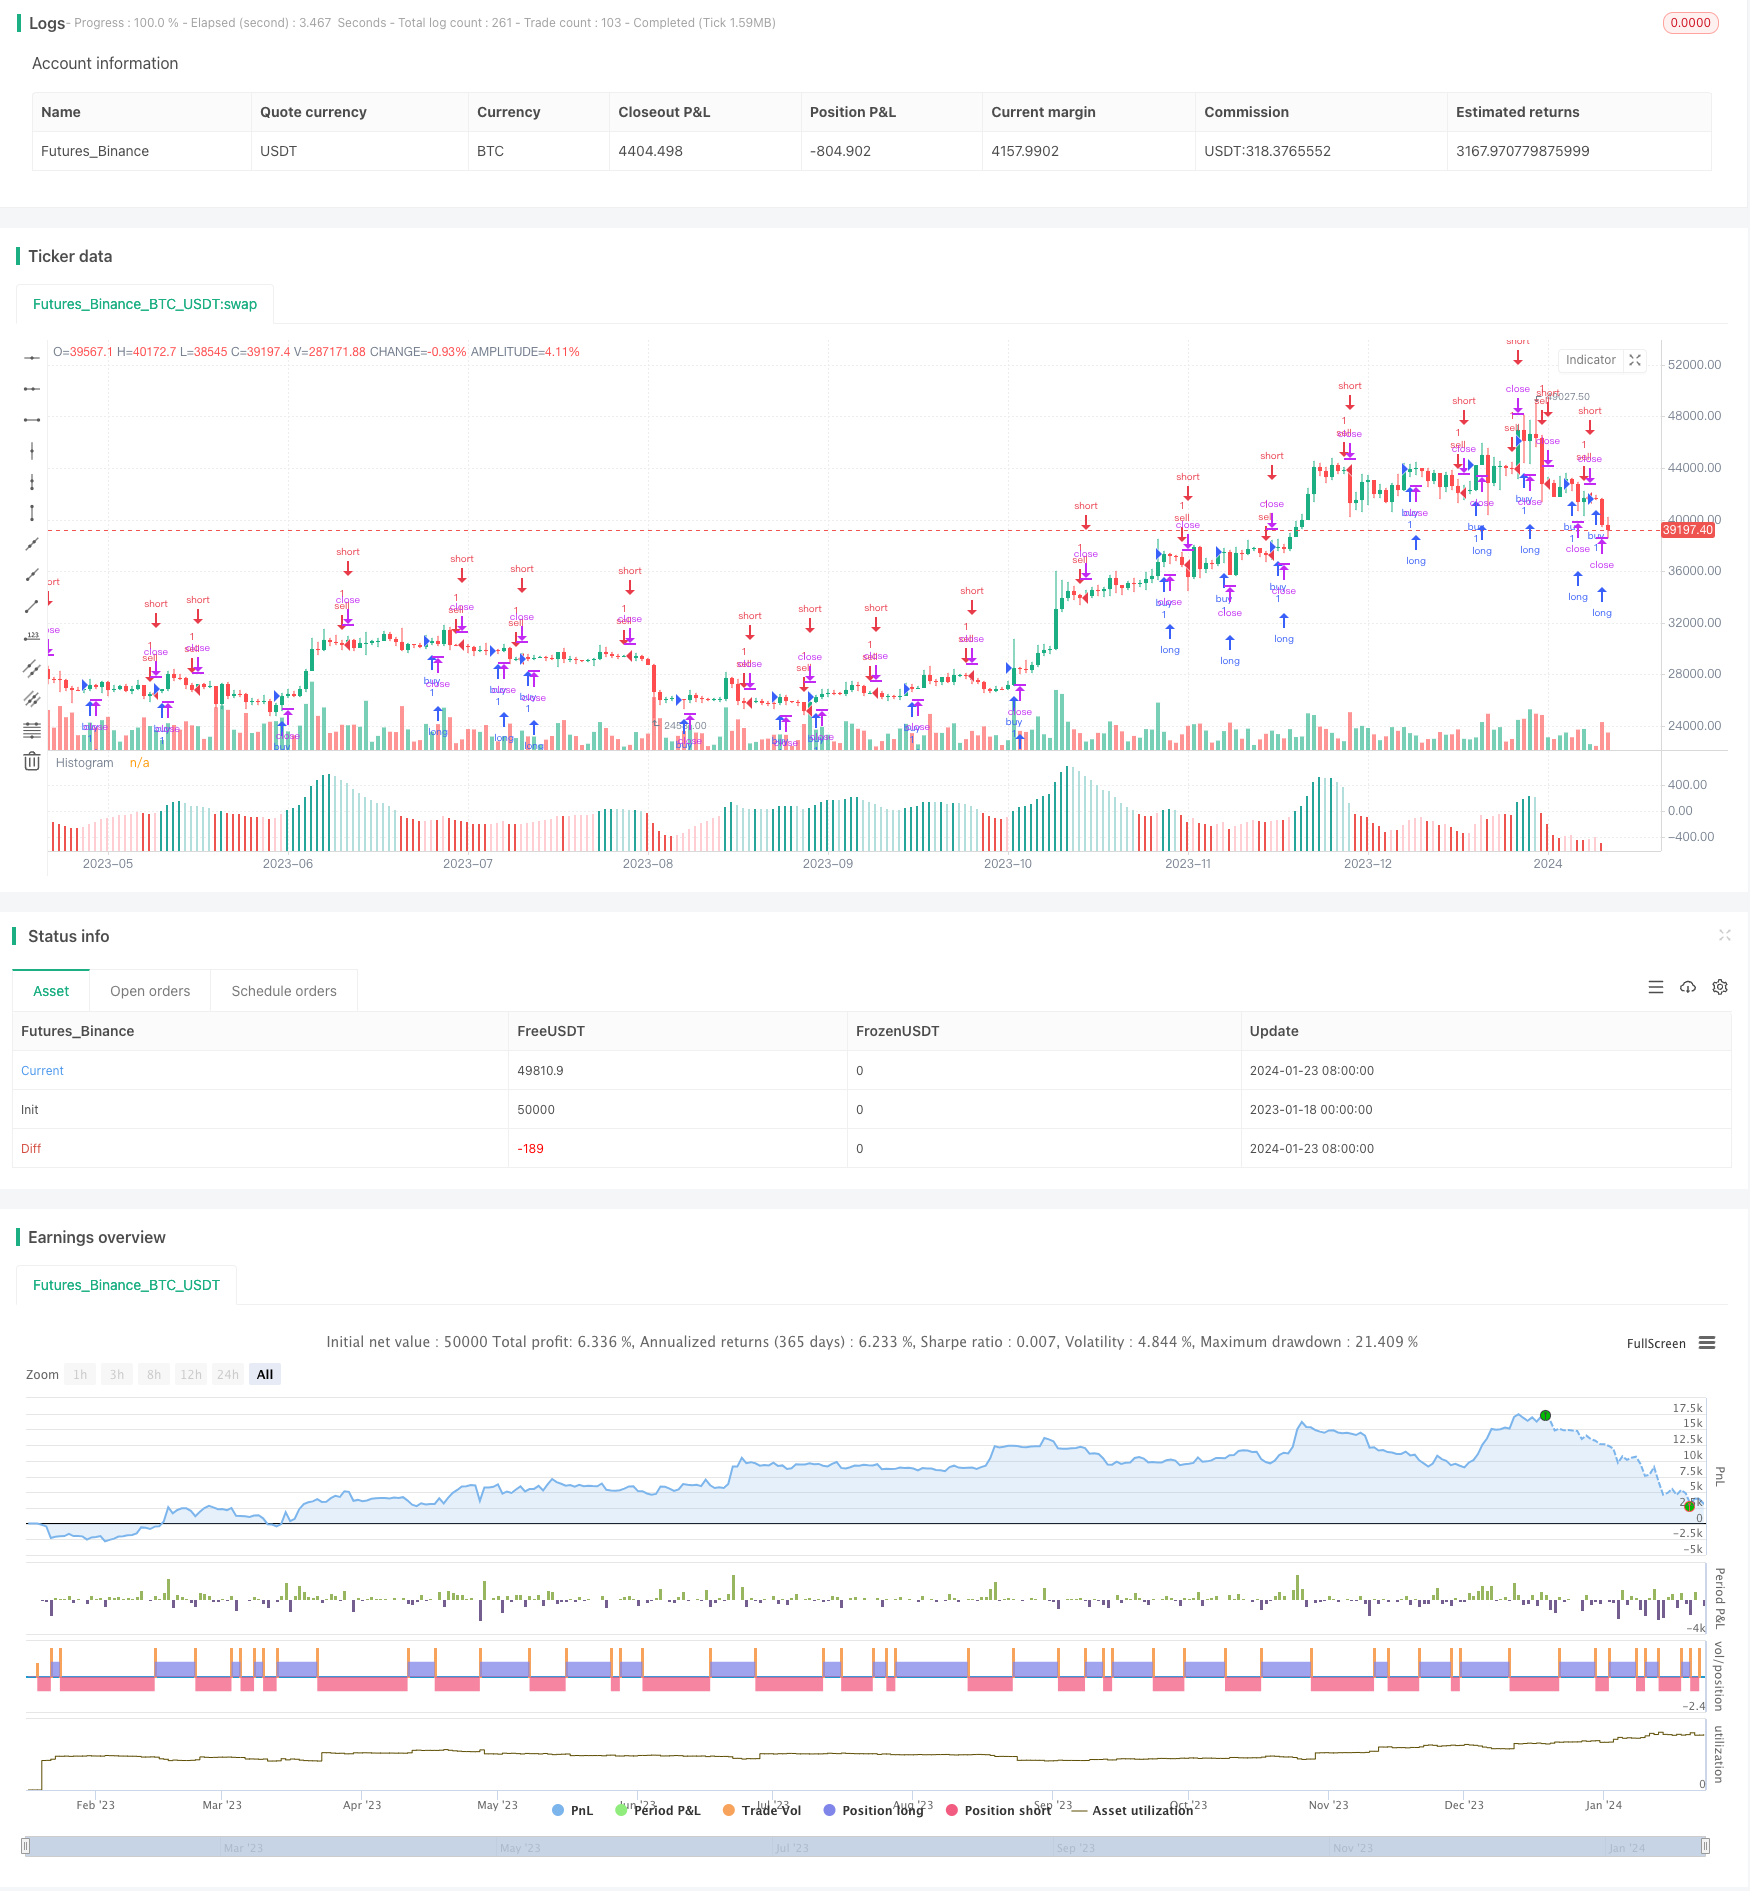
/*backtest
start: 2023-01-18 00:00:00
end: 2024-01-24 00:00:00
period: 1d
basePeriod: 1h
exchanges: [{"eid":"Futures_Binance","currency":"BTC_USDT"}]
*/

//@version=4
//study(title="Histogram Strategy by Sedkur", shorttitle="Histogram Strategy by Sedkur")
strategy (title="Histogram Trends Strategy by Sedkur", shorttitle="Histogram Trends Strategy by Sedkur")


/// Getting inputs
dyear = input(title="Year", type=input.integer, defval=2017, minval=1950, maxval=2500)
fast_length = input(title="Fast Length", type=input.integer, defval=12)
slow_length = input(title="Slow Length", type=input.integer, defval=26)
hist_length = input(title="Trend of Histogram Number", type=input.integer, defval=1, minval=1, maxval=100)
//buyh = input(title="Buy histogram value", type=input.float, defval=0.0, minval=-1000, maxval=1000, step=0.1)
//sellh = input(title="Sell histogram value", type=input.float, defval=0.0, minval=-1000, maxval=1000, step=0.1)
src = input(title="Source", type=input.source, defval=close)
signal_length = input(title="Signal Smoothing", type=input.integer, minval = 1, maxval = 50, defval = 9)
sma_source = input(title="Simple MA(Oscillator)", type=input.bool, defval=false)
sma_signal = input(title="Simple MA(Signal Line)", type=input.bool, defval=false)

// Plot colors
col_grow_above = #26A69A
col_grow_below = #FFCDD2
col_fall_above = #B2DFDB
col_fall_below = #EF5350
col_macd = #0094ff
col_signal = #ff6a00

/// Calculating
fast_ma = sma_source ? sma(src, fast_length) : ema(src, fast_length)
slow_ma = sma_source ? sma(src, slow_length) : ema(src, slow_length)
macd = fast_ma - slow_ma
signal = sma_signal ? sma(macd, signal_length) : ema(macd, signal_length)
hist = macd - signal

plot(hist, title="Histogram", style=plot.style_columns, color=(hist>=0 ? (hist[1] < hist ? col_grow_above : col_fall_above) : (hist[1] < hist ? col_grow_below : col_fall_below) ), transp=0 )
//plot(macd, title="MACD", color=col_macd, transp=0)
//plot(signal, title="Signal", color=col_signal, transp=0)

//bullish = hist[1] <= hist and buyh<=hist?true:false
//bearish = hist[1] >= hist and sellh>=hist?true:false
bull=0
bear=0


for i=0 to hist_length
    if (hist[i+1] <= hist[i])
        bull:=bull+1
bullish = bull==hist_length+1?true:false

for j=0 to hist_length
    if (hist[j+1] >= hist[j])
        bear:=bear+1
bearish = bear==hist_length+1?true:false


//bullish = hist[1] <= hist and hist[2] <= hist and hist[3] <= hist and hist[4] <= hist and hist[5] <= hist?true:false
//bearish = hist[1] >= hist and hist[2] >= hist and hist[3] >= hist and hist[4] >= hist and hist[5] >= hist?true:false

strategy.entry("buy", strategy.long, comment="buy", when = bullish and year>=dyear)
strategy.entry("sell", strategy.short, comment="sell", when = bearish and year>=dyear)