概述
这是一个结合使用3条指数移动平均线(EMA)、趋向指标(DMI)和移动平均聚散指标(MACD)来确定趋势方向和生成买卖信号的趋势跟踪策略。关键组成部分包括EMA黄金交叉信号、DMI判断趋势力度和MACD进行动量确认。
策略逻辑
核心逻辑依赖于在M5周期上计算的3条EMA - 34、89和200 - 来识别总体趋势。34周期EMA提供近期方向,而89和200 EMA则定义中长期趋势。
买入信号触发时: - 收盘价上穿34 EMA - +DI(看涨趋向运动)> 17 - ADX(趋势力度)> -DI
卖出信号生成时:
- 收盘价下穿34 EMA
- -DI(看跌趋向运动)> 17
- ADX > +DI
入场前还有MACD指标提供额外确认。
优势
该策略具有几个关键优势:
- 通过短期EMA黄金交叉及早捕捉趋势转向
- 使用多条EMA判断不同时间框架下的趋势力度
- DMI过滤器有助于避免错误信号,通过检查强劲的趋向运动
- MACD提供动量确认,提高交易机会的质量与概率
- 指标的组合提高了入场信号的准确性和时机
风险
主要考量的风险:
- 仅依赖EMA黄金交叉易受到误导和错位的影响
- 多重确认可能造成信号生成时点上的滞后
- 容易受突发性趋势反转的影响
缓解方法: - 采用适当的止损和仓位管理 - 根据当前市场条件优化EMA参数 - 观察价格实体动作进行视觉确认
优化方向
策略的进一步改进:
- 增加如RSI等指标,判断超买超卖区域
- 结合成交量分析生成更强信号
- 根据不同资产和时间框架进行指标和参数优化
- 运用机器学习技术持续从新市场数据中学习
总结
总的来说,这是一个强大的趋势跟踪体系,组合使用简单但实用的几种指标顺势而为。三EMA配置判断多时间框架下的趋势,DMI和MACD检查提升入场时机和获利概率。配合适当的优化和风险管理,它可以成为趋势交易者有效的利器。
策略源码
/*backtest
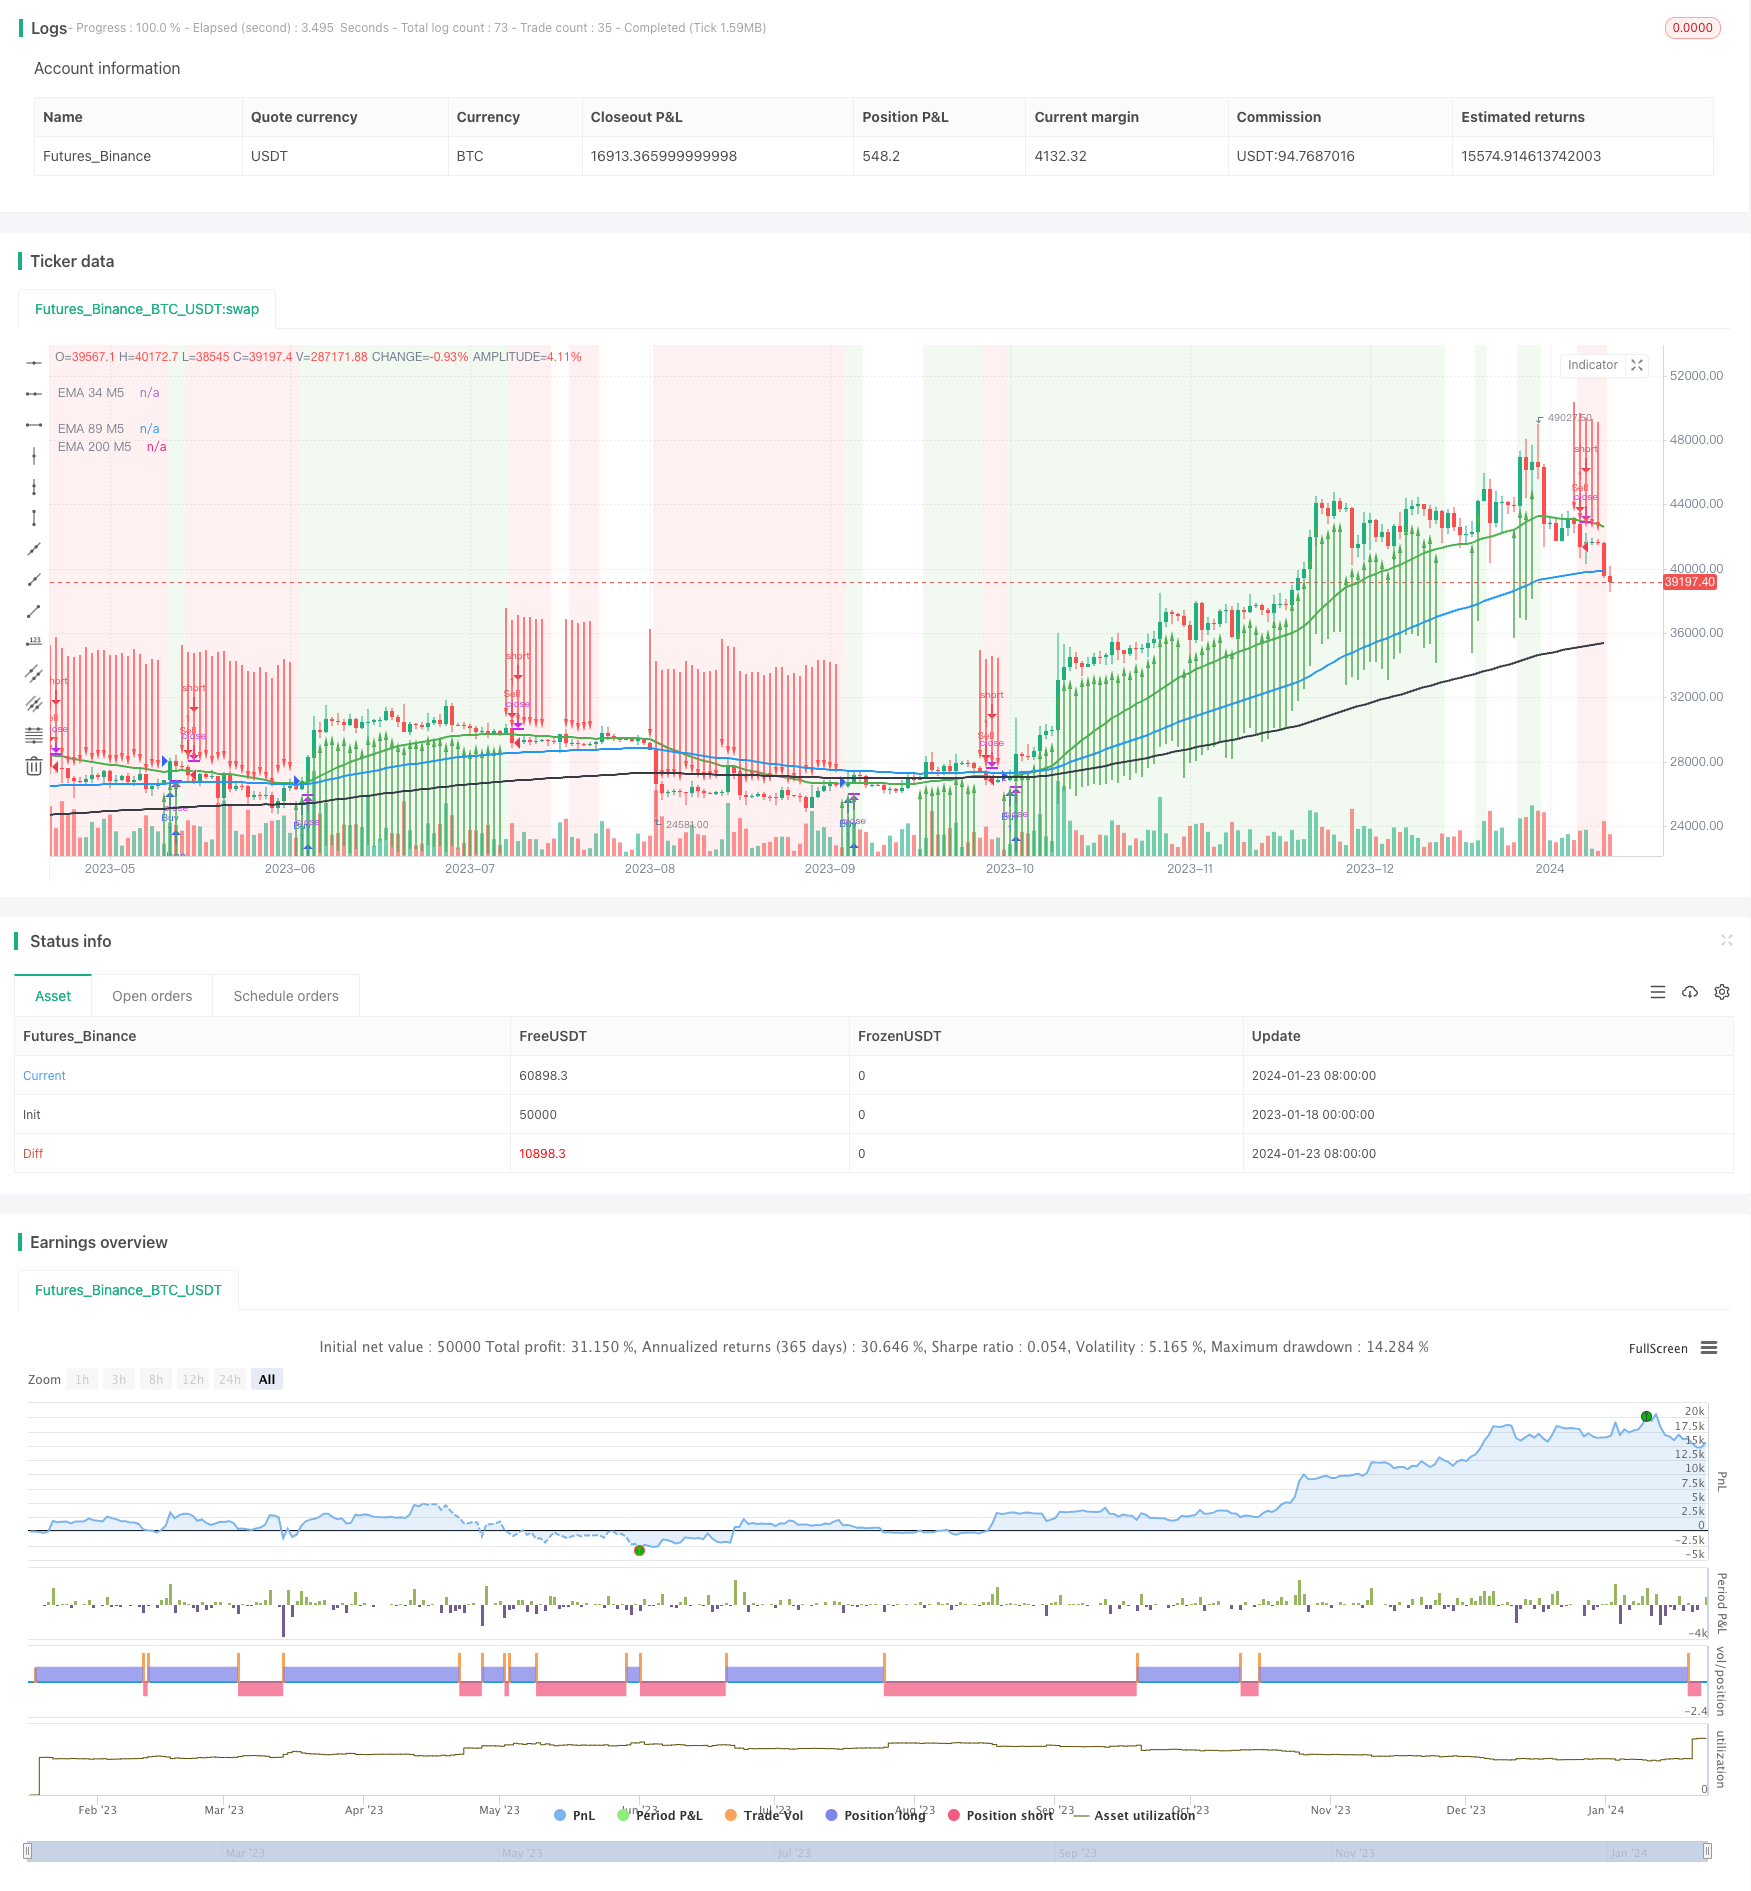
start: 2023-01-18 00:00:00
end: 2024-01-24 00:00:00
period: 1d
basePeriod: 1h
exchanges: [{"eid":"Futures_Binance","currency":"BTC_USDT"}]
*/
//@version=5
strategy("2 EMA di+ Buy Sell, strategy ", overlay=true)
// Define the EMA calculation function
ema(src, length) =>
ta.ema(src, length)
// Calculate and plot EMA on M5
ema34_M5 = ema(close, 34)
ema89_M5 = ema(close, 89)
ema200_M5 = ema(close, 200)
// Plot EMAs
plot(ema34_M5, color=color.green, title="EMA 34 M5", linewidth=2)
plot(ema89_M5, color=color.blue, title="EMA 89 M5", linewidth=2)
plot(ema200_M5, color=color.black, title="EMA 200 M5", linewidth=2)
// Define DMI parameters
len = input(14, title="DI Length")
up = ta.change(high)
down = -ta.change(low)
plusDM = na(up) ? na : (up > down and up > 0 ? up : 0)
minusDM = na(down) ? na : (down > up and down > 0 ? down : 0)
trur = ta.rma(ta.tr, len)
plusDI = 100 * ta.rma(plusDM, len) / trur
minusDI = 100 * ta.rma(minusDM, len) / trur
// Calculate ADX
adxValue = 100 * ta.rma(math.abs(plusDI - minusDI) / (plusDI + minusDI == 0 ? 1 : plusDI + minusDI), len)
// Define MACD parameters
fastLength = input(12, title="Fast Length")
slowLength = input(26, title="Slow Length")
signalLength = input(9, title="Signal Length")
// Calculate MACD
[macdLine, signalLine, _] = ta.macd(close, fastLength, slowLength, signalLength)
// Create buy/sell conditions
buyCondition = close > ema34_M5 and plusDI > 17 and adxValue > minusDI
sellCondition = close < ema34_M5 and minusDI > 17 and adxValue > plusDI
// Strategy logic
strategy.entry("Buy", strategy.long, when = buyCondition)
strategy.entry("Sell", strategy.short, when = sellCondition)
// Create alerts for buy/sell signals
alertcondition(buyCondition, title="Buy Signal", message="Buy Signal")
alertcondition(sellCondition, title="Sell Signal", message="Sell Signal")
// Plot buy/sell arrows on the price chart
bgcolor(buyCondition ? color.new(color.green, 90) : sellCondition ? color.new(color.red, 90) : na)
plotarrow(buyCondition ? 1 : sellCondition ? -1 : na, colorup=color.new(color.green, 0), colordown=color.new(color.red, 0), offset=-1)