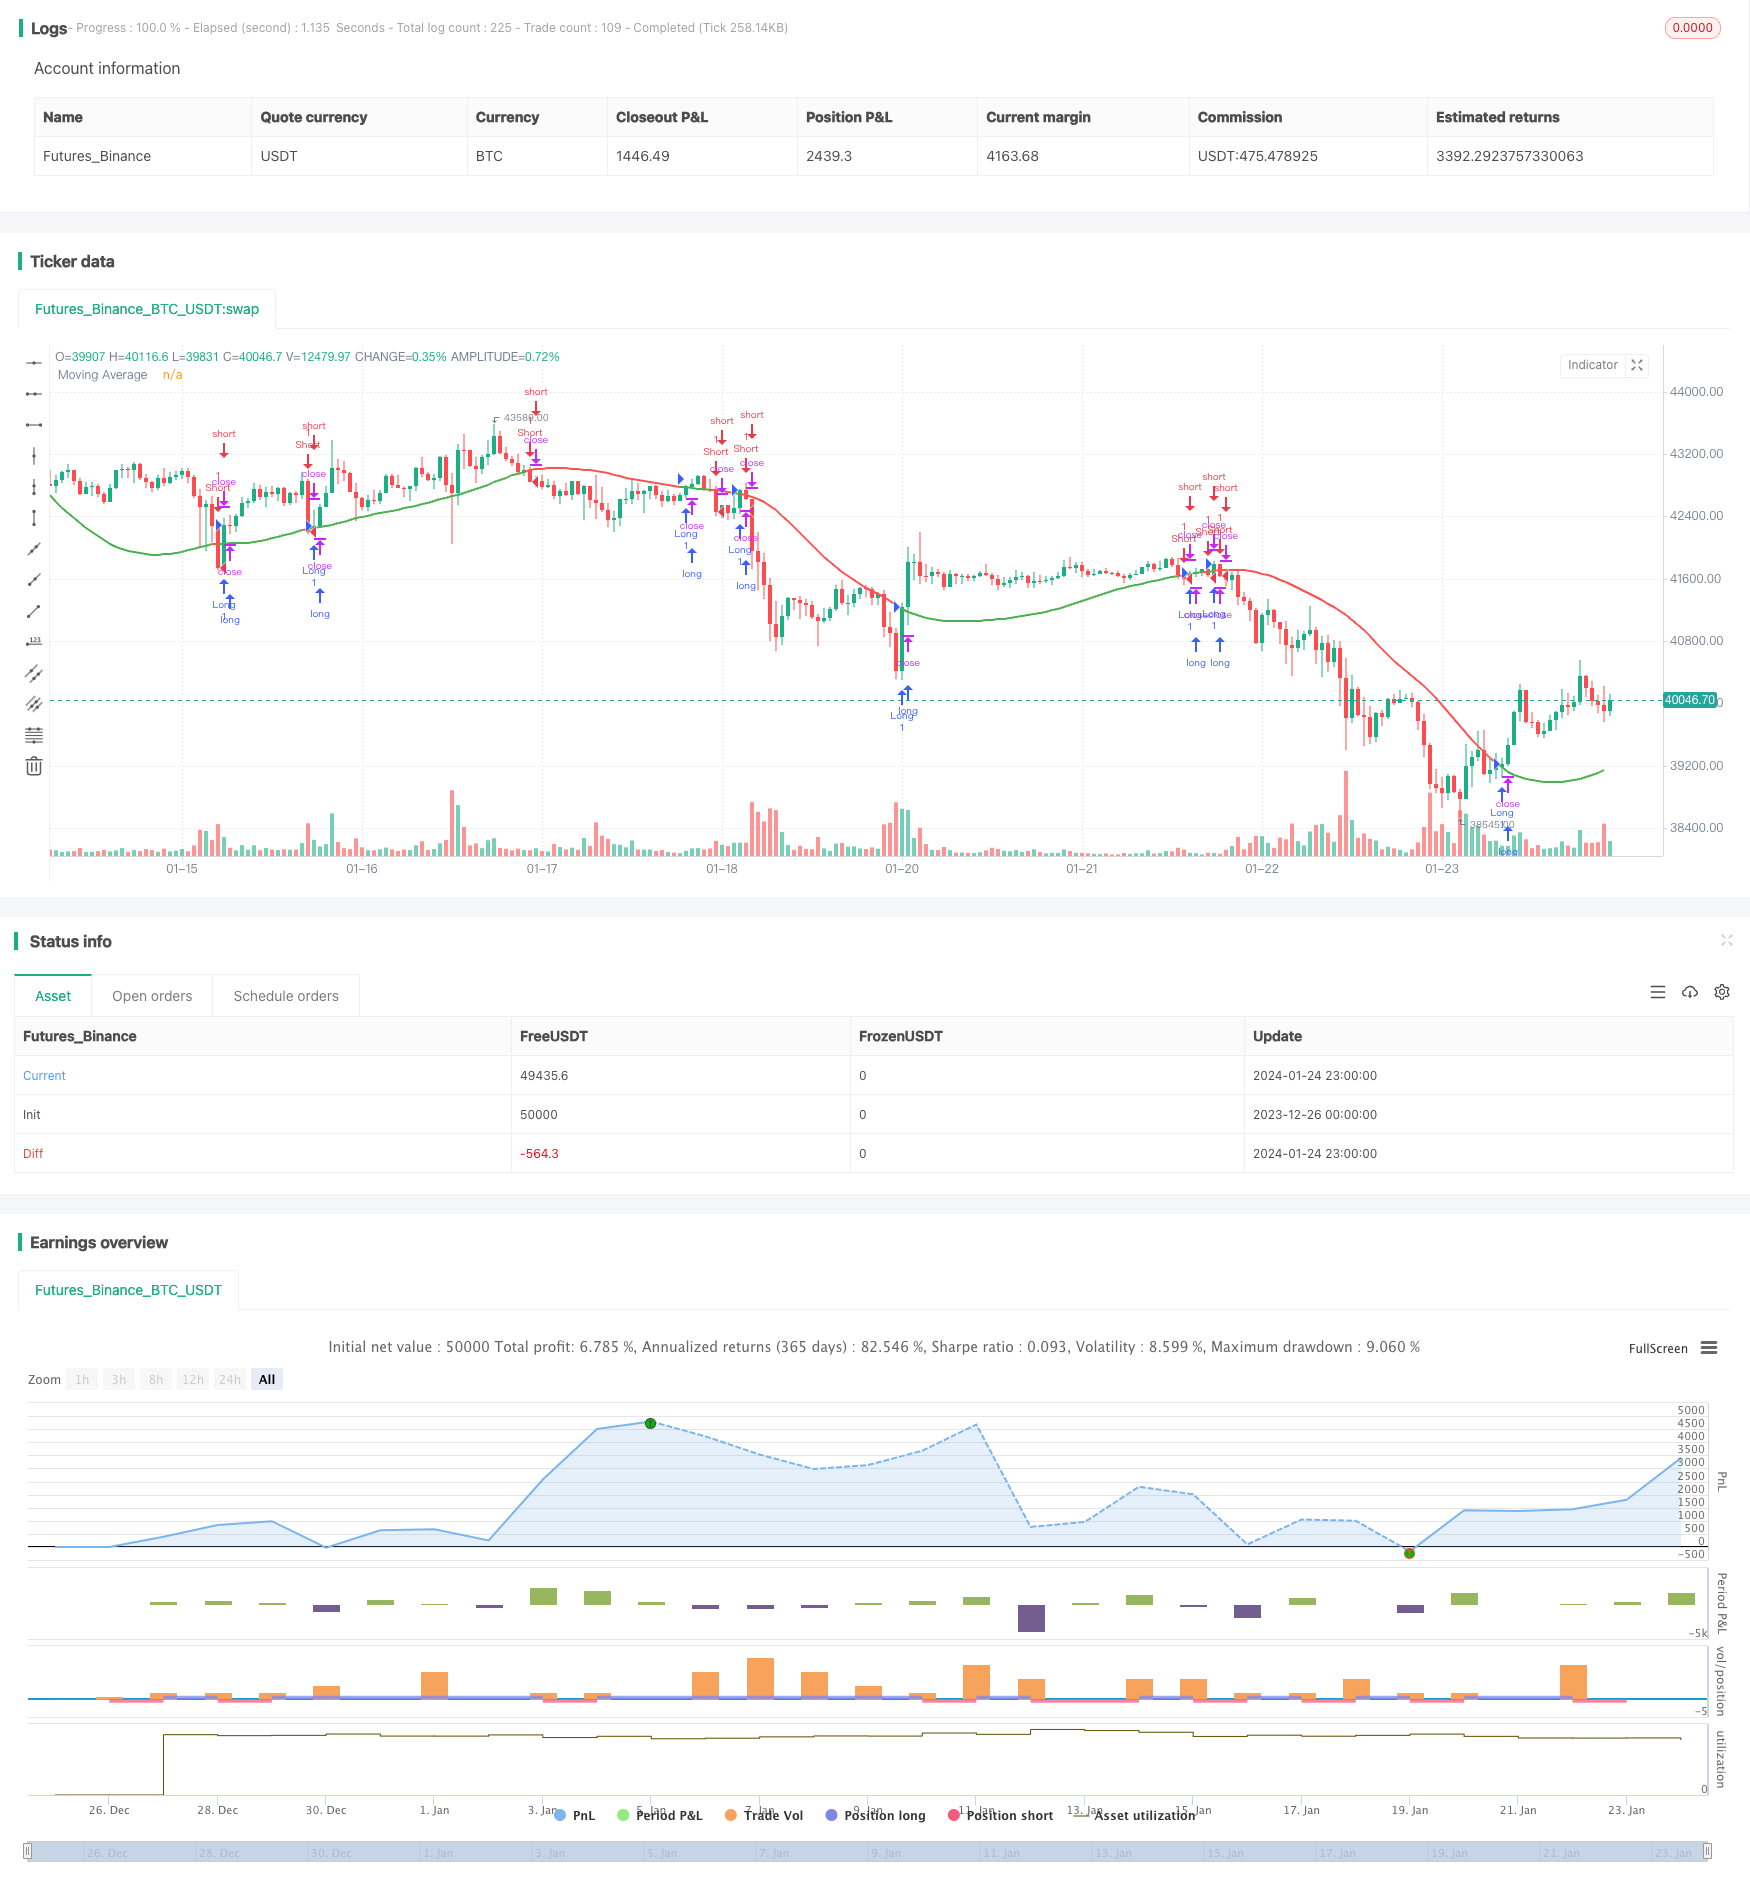
概述
这个策略基于价格与移动平均线的交叉来产生买入和卖出信号。它提供了多种类型的移动平均线以及一个公差参数来过滤假突破。该策略旨在捕捉价格趋势的转折点,实现趋势跟踪。
策略原理
该策略以价格收盘价为基础,计算出长度为N的移动平均线。典型的移动平均线类型有简单移动平均线(SMA)、指数移动平均线(EMA)、加权移动平均线(WMA)等。然后设定一个公差水平,比如5%,并计算出上轨(移动平均线的1.05倍)和下轨(移动平均线的0.95倍)。当价格收盘价上穿上轨时,产生买入信号;当价格收盘价下穿下轨时,产生卖出信号。这样可以过滤掉部分假突破。另外,该策略提供了一个布尔参数“短线操作”,启用这个参数后,只产生卖出信号,看空使用。
策略优势
- 利用移动平均线的趋势跟踪特性,能够有效跟踪价格走势
- 提供多种移动平均线类型,可以灵活组合使用
- 公差参数可以过滤假突破,避免不必要的交易
- 可仅做空,适用于跟踪下跌趋势
策略风险
- 移动平均线具有滞后性,可能错过价格转折点
- 不适用于价格震荡盘整的市场环境
- 公差参数设置不当可能过滤掉部分有效信号
- 做空风险较大,需审慎操作
优化方向
- 优化移动平均线的类型和长度参数
- 测试不同的公差参数设置
- 结合其他指标过滤信号
- 增加仓位管理策略
总结
该策略整体来说是一个较为典型的趋势跟踪策略。它使用价格与移动平均线的关系来判断趋势,并且提供了一定的灵活性。通过参数优化和适当的信号过滤,它可以成为一个效果不错的量化策略。但需要注意控制做空的风险,避免亏损过大。
策略源码
/*backtest
start: 2023-12-26 00:00:00
end: 2024-01-25 00:00:00
period: 1h
basePeriod: 15m
exchanges: [{"eid":"Futures_Binance","currency":"BTC_USDT"}]
*/

// This source code is subject to the terms of the Mozilla Public License 2.0 at https://mozilla.org/MPL/2.0/
// © RafaelPiccolo

//@version=4
strategy("Price X MA Cross", overlay=true)

typ = input("HMA", "MA Type", options=["SMA", "EMA", "WMA", "HMA", "VWMA", "RMA", "TEMA"])
len = input(100, minval=1, title="Length")
src = input(close, "Source", type=input.source)
tol = input(0, minval=0, title="Tolerance (%)", type=input.float)
shortOnly = input(false, "Short only")

tema(src, len)=>
    ema1 = ema(src, len)
    ema2 = ema(ema1, len)
    ema3 = ema(ema2, len)
    return = 3 * (ema1 - ema2) + ema3

getMAPoint(type, len, src)=>
    return = type == "SMA" ? sma(src, len) : type == "EMA" ? ema(src, len) : type == "WMA" ? wma(src, len) : type == "HMA" ? hma(src, len) : type == "VWMA" ? vwma(src, len) : type == "RMA" ? rma(src, len) : tema(src, len)

ma = getMAPoint(typ, len, src)
upperTol = ma * (1 + tol/100)
lowerTol = ma * (1 - tol/100)

longCondition = crossover(close, upperTol)
shortCondition = crossunder(close, lowerTol)

if (shortCondition)
    strategy.entry("Short", strategy.short)

if (longCondition)
    if (shortOnly)
        strategy.close("Short")
    else
        strategy.entry("Long", strategy.long)

plot(ma, "Moving Average", close > ma ? color.green : color.red, linewidth = 2)
t1 = plot(tol > 0 ? upperTol : na, transp = 70)
t2 = plot(tol > 0 ? lowerTol : na, transp = 70)
fill(t1, t2, color = tol > 0 ? color.blue : na)