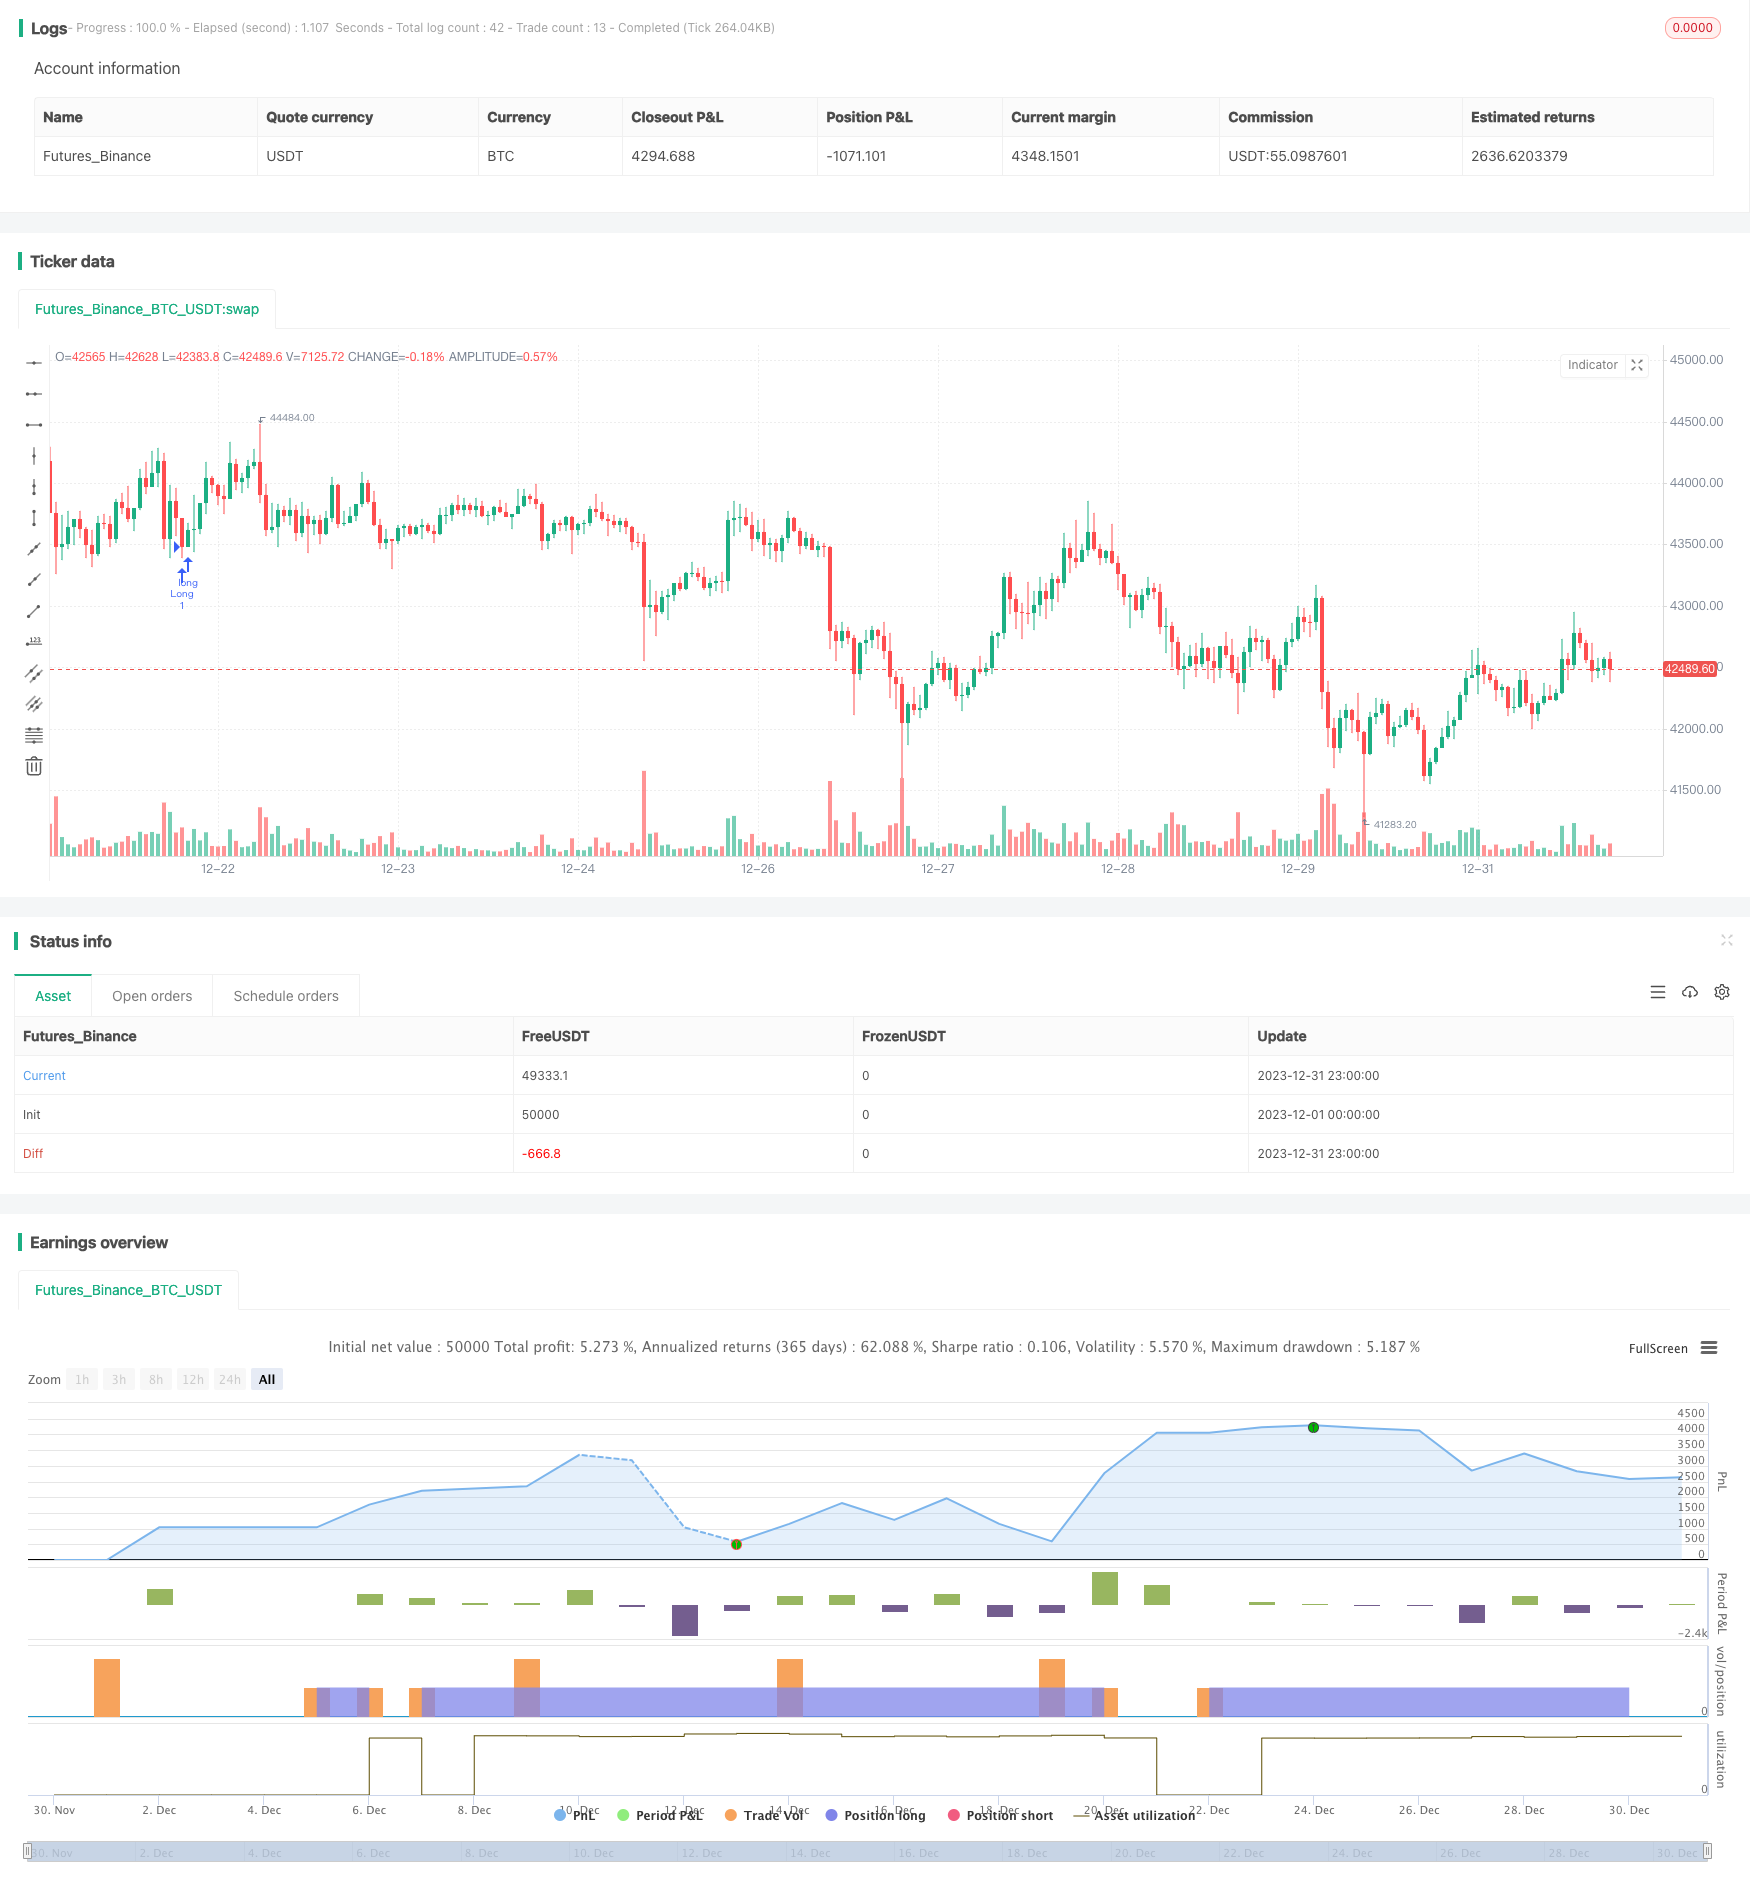
概述
本策略是基于Bollinger Bands指标和相对强弱指数(RSI)指标的量化交易策略。该策略运用机器学习的方法,通过Python语言对近1年的历史数据进行了回测优化,找到了最优的参数组合。
策略原理
该策略的交易信号来源于双重Bollinger Bands和RSI指标的综合判断。其中,Bollinger Bands指标是根据价格的标准差带计算得到的波动通道。当价格接近或触及波动通道时产生交易信号。而RSI指标则判断价格的超买超卖情况。
具体来说,当收盘价低于1.0标准差下轨,同时RSI大于42时产生买入信号。当收盘价高于1.0标准差上轨,同时RSI大于70时产生卖出信号。此外,该策略还设置了两组BB和RSI的参数,分别用于进场和止损平仓。这些参数都是通过大量回测和机器学习获得的最优值。
优势分析
这套策略最大的优势在于参数的精确程度。通过机器学习的方法,各个参数都是经过全面回测获得最佳 Sharpe比率的。这样既确保了策略收益率,也控制了风险。此外,双重指标组合也提高了信号的准确性和胜率。
风险分析
该策略的风险主要来源于止损点的设置。如果止损点设置过大,则无法有效控制损失。此外,如果止损点与手续费、交易滑点等其他交易成本计算不当也会增加风险。为减少风险,建议调整止损幅度参数,降低交易频率,同时计算合理的止损位置。
优化方向
这套策略还有进一步优化的空间。例如可以尝试改变Bollinger Bands的长度参数,或者调整RSI的超买超卖阈值。此外也可以尝试引入其他指标,构建多指标组合。这可能会提高策略的盈利空间和稳定性。
总结
该策略结合双重BB指标和RSI指标,通过机器学习方法获得了最优参数,实现了高收益率和可控的风险水平。它具有指标组合判断和参数优化两个方面的优势。通过持续改进,这套策略有望成为一个优秀的量化交易策略。
策略源码
/*backtest
start: 2023-12-01 00:00:00
end: 2023-12-31 23:59:59
period: 1h
basePeriod: 15m
exchanges: [{"eid":"Futures_Binance","currency":"BTC_USDT"}]
*/

// @version=4
// This source code is subject to the terms of the Mozilla Public License 2.0 at https://mozilla.org/MPL/2.0/
// © Bunghole 2020
strategy(overlay=true, shorttitle="Flawless Victory Strategy" )

// Stoploss and Profits Inputs
v1 = input(true, title="Version 1 - Doesn't Use SL/TP")
v2 = input(false, title="Version 2 - Uses SL/TP")
stoploss_input = input(6.604, title='Stop Loss %', type=input.float, minval=0.01)/100
takeprofit_input = input(2.328, title='Take Profit %', type=input.float, minval=0.01)/100
stoploss_level = strategy.position_avg_price * (1 - stoploss_input)
takeprofit_level = strategy.position_avg_price * (1 + takeprofit_input)

//SL & TP Chart Plots
plot(v2 and stoploss_input and stoploss_level ? stoploss_level: na, color=color.red, style=plot.style_linebr, linewidth=2, title="Stoploss")
plot(v2 and takeprofit_input ? takeprofit_level: na, color=color.green, style=plot.style_linebr, linewidth=2, title="Profit")

// Bollinger Bands 1
length = 20
src1 = close
mult = 1.0
basis = sma(src1, length)
dev = mult * stdev(src1, length)
upper = basis + dev
lower = basis - dev

// Bollinger Bands 2
length2 = 17
src2 = close
mult2 = 1.0
basis2 = sma(src1, length2)
dev2 = mult2 * stdev(src2, length2)
upper2 = basis2 + dev2
lower2 = basis2 - dev2

// RSI
len = 14
src = close
up = rma(max(change(src), 0), len)
down = rma(-min(change(src), 0), len)
rsi = down == 0 ? 100 : up == 0 ? 0 : 100 - 100 / (1 + up / down)

// Strategy Parameters
RSILL= 42
RSIUL= 70
RSILL2= 42
RSIUL2= 76

rsiBuySignal = rsi > RSILL
rsiSellSignal = rsi > RSIUL
rsiBuySignal2 = rsi > RSILL2
rsiSellSignal2 = rsi > RSIUL2

BBBuySignal = src < lower
BBSellSignal = src > upper
BBBuySignal2 = src2 < lower2
BBSellSignal2 = src2 > upper2

// Strategy Long Signals
Buy = rsiBuySignal and BBBuySignal
Sell = rsiSellSignal and BBSellSignal
Buy2 = rsiBuySignal2 and BBBuySignal2
Sell2 = rsiSellSignal2 and BBSellSignal2

if v1 == true
    strategy.entry("Long", strategy.long, when = Buy, alert_message = "v1 - Buy Signal!")
    strategy.close("Long", when = Sell, alert_message = "v1 - Sell Signal!")

if v2 == true
    strategy.entry("Long", strategy.long, when = Buy2, alert_message = "v2 - Buy Signal!")
    strategy.close("Long", when = Sell2, alert_message = "v2 - Sell Signal!")
    strategy.exit("Stoploss/TP", "Long", stop = stoploss_level, limit = takeprofit_level)