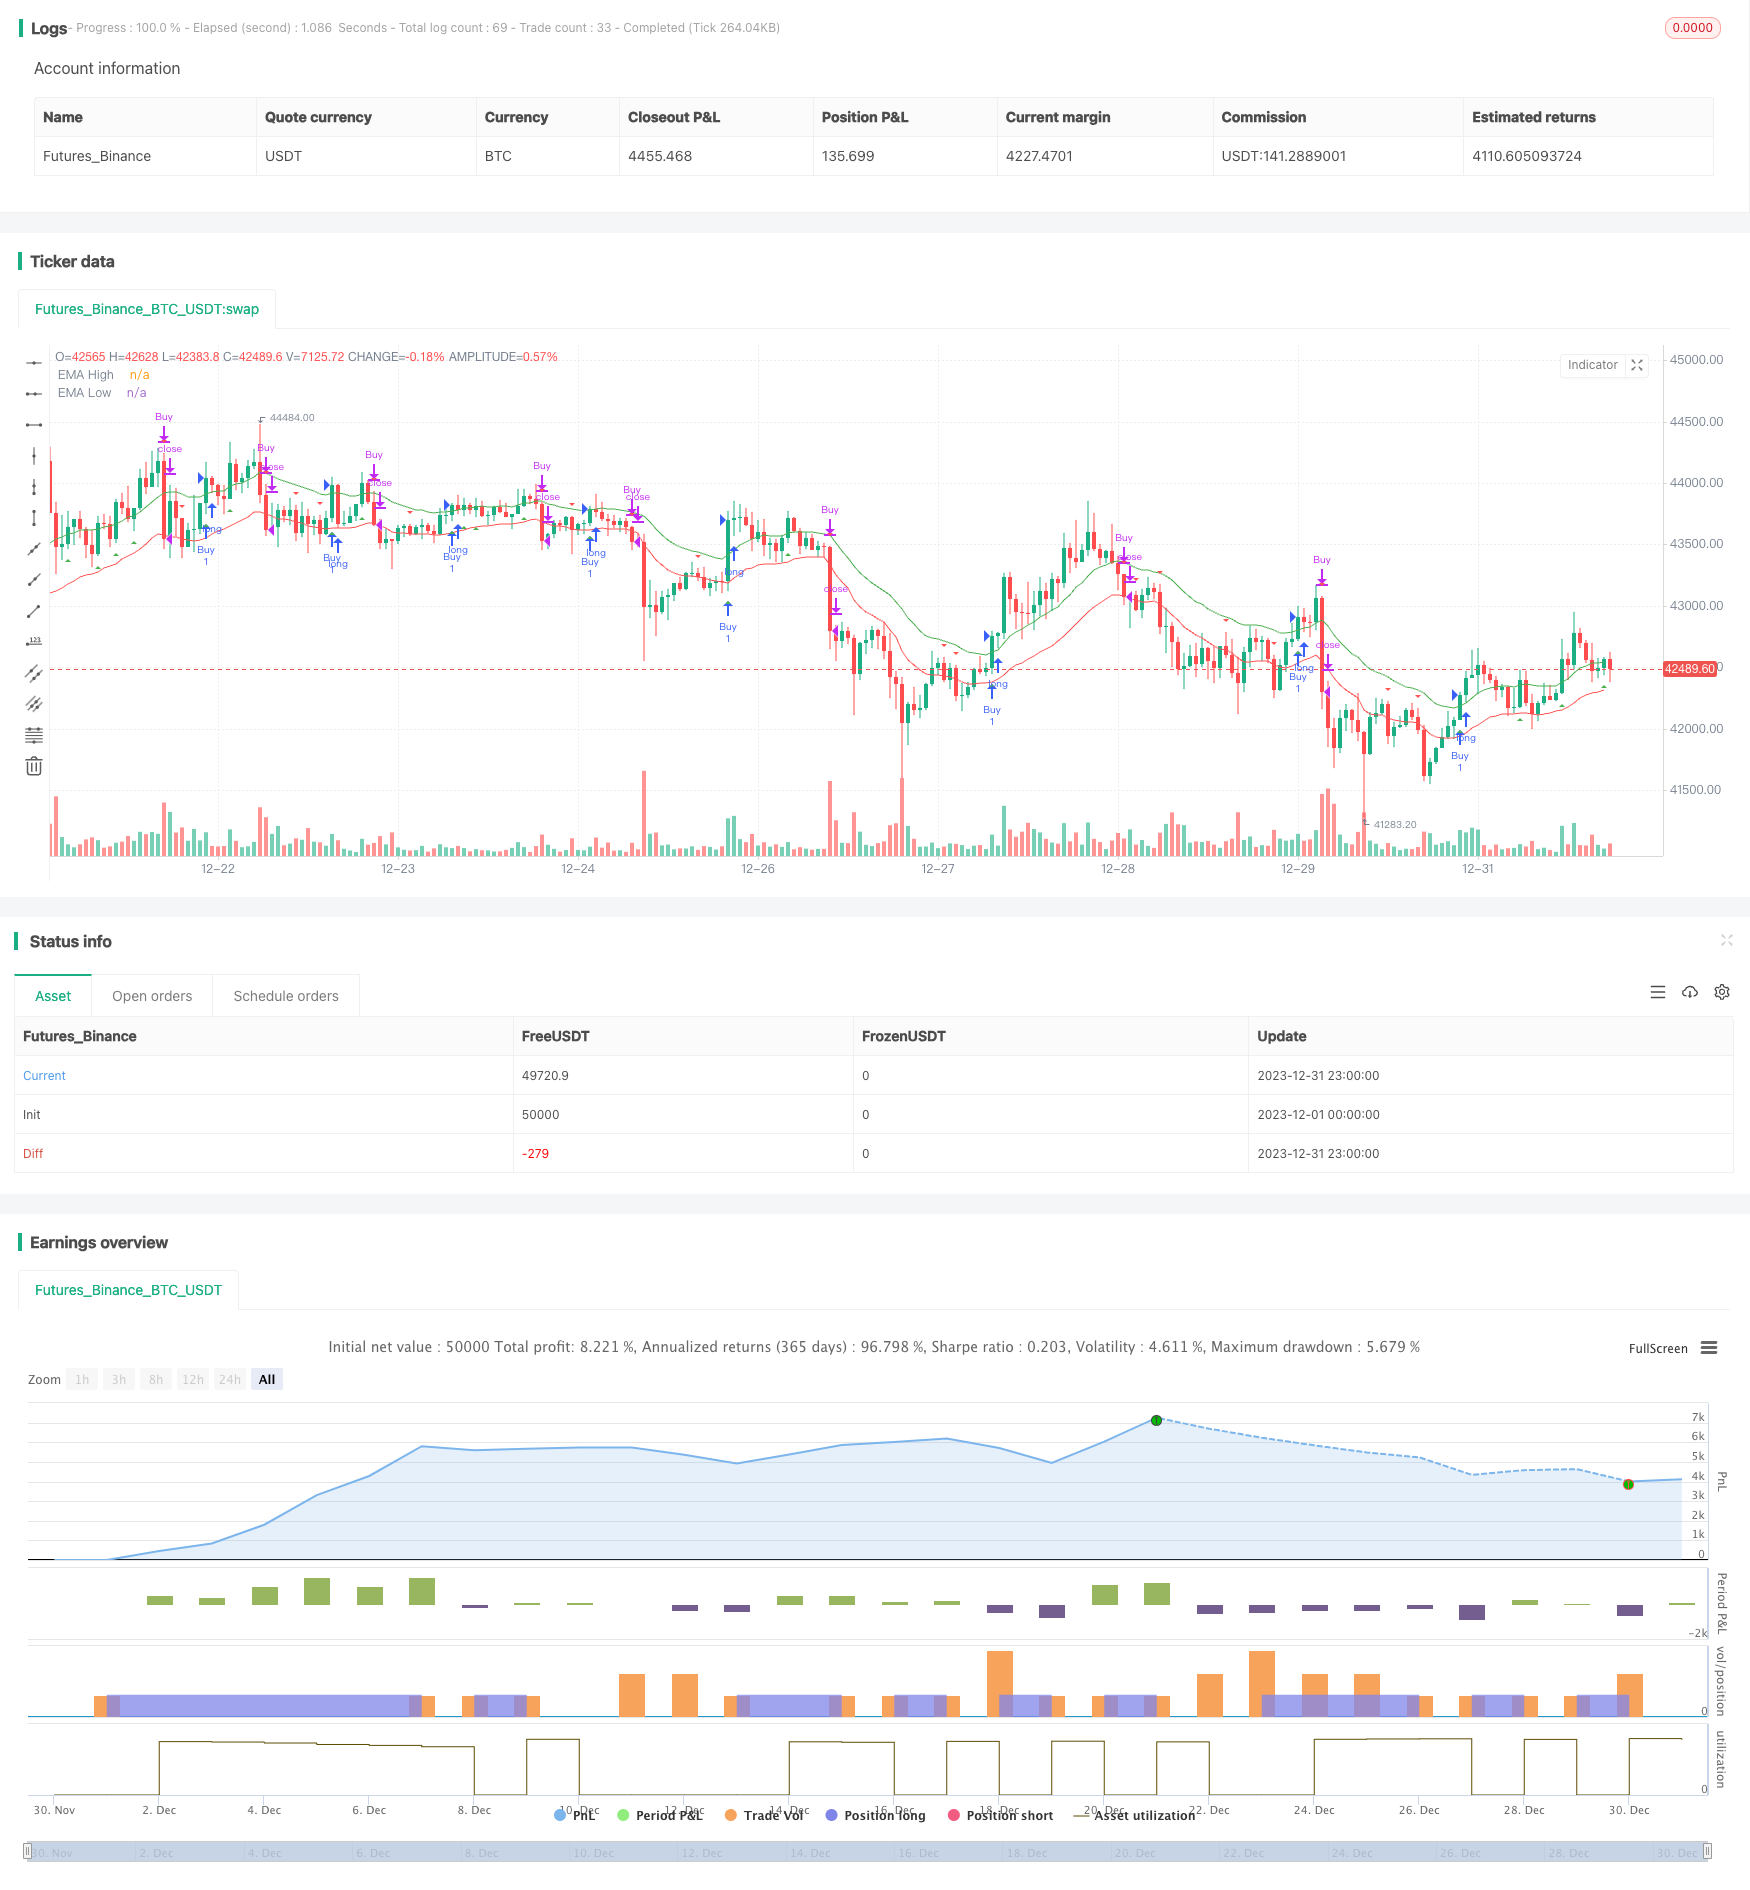
概述
该策略基于20日指数移动平均线(EMA)构建通道,当价格突破通道上沿时做多,当价格跌破通道下沿时做空,属于趋势跟踪策略。
策略原理
- 计算20日EMA的高点和低点,构建通道。
- 当收盘价大于20日EMA高点时,做多。
- 当收盘价小于20日EMA低点时,做空。
- 止损点为通道的另一端,如做多止损为20日EMA低点。
优势分析
- 使用EMA构建通道,可以有效跟踪趋势。
- 20日EMA参数简单实用。
- 采用突破做信号,可以减少错误交易。
- 止损点设置合理,最大程度控制风险。
风险分析
- 突破信号可能出现误报。
- 震荡行情中容易止损。
- 参数不当可能导致过于灵敏或迟钝。
风险解决方法:
- 结合其他指标过滤信号。
- 优化参数,适应不同周期。
- 谨慎操作,注意资金管理。
优化方向
- 结合量价指标过滤错误信号。
- 测试不同EMA周期参数的效果。
- 增加移动止损来锁定盈利。
- 结合波动率指标判断趋势强弱。
总结
该策略整体简单实用,基于EMA通道构建,属于典型的趋势跟踪策略。有突破做信号的特点,但也存在一定的误报风险。可以通过优化参数、增加过滤器等方式提高策略效果,值得进一步测试与优化。
策略源码
/*backtest
start: 2023-12-01 00:00:00
end: 2023-12-31 23:59:59
period: 1h
basePeriod: 15m
exchanges: [{"eid":"Futures_Binance","currency":"BTC_USDT"}]
*/

//@version=4
strategy("EMA Channel Strategy with Alerts", shorttitle="EMA Channel", overlay=true)

// Define EMA length
emaLength = 20

// Calculate EMA values
emaHigh = ema(high, emaLength)
emaLow = ema(low, emaLength)

// Define the condition for a buy signal
buyCondition = crossover(close, emaHigh)

// Define the condition for a sell signal
sellCondition = crossunder(close, emaLow)

// Plot the EMA lines
plot(emaHigh, color=color.green, title="EMA High")
plot(emaLow, color=color.red, title="EMA Low")

// Plot buy and sell signals
plotshape(buyCondition, style=shape.triangleup, location=location.belowbar, color=color.green, title="Buy Signal")
plotshape(sellCondition, style=shape.triangledown, location=location.abovebar, color=color.red, title="Sell Signal")

// Strategy
strategy.entry("Buy", strategy.long, when=buyCondition)
strategy.close("Buy", when=sellCondition)

// Define and trigger alerts
alertcondition(buyCondition, title="Buy Alert", message="Buy signal - Price crossed above EMA High")
alertcondition(sellCondition, title="Sell Alert", message="Sell signal - Price crossed below EMA Low")