概述
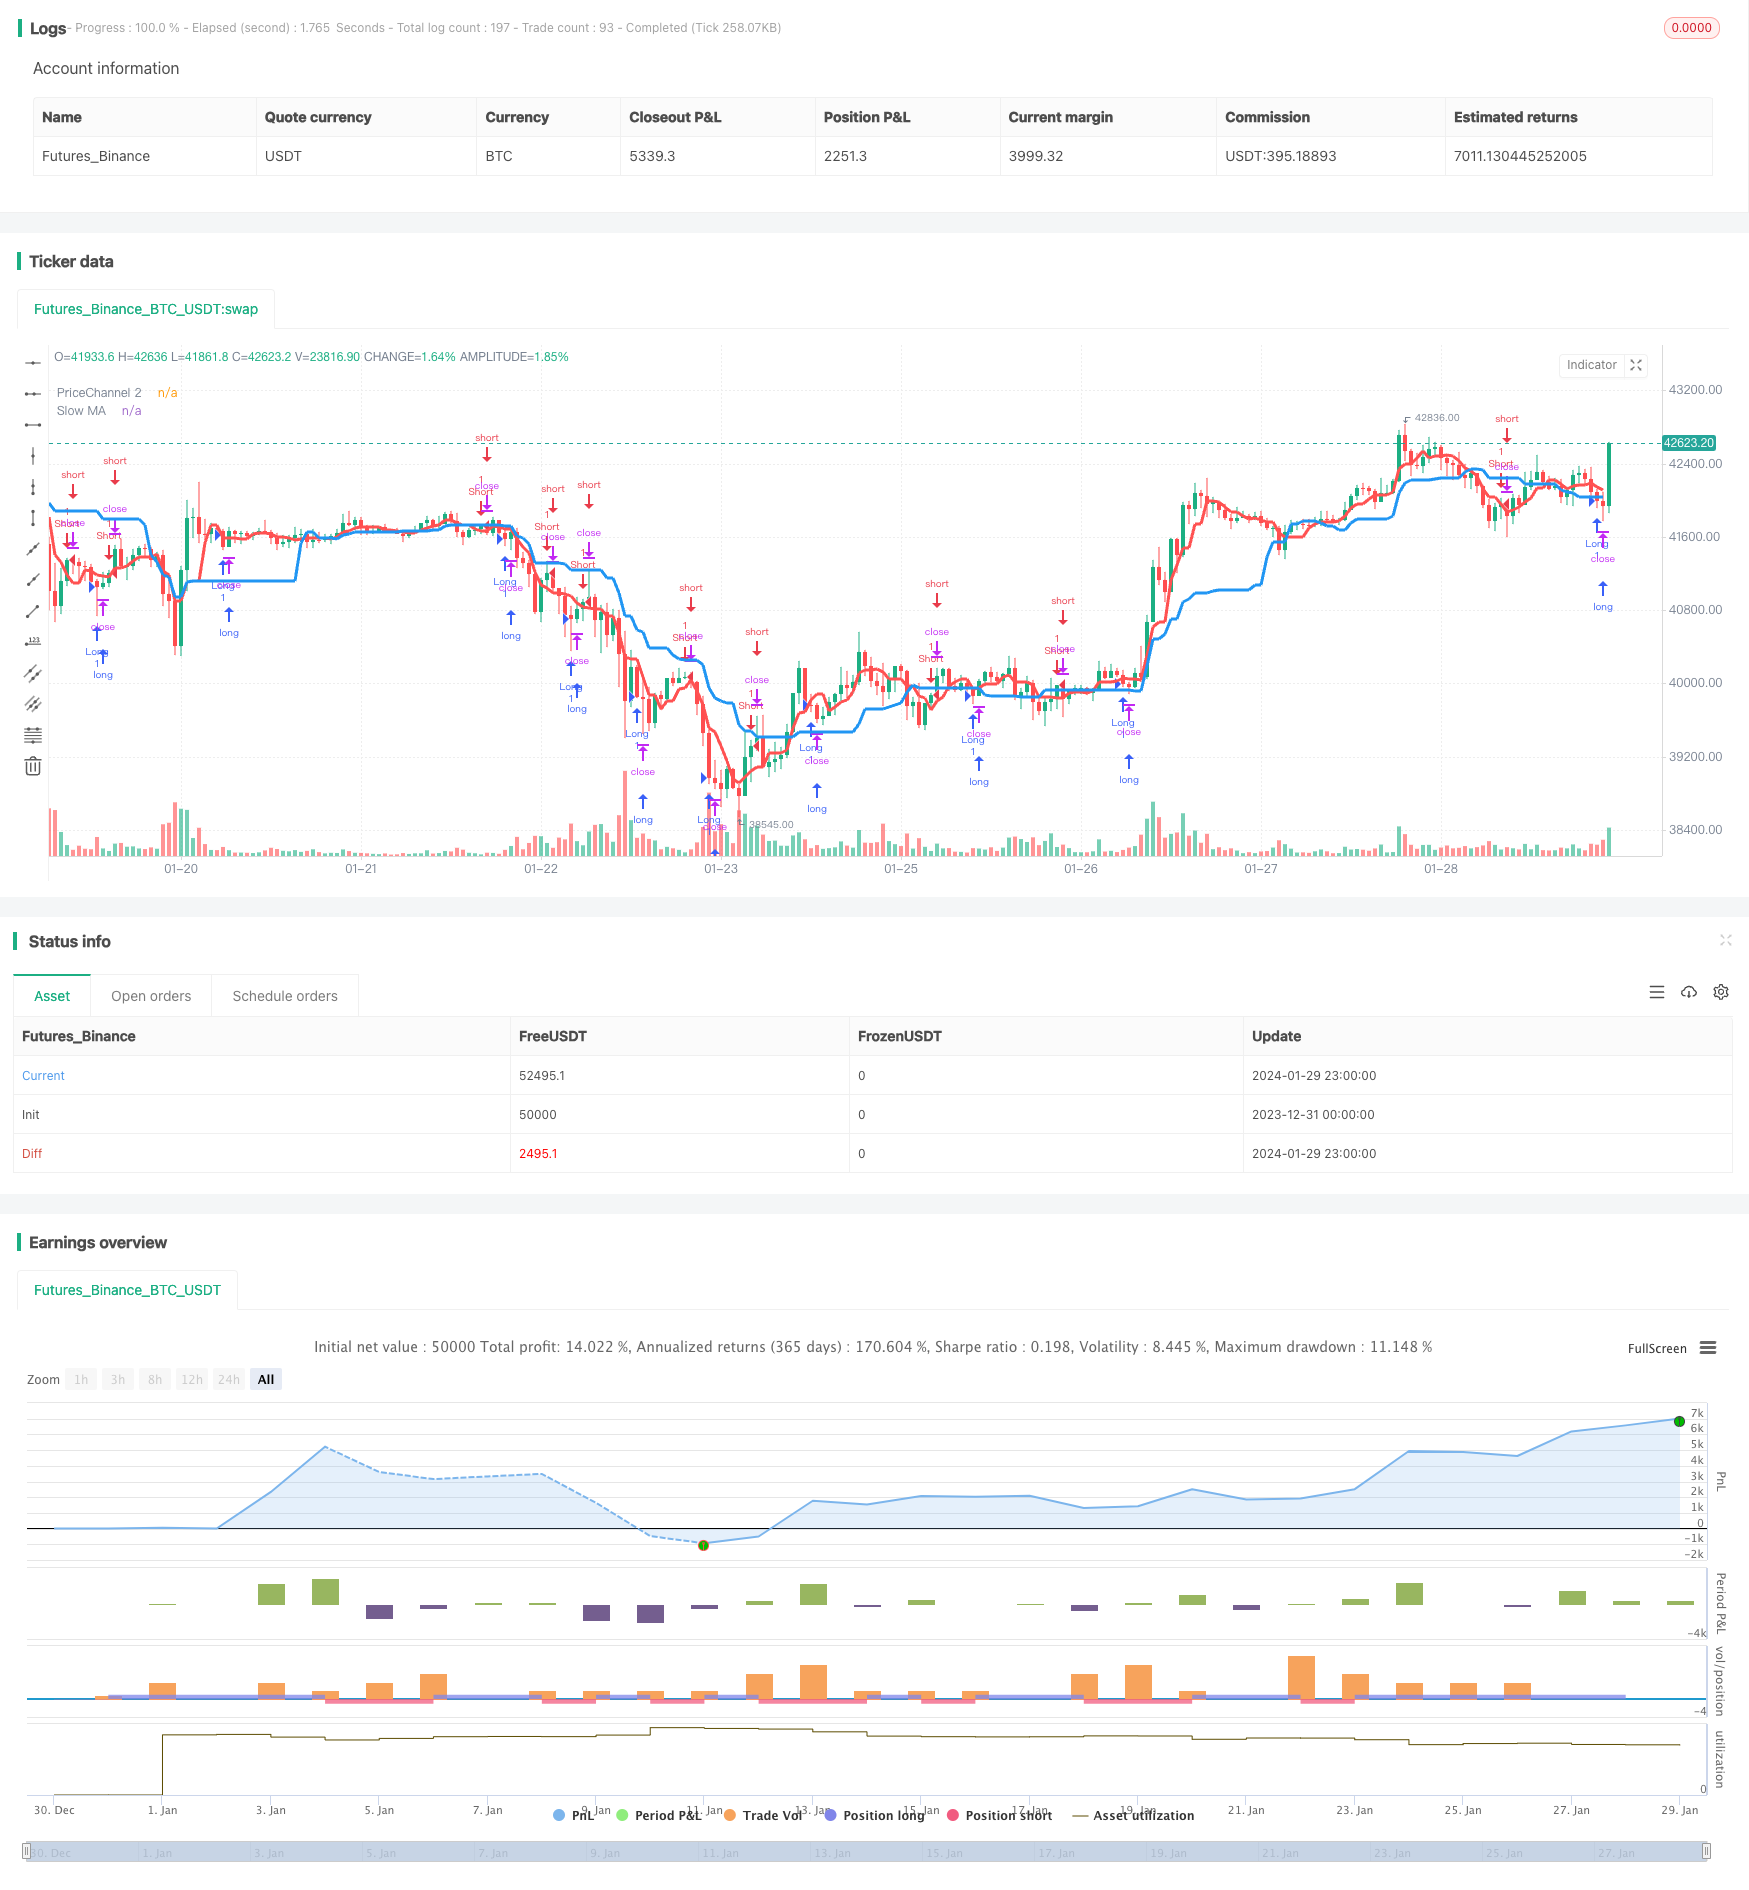
该策略运用两个均线指标来识别趋势方向和做多做空时机。其中慢速均线(蓝线)用于判断整体趋势方向,快速均线(红线)与价格通道结合,用于发现做多做空时机。
策略原理
计算快慢两个均线。慢速均线周期为21,用于判断整体趋势;快速均线周期为5,与价格通道结合,用于发现交易时机。
计算当前价格是否突破上一个周期的价格通道。如果价格突破通道,我们认为是一个交易机会。
计算K线的方向和数量。如果最后N根K线都是阴线,则可能为做多时机;如果最后N根K线都是阳线,则可能为做空时机。N的数量通过Bars参数设置。
综合以上几个因素,发出做多做空信号。如果行情与慢速均线方向一致,且快速均线或价格通道发出信号,同时K线也符合条件,则发出交易信号。
策略优势
使用双均线系统,能够有效跟踪趋势方向。
快速均线与价格通道的结合,能够提早发现突破点,把握交易时机。
发信号时还考虑K线方向和数量,避免被反转市场套牢。
可自由调整均线参数,适用于不同品种和周期。
策略风险及解决方法
双均线容易在横盘时发出错误信号。可通过价差指标或ATR指标辅助判断,避免在震荡行情中交易。
在异常行情下也可能被套。可设置适当的止损点,降低单笔亏损。
无法完美避免被反转所套。我们将继续优化机制和参数,使策略更加稳定。
策略优化方向
增加辅助指标判断,如ADX,MACD等,避免震荡行情的错误交易。
动态调整止损点。可以根据ATR来计算风险预期,设置合理的止损比率。
优化参数自适应能力。可以使用机器学习方法,让系统自动优化参数。
根据品种特性进行参数细调。比如加密货币适合更短周期的参数。
总结
该策略整体来说非常适合跟踪趋势行情。同时也增加了一定的突破交易机会。通过合理优化,可使策略在更多市场中稳定运行。我们将继续改进,努力把它打造成一个商业级的高质量量化策略。
策略源码
/*backtest
start: 2023-12-31 00:00:00
end: 2024-01-30 00:00:00
period: 1h
basePeriod: 15m
exchanges: [{"eid":"Futures_Binance","currency":"BTC_USDT"}]
*/

//@version=2
strategy(title = "Noro's Trend MAs Strategy v1.9 Extreme", shorttitle = "Trend MAs str 1.9 extreme", overlay=true, default_qty_type = strategy.percent_of_equity, default_qty_value=100.0, pyramiding=0)

//Settings
needlong = input(true, "long")
needshort = input(true, "short")
needstops = input(false, "stops")
stoppercent = input(5, defval = 5, minval = 1, maxval = 50, title = "Stop, %")
useohlc4 = input(false, defval = false, title = "Use OHLC4")
usefastsma = input(true, "Use fast MA Filter")
fastlen = input(5, defval = 5, minval = 1, maxval = 50, title = "fast MA Period")
slowlen = input(21, defval = 20, minval = 2, maxval = 200, title = "slow MA Period")
bars = input(2, defval = 2, minval = 0, maxval = 3, title = "Bars Q")
needbg = input(false, defval = false, title = "Need trend Background?")
needarr = input(false, defval = false, title = "Need entry arrows?")
needex = input(true, defval = true, title = "Need extreme? (crypto/fiat only!!!)")

src = useohlc4 == true ? ohlc4 : close

//PriceChannel 1
lasthigh = highest(src, slowlen)
lastlow = lowest(src, slowlen)
center = (lasthigh + lastlow) / 2

//PriceChannel 2
lasthigh2 = highest(src, fastlen)
lastlow2 = lowest(src, fastlen)
center2 = (lasthigh2 + lastlow2) / 2

//Trend
trend = low > center and low[1] > center[1] ? 1 : high < center and high[1] < center[1] ? -1 : trend[1]

//Bars
bar = close > open ? 1 : close < open ? -1 : 0
redbars = bars == 0 ? 1 : bars == 1 and bar == -1 ? 1 : bars == 2 and bar == -1 and bar[1] == -1 ? 1 : bars == 3 and bar == -1 and bar[1] == -1 and bar[2] == -1 ? 1 : 0
greenbars = bars == 0 ? 1 : bars == 1 and bar == 1 ? 1 : bars == 2 and bar == 1 and bar[1] == 1 ? 1 : bars == 3 and bar == 1 and bar[1] == 1 and bar[2] == 1 ? 1 : 0

//Signals
up = trend == 1 and (low < center2 or usefastsma == false) and (redbars == 1) ? 1 : 0
dn = trend == -1 and (high > center2 or usefastsma == false) and (greenbars == 1) ? 1 : 0

up2 = high < center and high < center2 and bar == -1 ? 1 : 0
dn2 = low > center and low > center2 and bar == 1 ? 0 : 0

//Lines
plot(center, color = blue, linewidth = 3, transp = 0, title = "Slow MA")
plot(center2, color = red, linewidth = 3, transp = 0, title = "PriceChannel 2")

//Arrows
plotarrow(up == 1 and needarr == true ? 1 : 0, colorup = black, colordown = black, transp = 0)
plotarrow(dn == 1 and needarr == true ? -1 : 0, colorup = black, colordown = black, transp = 0)

//Background
col = needbg == false ? na : trend == 1 ? lime : red
bgcolor(col, transp = 90)

//Alerts
alertcondition(up == 1, title='buy', message='Uptrend')
alertcondition(dn == 1, title='sell', message='Downtrend')

//Trading
stoplong = up == 1 and needstops == true ? close - (close / 100 * stoppercent) : stoplong[1]
stopshort = dn == 1 and needstops == true ? close + (close / 100 * stoppercent) : stopshort[1]

longCondition = up == 1 or (up2 == 1 and needex == true)
if (longCondition)
    strategy.entry("Long", strategy.long, needlong == false ? 0 : na)
    strategy.exit("Stop Long", "Long", stop = stoplong)

shortCondition = dn == 1
if (shortCondition)
    strategy.entry("Short", strategy.short, needshort == false ? 0 : na)
    strategy.exit("Stop Short", "Short", stop = stopshort)