该策略名称来源于其采用布林带和凯特纳通道两个指标构建交易信号。它监测价格突破通道边界的情况,在价格突破下行通道时做多,突破上行通道时做空。
策略原理
该策略结合使用布林带和凯特纳通道两个指标。布林带是以股价的移动平均线及其标准差构建的自适应通道。凯特纳通道则利用真实波幅计算通道范围。
策略的交易逻辑是,当收盘价格低于布林带下限和凯特纳通道下限时,采取做多头寻求反转;当收盘价格高于布林带上限和凯特纳通道上限时,采取做空头寻求反转。做多做空后设置止损和止盈退出。
优势分析
该策略结合布林带和凯特纳通道,能有效识别异常波动。同时利用双通道设定过滤条件,避免虚假信号。止损止盈设置也有利于风险控制。
相比单一使用布林带或凯特纳通道,该策略能过滤掉更多噪音,信号质量较高。双通道突破也使其能及时捕捉价格反转机会。
风险分析
该策略主要风险在于通道指标本身存在滞后。价格可能在通道边界触发信号前就开始反转。这会导致入场过晚,或在反弹中被套。
此外,止损设置过小也会增加被止损风险。止盈设置过大时则可能错过理想退出点。这需要根据市场情况调整参数。
优化方向
该策略可通过引入动量指标等辅助过滤条件优化。也可以测试不同参数组合寻找最佳参数。
加入自适应止损止盈机制是另一个优化方向。这可以帮助策略更好地适应市场环境的变化。
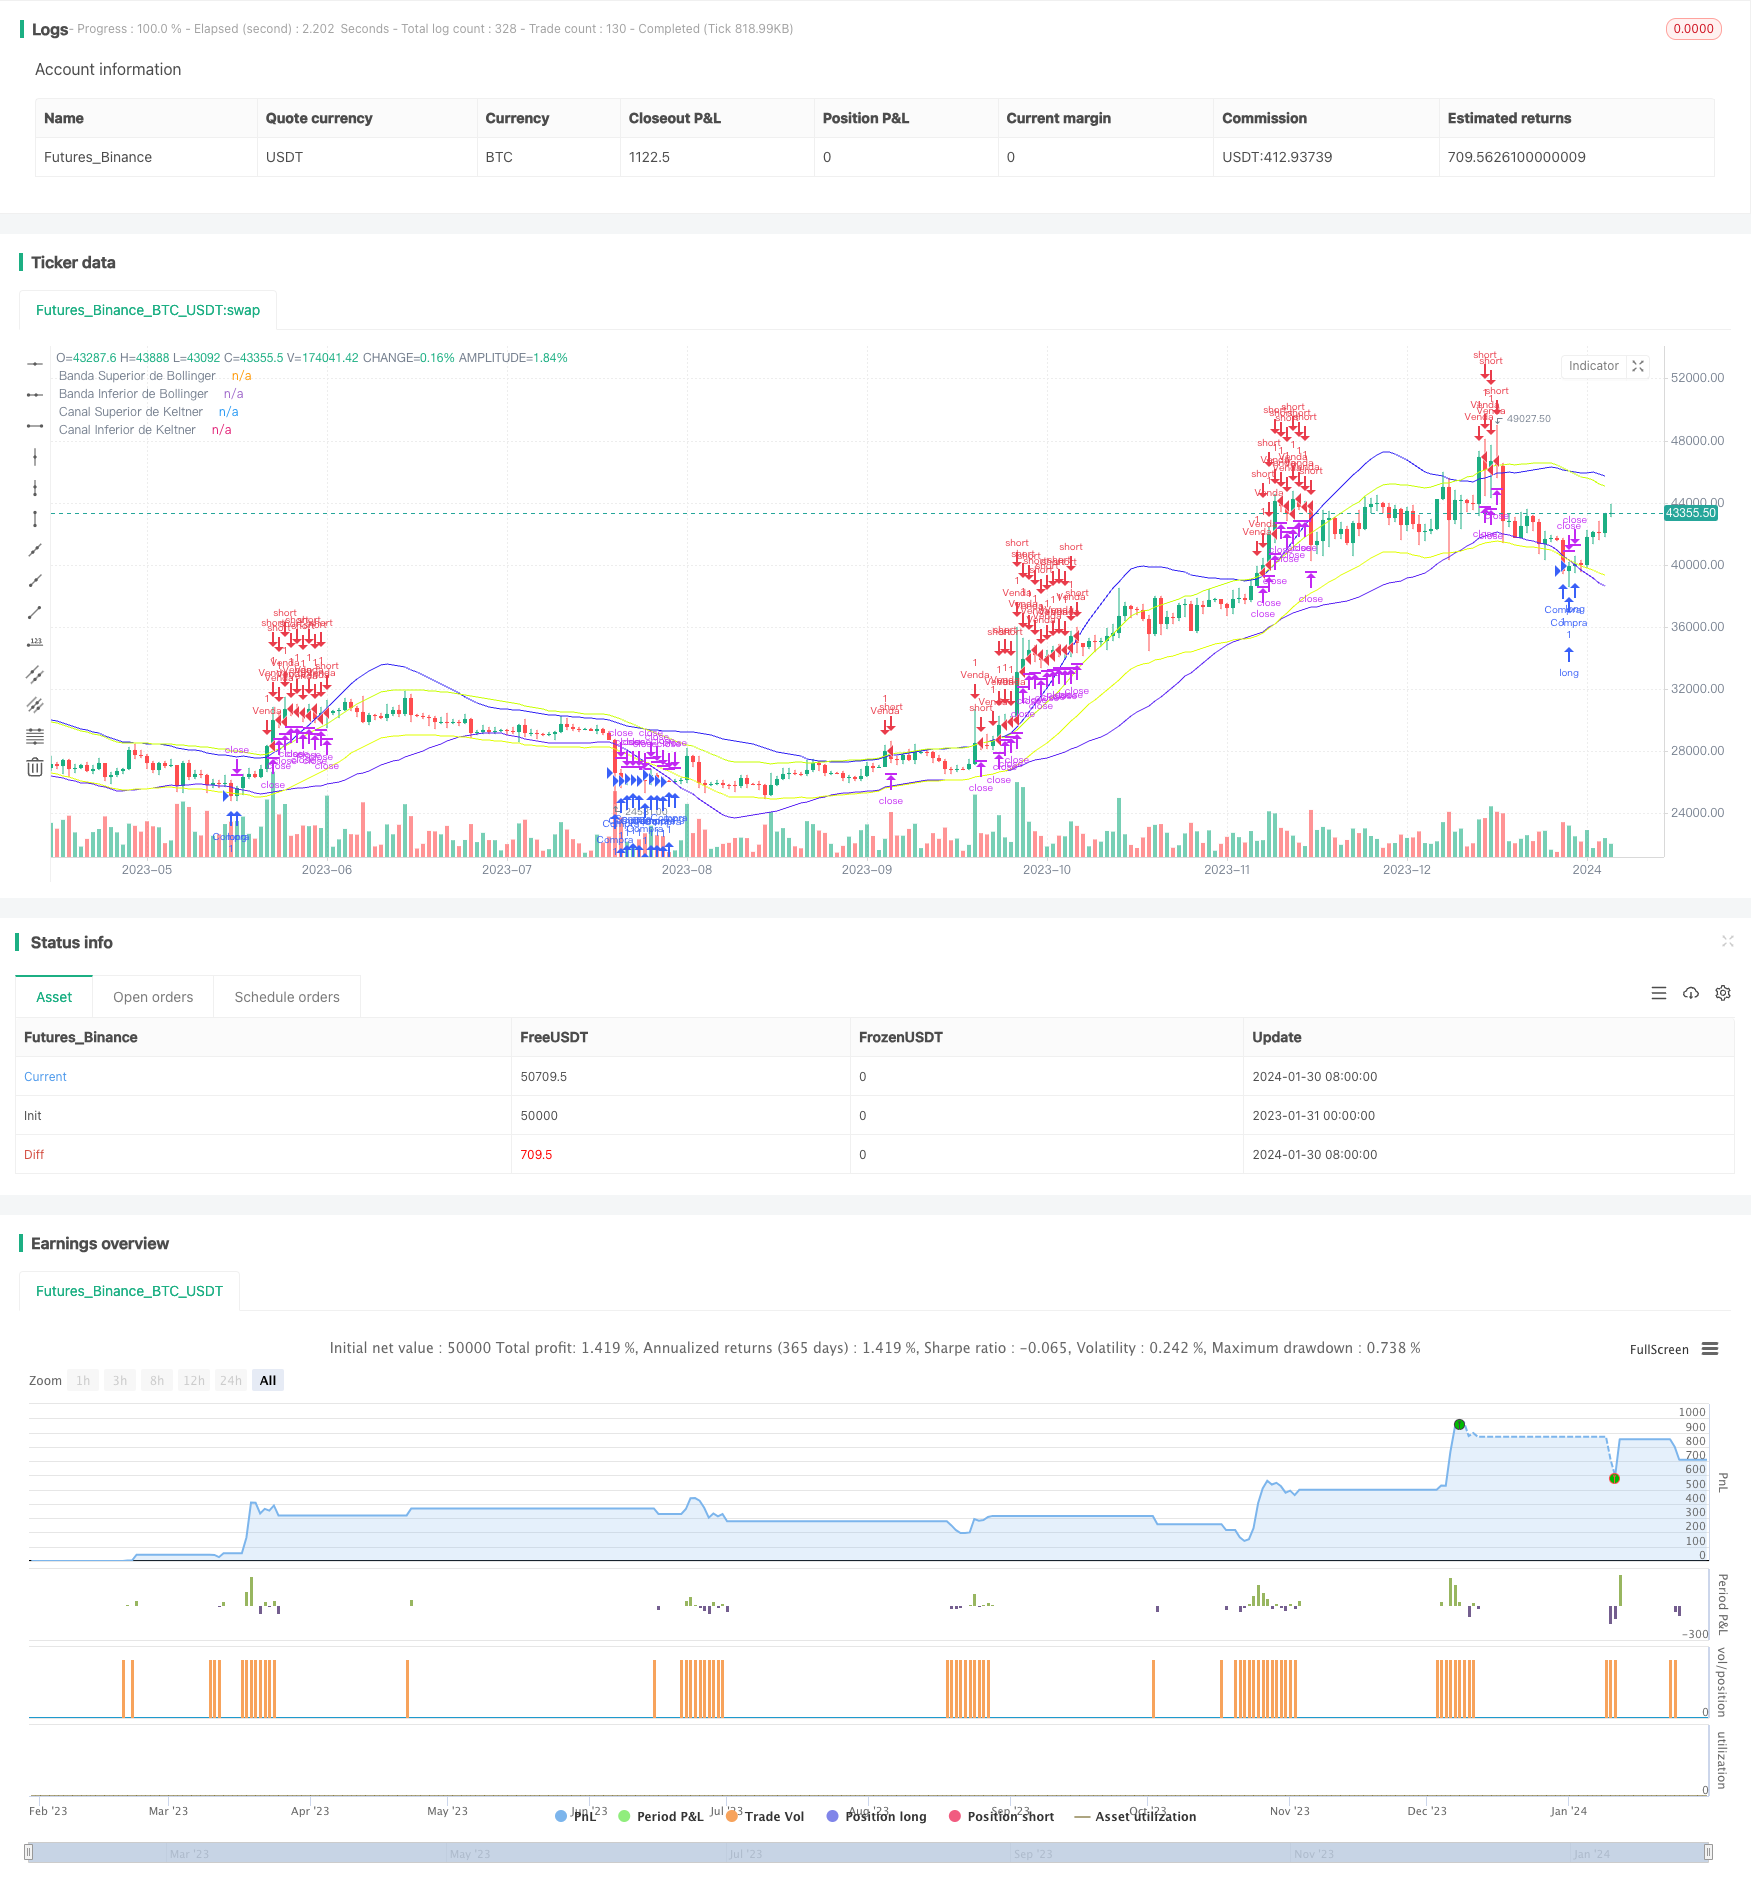
总结
该双通道突破策略整合布林带和凯特纳通道指标的优点,能有效识别反转机会。同时通过双通道过滤和止损止盈设置控制风险。它是一个质量较高、风险可控的量化交易策略。
策略源码
/*backtest
start: 2023-01-31 00:00:00
end: 2024-01-31 00:00:00
period: 1d
basePeriod: 1h
exchanges: [{"eid":"Futures_Binance","currency":"BTC_USDT"}]
*/

//@version=4
strategy("Estratégia de Compra/Venda BB e KC", overlay=true)

// Parâmetros das Bandas de Bollinger
bollinger_length = input(20, title="Comprimento das Bandas de Bollinger", minval=1)
bollinger_deviation = input(2.0, title="Desvio Padrão das Bandas de Bollinger", minval=0.1)

// Parâmetros dos Canais de Keltner
keltner_length = input(20, title="Comprimento dos Canais de Keltner", minval=1)
atr_multiplier = input(1.5, title="Multiplicador ATR dos Canais de Keltner", minval=0.1)

// Take Profit e Stop Loss em termos financeiros
take_profit = input(10.0, title="Take Profit (em $)", step=1)
stop_loss = input(20.0, title="Stop Loss (em $)", step=1)

// Cálculos das Bandas de Bollinger
basis_bb = sma(close, bollinger_length)
dev_bb = sma(stdev(close, bollinger_length), bollinger_length)
upper_bb = basis_bb + dev_bb * bollinger_deviation
lower_bb = basis_bb - dev_bb * bollinger_deviation

// Cálculos dos Canais de Keltner
basis_kc = sma(close, keltner_length)
atr_kc = sma(atr(keltner_length), keltner_length)
upper_kc = basis_kc + atr_multiplier * atr_kc
lower_kc = basis_kc - atr_multiplier * atr_kc

// Condição de Compra
buy_condition = close < lower_bb and close < lower_kc

// Condição de Venda
sell_condition = close > upper_bb and close > upper_kc

// Estratégia de Compra/Venda com TP e SL
if (buy_condition)
    strategy.entry("Compra", strategy.long)
    strategy.exit("Take Profit/Stop Loss", from_entry="Compra", profit=take_profit, loss=stop_loss)
if (sell_condition)
    strategy.entry("Venda", strategy.short)
    strategy.exit("Take Profit/Stop Loss", from_entry="Venda", profit=take_profit, loss=stop_loss)

// Plot das Bandas de Bollinger e dos Canais de Keltner
plot(upper_bb, color=color.rgb(47, 33, 243), title="Banda Superior de Bollinger")
plot(lower_bb, color=color.rgb(89, 33, 243), title="Banda Inferior de Bollinger")
plot(upper_kc, color=color.rgb(200, 255, 0), title="Canal Superior de Keltner")
plot(lower_kc, color=color.rgb(225, 255, 0), title="Canal Inferior de Keltner")