概述
本策略名称为“量化交易动量方向收敛策略”,是根据William Blau在其著作《动量,方向和收敛》(Momentum, Direction and Divergence)一书中描述的技术指标而设计的量化交易策略。该策略聚焦于动量、方向和收敛这三个关键层面,通过计算股票价格的动量指标,判断市场趋势方向,并寻找价格和指标之间的背离现象,以获取交易机会。
策略原理
本策略的核心指标是应急动量指数(Ergotic TSI),它计算公式如下:
Val1 = 100 * EMA(EMA(EMA(价格变化量,r),s),u)

Val2 = EMA(EMA(EMA(价格变化量的绝对值,r),s),u)

Ergotic TSI = 如果Val2不等于0,则为Val1/Val2,否则为0
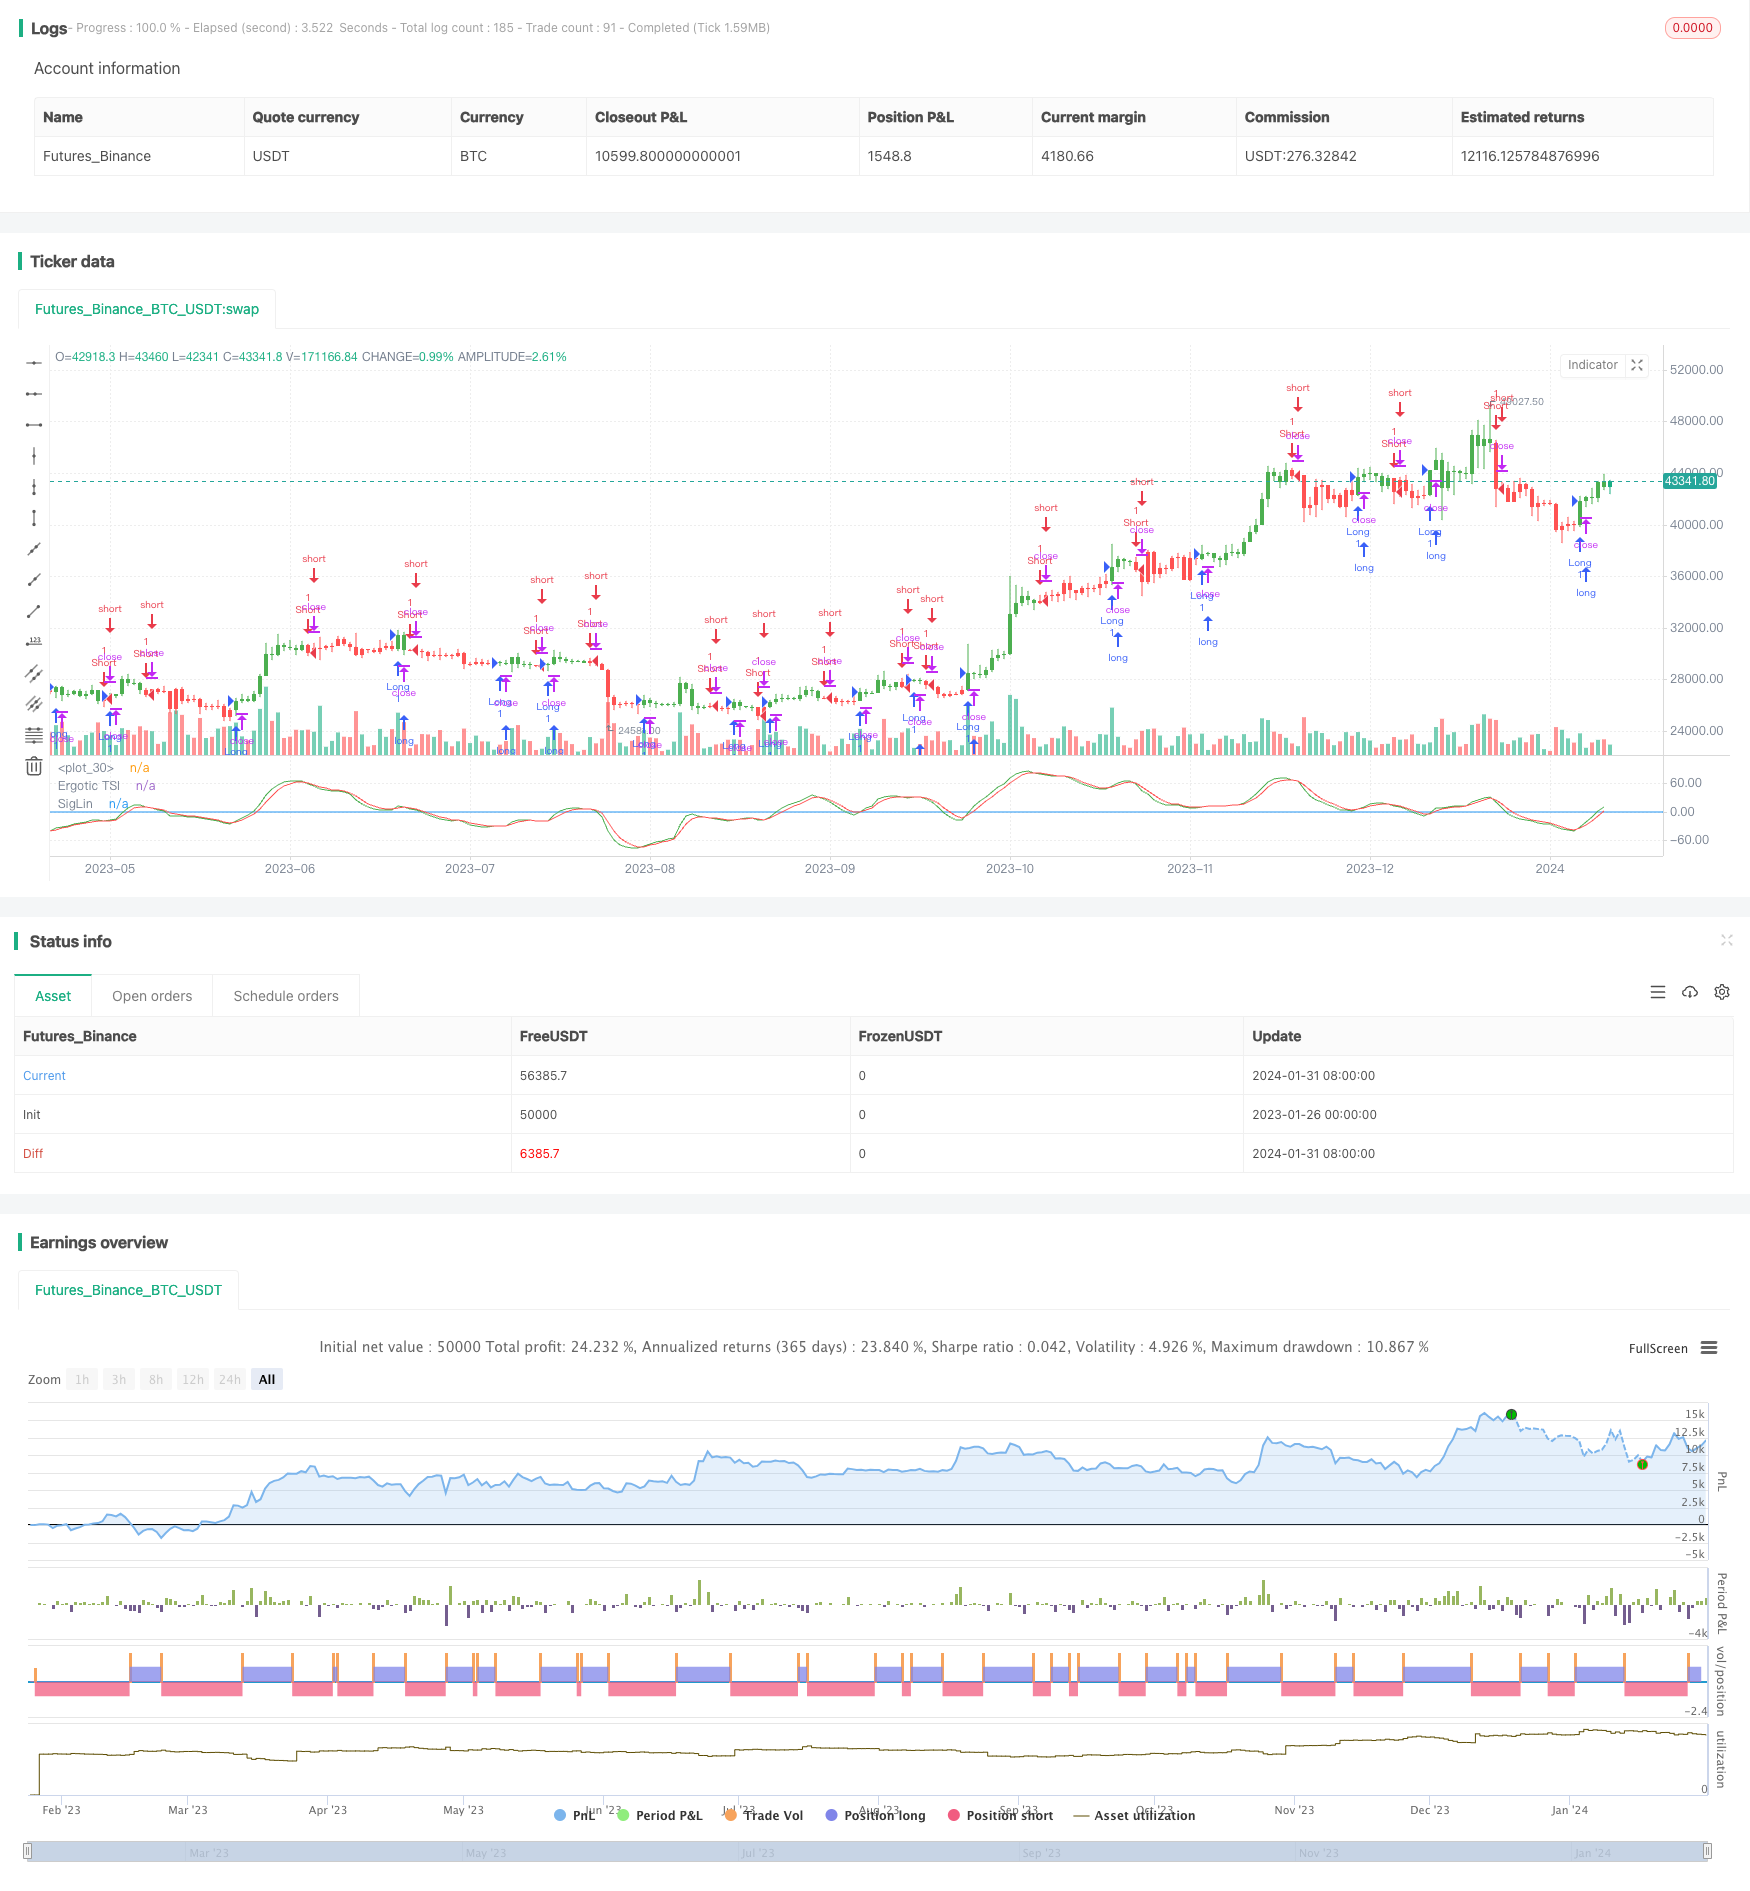
其中,r、s、u为平滑参数。该指标反映了价格变化量占价格变化量绝对值的比例,属于动量震荡指标。然后我们计算Ergotic TSI的EMA平滑移动平均线作为信号线。当TSI上穿信号线时做多,下穿信号线时做空。
优势分析
本策略主要有以下优势:
1. 捕捉价格变化趋势的能力强
2. 对价格震荡有很好的过滤作用
3. 具有较好的背离特征
4. 参数设置灵活,可调整平滑度
风险分析
本策略也存在一些风险:
1. 在趋势反转点时会产生错误信号
2. 参数设置不当会错过交易机会或增加虚假信号
3. 需要适当调整参数以适应不同品种和交易环境
可以通过优化参数,组合其他指标进行确认,设定止损来控制风险。
优化方向
本策略可以从以下几个方面进行优化:
1. 测试不同的价格输入,如开盘价、收盘价、中间价等
2. 调整平滑参数r、s、u的值,寻找最佳参数组合
3. 增加其他指标或过滤条件进一步确认信号
4. 设定止损点和退出机制
总结
本策略综合考虑了动量变化、趋势判断和背离特征,可以有效捕捉趋势机会。通过参数优化、信号过滤及风险控制的手段,可以获得较好的策略表现。总体来说,该策略设计得较为合理,值得进一步研究与实践。
策略源码
/*backtest
start: 2023-01-26 00:00:00
end: 2024-02-01 00:00:00
period: 1d
basePeriod: 1h
exchanges: [{"eid":"Futures_Binance","currency":"BTC_USDT"}]
*/

//@version = 2
////////////////////////////////////////////////////////////
//  Copyright by HPotter v1.0 13/12/2016
// r - Length of first EMA smoothing of 1 day momentum        4
// s - Length of second EMA smoothing of 1 day smoothing      8
// u- Length of third EMA smoothing of 1 day momentum         6
// Length of EMA signal line                                  3
// Source of Ergotic TSI                                      Close
//
// This is one of the techniques described by William Blau in his book "Momentum,
// Direction and Divergence" (1995). If you like to learn more, we advise you to
// read this book. His book focuses on three key aspects of trading: momentum,
// direction and divergence. Blau, who was an electrical engineer before becoming
// a trader, thoroughly examines the relationship between price and momentum in
// step-by-step examples. From this grounding, he then looks at the deficiencies
// in other oscillators and introduces some innovative techniques, including a
// fresh twist on Stochastics. On directional issues, he analyzes the intricacies
// of ADX and offers a unique approach to help define trending and non-trending periods.
//
// You can use in the xPrice any series: Open, High, Low, Close, HL2, HLC3, OHLC4 and ect...
// You can change long to short in the Input Settings
// Please, use it only for learning or paper trading. Do not for real trading.
////////////////////////////////////////////////////////////
strategy(title="Ergotic TSI Strategy Backtest")
r = input(4, minval=1)
s = input(8, minval=1)
u = input(6, minval=1)
SmthLen = input(3, minval=1)
reverse = input(false, title="Trade reverse")
hline(0, color=blue, linestyle=line)
xPrice = close
xPrice1 = xPrice - xPrice[1]
xPrice2 = abs(xPrice - xPrice[1])
xSMA_R = ema(ema(ema(xPrice1,r), s),u)
xSMA_aR = ema(ema(ema(xPrice2, r), s),u)
Val1 = 100 * xSMA_R
Val2 = xSMA_aR
xTSI = iff (Val2 != 0, Val1 / Val2, 0)
xEMA_TSI = ema(xTSI, SmthLen)
pos = iff(xTSI > xEMA_TSI, 1,
	   iff(xTSI < xEMA_TSI, -1, nz(pos[1], 0)))
possig = iff(reverse and pos == 1, -1,
          iff(reverse and pos == -1, 1, pos))
if (possig == 1)
    strategy.entry("Long", strategy.long)
if (possig == -1)
    strategy.entry("Short", strategy.short)
barcolor(possig == -1 ? red: possig == 1 ? green : blue )
plot(xTSI, color=green, title="Ergotic TSI")
plot(xEMA_TSI, color=red, title="SigLin")