概述
威利旺卡突破策略是一种集成多个技术指标分析的突破交易策略,主要利用 RSI, Stochastics, EMA 和价格形态来识别买入卖出机会。
策略原理
该策略主要基于以下几个关键指标进行判断:
- RSI 指标 - 当 RSI 下破 28 时产生买入信号,当 RSI 上破 72 时产生卖出信号。
- Stochastics 指标 - 当快速 K 线从下向上突破慢速 D 线时为买入信号。
- EMA 指标 - 多头趋势中价格上穿 EMA 时为买入信号,空头趋势中价格下穿 EMA 时为卖出信号。
- 价格形态 - 在关键支持或关键阻力位置形成锤头和吞噬形态时产生买入和卖出信号。
当上述多个条件同时触发时,就会产生更有效的买入或卖出信号。
该策略采用 Breakout 突破思想,在趋势反转点位置进行突破交易,旨在捕捉中间趋势的加速阶段,实现超额收益。
策略优势
该策略集成多种分析工具,对市场行情判断比较全面和准确,主要优势有:
- 更高的胜率和盈亏比 - 结合多种技术指标分析,提高判断准确性。
- 自动避让震荡市 - RSI 等指标识别超买超卖情况,降低非趋势交易风险。
- 有效控制风险 - 适时止损和止盈,避免被套牢风险。
策略风险
该策略也存在一些风险需要防范:
- 参数优化风险 - RSI 参数,MA 参数等需要针对不同品种和时间周期进行优化,否则会影响盈利。
- 追涨杀跌风险 - 突破信号会有一定滞后,需要注意避免在趋势末端追涨杀跌。
- 停损风险 - 适时止损很关键,否则可能扩大亏损范围。
对策是合理优化参数,严格遵守止损规则,在价格再次突破 EMA 后再次建立新仓位。
策略优化方向
该策略主要可以从以下几个方面进行优化:
- 优化 RSI 参数 - 针对不同品种找到最佳 RSI 长度参数和超买超卖阈值。
- 集成更多指标 - 结合 MACD, SAR, Bolinger 等指标进一步提升判断准确性。
- 动态止损和止盈 - 利用 ATR 和振幅比来实现动态止损止盈。
- 避让重大事件风险 - 重大经济数据和事件前后避让交易,降低市场波动带来的风险。
总结
总的来说,威利旺卡突破策略是一种集成化的趋势反转突破交易策略。它适用于有明显趋势特征的品种,通过在关键点位发出交易信号捕捉中期趋势。该策略可扩展性强,具有较高的实战价值。
策略源码
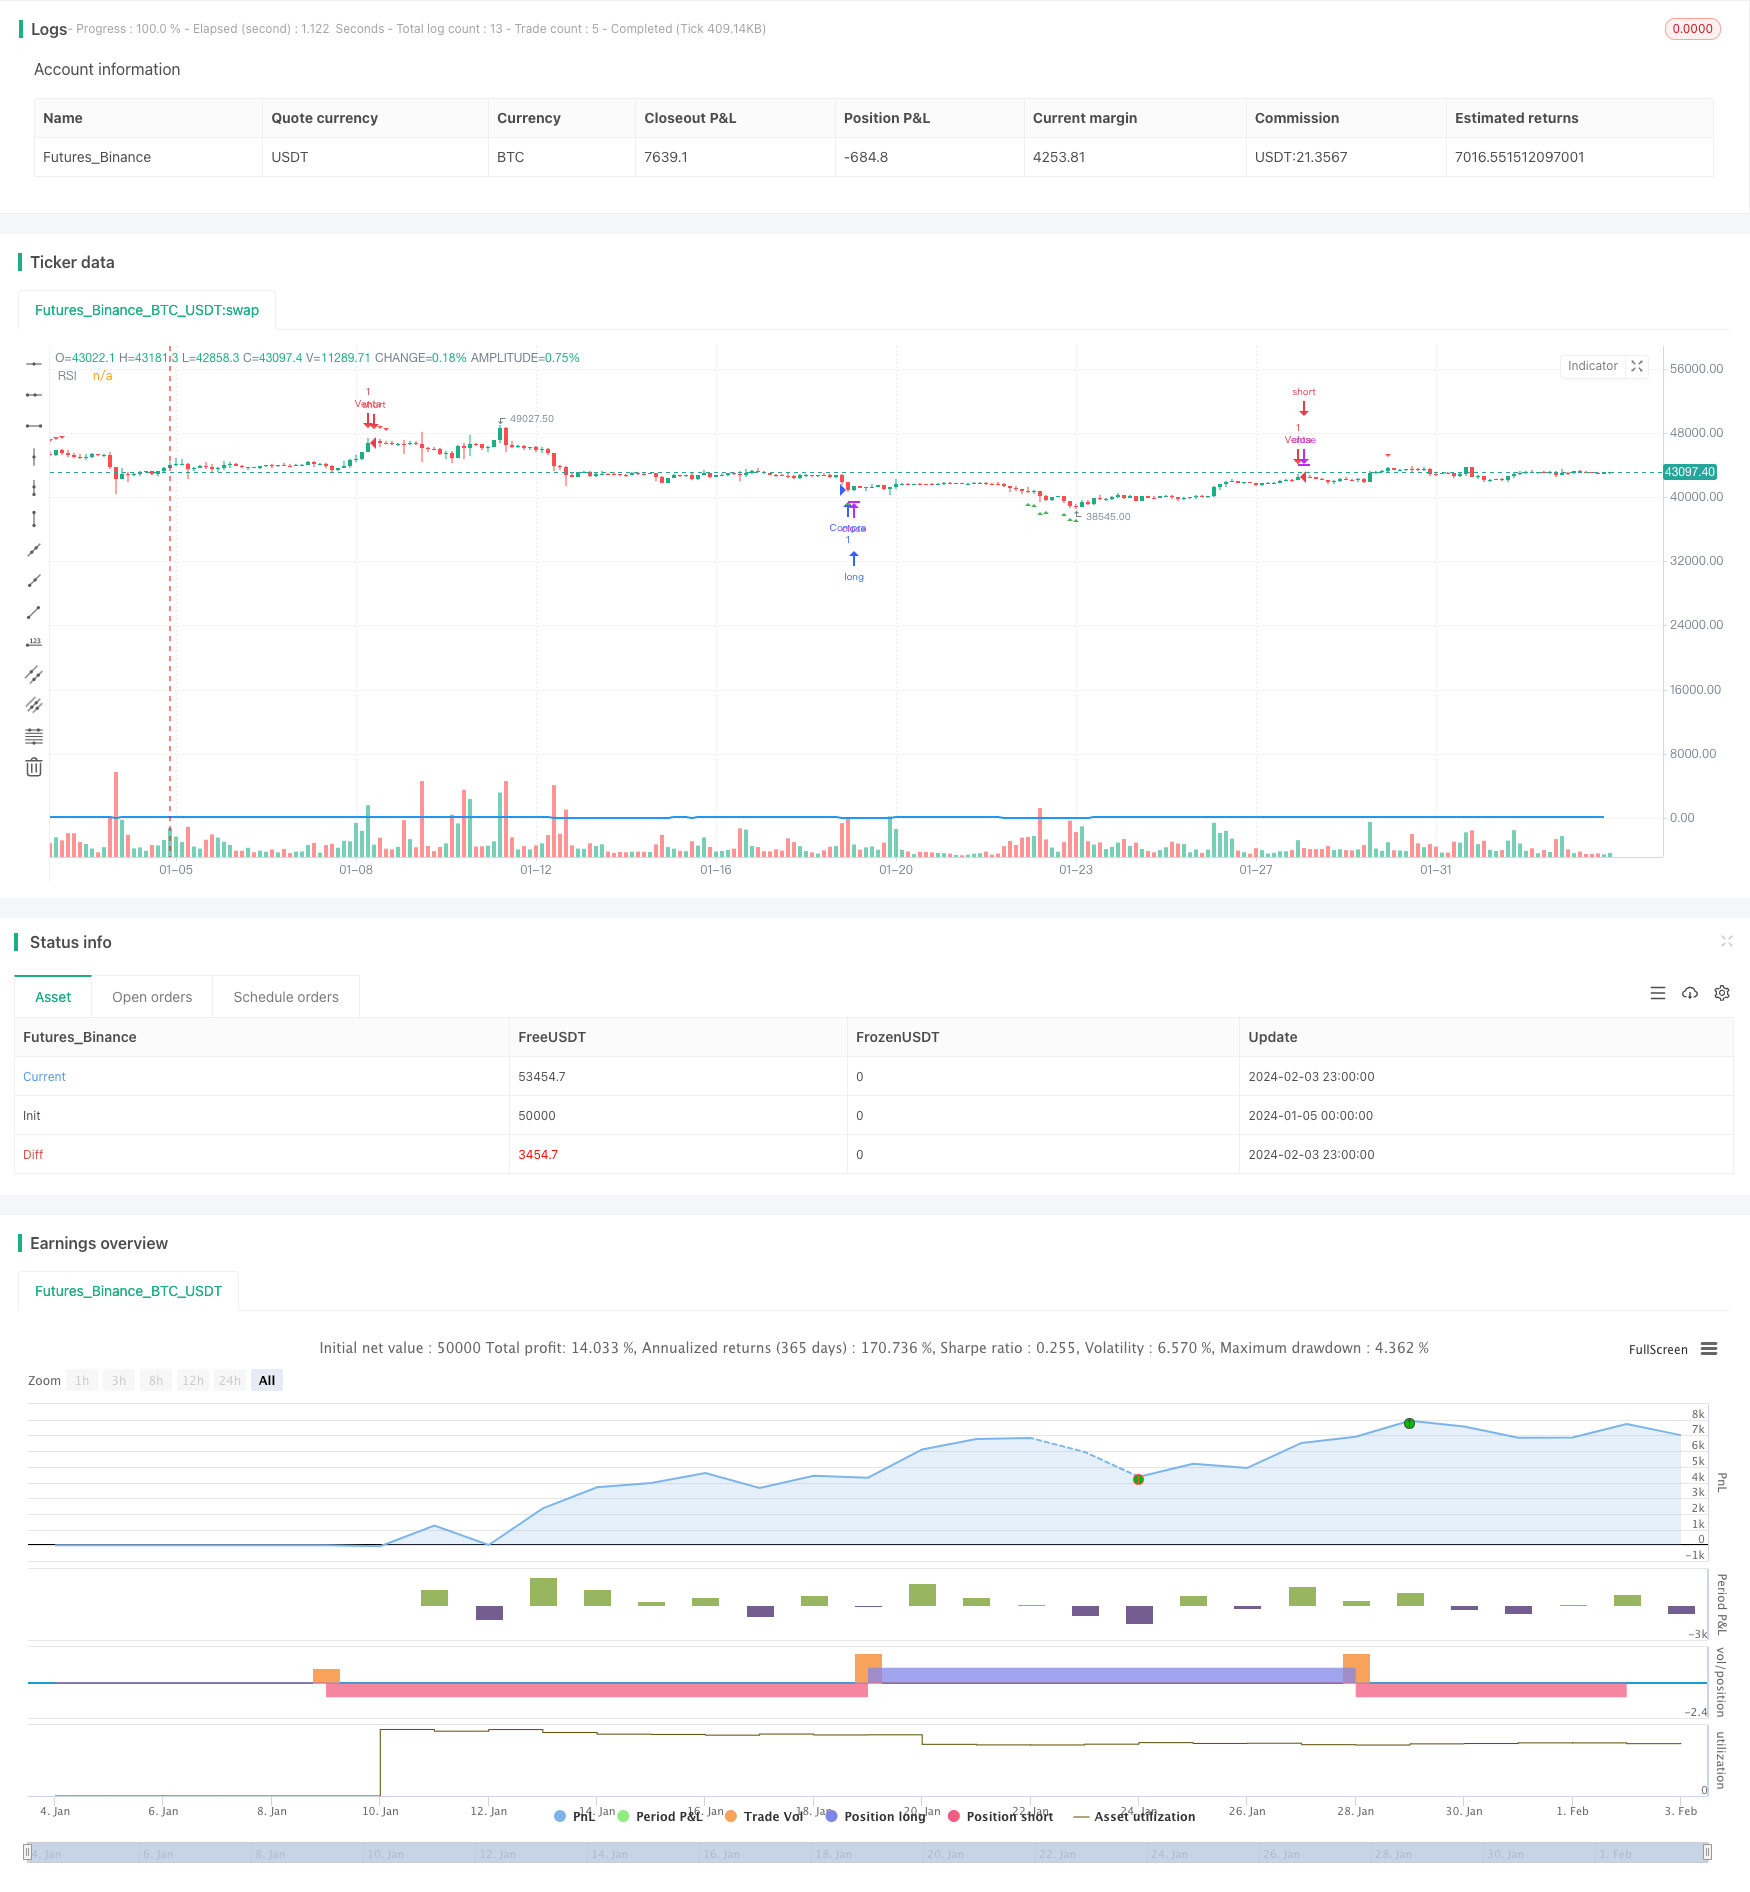
/*backtest
start: 2024-01-05 00:00:00
end: 2024-02-04 00:00:00
period: 3h
basePeriod: 15m
exchanges: [{"eid":"Futures_Binance","currency":"BTC_USDT"}]
*/

//@version=5
strategy("Mi Estrategia", overlay=true)

// Parámetros
rsiLength = input(14, title="RSI Length")
overboughtLevel = 72
oversoldLevel = 28
showRsi = input(true, title="Mostrar RSI en el gráfico")

// Indicadores
rsiValue = ta.rsi(close, rsiLength)

// Condiciones de Compra y Venta
longCondition = rsiValue <= oversoldLevel
shortCondition = rsiValue >= overboughtLevel

// Ejecutar Operaciones
if (longCondition)
    strategy.entry("Compra", strategy.long)

if (shortCondition)
    strategy.entry("Venta", strategy.short)

// Configuración de la Estrategia
// Eliminamos las líneas relacionadas con Take Profit y Stop Loss

// Líneas en el Gráfico (Opcional)
plot(showRsi ? rsiValue : na, "RSI", color=color.blue, linewidth=2)

// Etiquetas de Buy y Sell en el RSI
plotshape(longCondition, color=color.green, style=shape.triangleup, title="Buy en RSI", location=location.belowbar)
plotshape(shortCondition, color=color.red, style=shape.triangledown, title="Sell en RSI", location=location.abovebar)