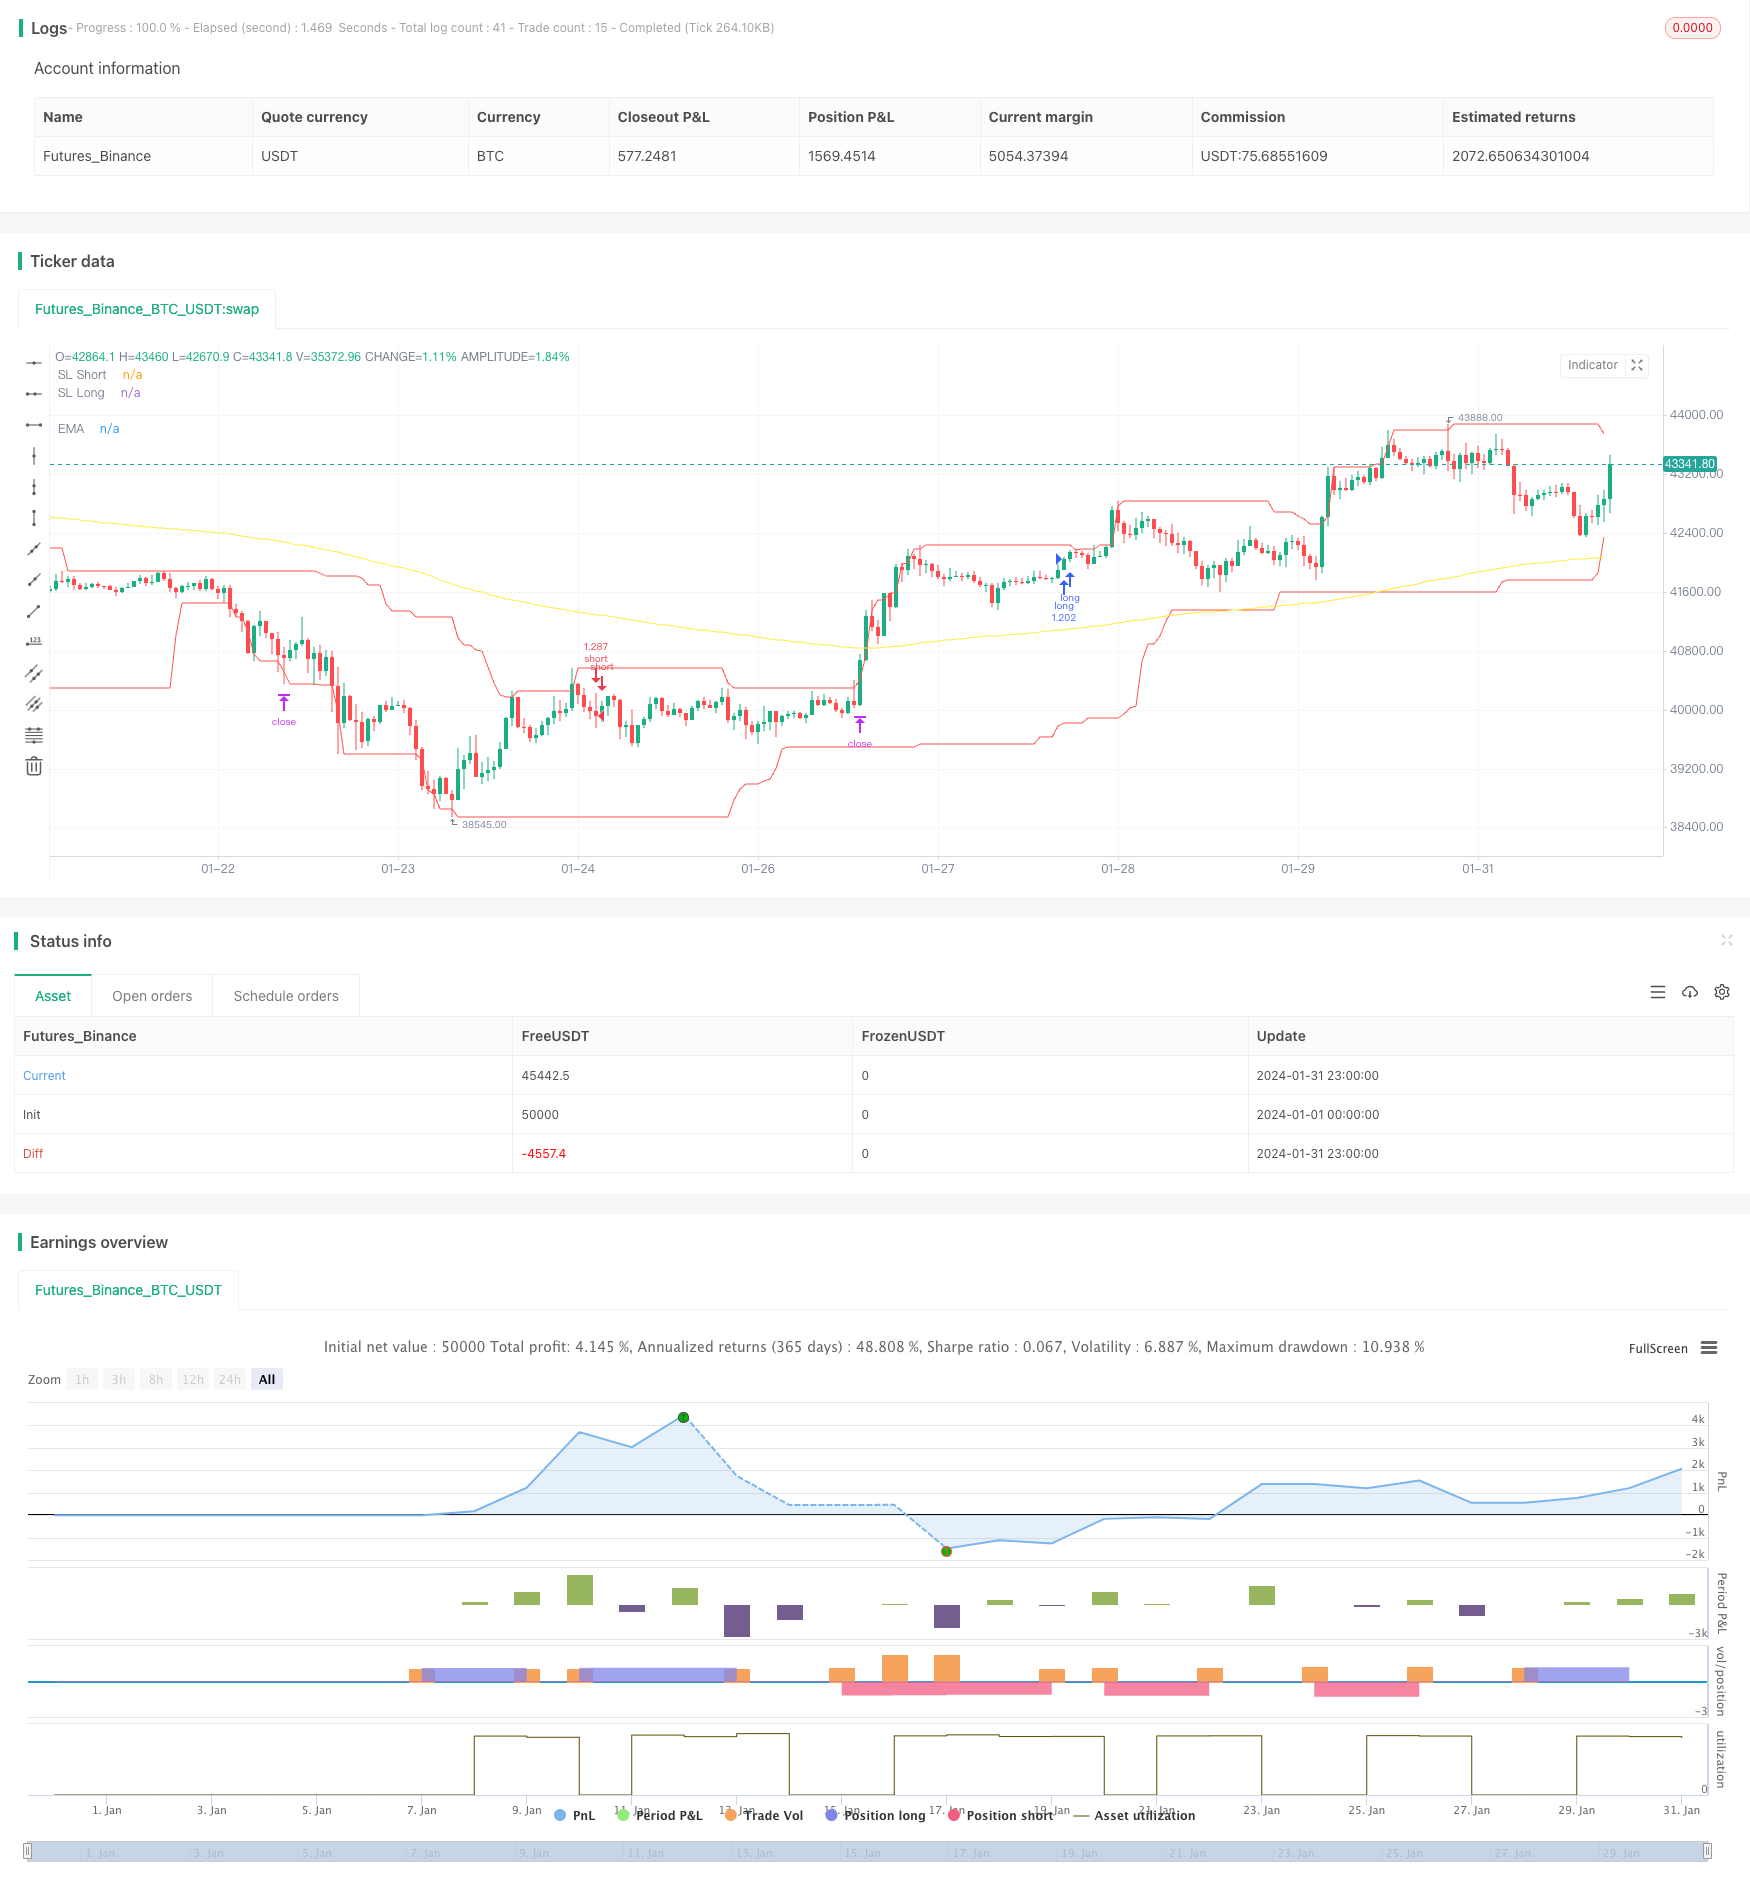
概述
该策略通过计算MACD指标及其移动平均线信号线的交叉来确定趋势方向,并结合EMA指标判断当前趋势强弱,实现趋势追踪。当MACD线从下向上突破信号线时做多,从上向下突破做空,同时EMA线也可判断趋势强弱从而过滤假突破。
策略原理
该策略主要基于MACD指标判断趋势方向和入场时机。MACD线突破信号线表明价格趋势发生反转,因此根据突破方向来判断做多做空。具体判断逻辑是,当收盘价高于EMA平均线,且MACD线从下方突破信号线时,做多;当收盘价低于EMA平均线,且MACD线从上方向下突破信号线时,做空。
EMA均线的作用是辅助判断趋势,如果价格高于EMA均线说明处于上涨趋势,此时MACD下方突破容易形成运行的黄金交叉信号;如果价格低于EMA均线说明处于下跌趋势,此时MACD上方突破容易形成死叉信号。EMA的长度也决定了判断趋势的中长期程度。
通过上述方式,可以在价格开始反转形成新趋势时及时进入场内,实现趋势追踪效果。
优势分析
该策略结合双重判断条件,既考虑到价格的趋势方向,又利用指标判断具体的入场时机,避免假突破的风险,增强了策略的可靠性。相比单一采用MACD指标,该策略可以更准确判断新趋势的启动。
EMA均线的运用也使策略在一定程度上过滤掉短期波动的影响,锁定中长线趋势。这对于发挥MACD指标判断反转的效果很有帮助。
此外,策略同时设定做多和做空条件,可以适用于涨跌莲花的市场环境,这也增强了策略的适应性。
风险分析
该策略主要风险在于MACD指标本身判断 Fakeout 的概率较大,信号可能会被错误识别。此时就需要EMA均线的辅助功能,但是在特殊行情中也有失效的可能。
此外,策略中采用了盈亏比例来设置止损止盈条件,这存在一定程度的主观性,如果设置不当也会影响策略效果。
最后,策略中简单设置了开仓数量为100%的账户权益,没有考虑资金管理问题,这在实盘中也存在一定的风险。
优化方向
该策略主要有以下几个优化方向:
增加其他指标判断,形成多个指标组合,可以进一步避免MACD发出错误信号的概率。例如可以考虑KDJ、BOLL等。
EMA均线长度可以进行多组合优化,找到判断趋势方向最佳参数。
MACD参数也可以进行进一步优化,找到确定反转时机最准确的参数取值。
增加资金管理模块,例如盈亏比例可以作为动态输入,也可以设置滑点止损等。
测试不同品种合约的效果,寻找最匹配的交易品种。例如加密货币、股指期货等。
总结
该MACD EMA黄金交叉趋势追踪策略整体来说较为简单实用,通过双重指标判断确保信号的可靠性,设置合理的止损止盈方式锁定利润。主要优化空间在参数选择、指标组合、资金管理等方面。如果进一步优化测试,相信该策略可以成为高效的趋势追踪策略之一。
/*backtest
start: 2024-01-01 00:00:00
end: 2024-01-31 23:59:59
period: 1h
basePeriod: 15m
exchanges: [{"eid":"Futures_Binance","currency":"BTC_USDT"}]
*/

//@version=4

strategy(title="MACD EMA Strategy", shorttitle="MACD EMA STRAT", overlay = true, pyramiding = 0, max_bars_back=3000, calc_on_order_fills = false, commission_type =  strategy.commission.percent, commission_value = 0, default_qty_type = strategy.percent_of_equity, default_qty_value = 100, initial_capital=5000, currency=currency.USD)

// Time Range
FromMonth=input(defval=1,title="FromMonth",minval=1,maxval=12)
FromDay=input(defval=1,title="FromDay",minval=1,maxval=31)
FromYear=input(defval=2020,title="FromYear",minval=2016)
ToMonth=input(defval=1,title="ToMonth",minval=1,maxval=12)
ToDay=input(defval=1,title="ToDay",minval=1,maxval=31)
ToYear=input(defval=9999,title="ToYear",minval=2017)
start=timestamp(FromYear,FromMonth,FromDay,00,00)
finish=timestamp(ToYear,ToMonth,ToDay,23,59)
window()=>true

// STEP 2:
// See if this bar's time happened on/after start date
afterStartDate = true

//EMA
emasrc = close
res = input(title="EMA Timeframe", type=input.resolution, defval="15")
len1 = input(title="EMA Length", type=input.integer, defval=206)
col1 = color.yellow
// Calculate EMA
ema1 = ema(emasrc, len1)
emaSmooth = security(syminfo.tickerid, res, ema1, barmerge.gaps_on, barmerge.lookahead_off)
// Draw EMA
plot(emaSmooth, title="EMA", linewidth=1, color=col1)

//MACD
fast_length = input(title="Fast Length", type=input.integer, defval=15)
slow_length = input(title="Slow Length", type=input.integer, defval=24)
src = input(title="Source", type=input.source, defval=close)
signal_length = input(title="Signal Smoothing", type=input.integer, minval = 1, maxval = 50, defval = 9)
sma_source = input(title="Simple MA (Oscillator)", type=input.bool, defval=true)
sma_signal = input(title="Simple MA (Signal Line)", type=input.bool, defval=true)
zeroline = 0

// Plot colors
col_grow_above = #26A69A
col_grow_below = #FFCDD2
col_fall_above = #B2DFDB
col_fall_below = #EF5350
col_macd = #0094ff
col_signal = #ff6a00

// Calculating
fast_ma = sma_source ? sma(src, fast_length) : ema(src, fast_length)
slow_ma = sma_source ? sma(src, slow_length) : ema(src, slow_length)
macd = fast_ma - slow_ma
signal = sma_signal ? sma(macd, signal_length) : ema(macd, signal_length)
hist = macd - signal
//plot(hist, title="Histogram", style=plot.style_columns, color=(hist>=0 ? (hist[1] < hist ? col_grow_above : col_fall_above) : (hist[1] < hist ? col_grow_below : col_fall_below) ), transp=0 )
//plot(macd, title="MACD", color=col_macd, transp=0)
//plot(signal, title="Signal", color=col_signal, transp=0)
//plot(zeroline, title="Zero Line", color=color.black, transp=0)

///////////////////////////LONG////////////////////////////////////////////////////////////////////

enablelong = input(true, title="Enable long?")

//Long Signal
upcondition = close > emaSmooth and close[1] > emaSmooth[1]
macdunderhis = macd < zeroline
macdcrossup = crossover(macd, signal)

longcondition = upcondition and macdunderhis and macdcrossup

//strategy buy long
if (longcondition) and (afterStartDate) and strategy.opentrades < 1 and (enablelong == true)
    strategy.entry("long", strategy.long)

//////////////////////////////////////SHORT//////////////////////////////////////////////////////////////////////////////////

enableshort = input(true, title="Enable short?")

//Short Signal
downcondition = close < emaSmooth and close[1] < emaSmooth[1]
macdoverhis = macd > zeroline
macdcrosunder = crossunder(macd, signal)

shortcondition = downcondition and macdoverhis and macdcrosunder

//strategy buy short
if (shortcondition) and (afterStartDate) and strategy.opentrades < 1 and (enableshort == true)
    strategy.entry("short", strategy.short)


//////////////////////////////////////EXIT CONDITION//////////////////////////////////////////////////////////////////////////////////
bought = strategy.position_size[1] < strategy.position_size
sold = strategy.position_size[1] > strategy.position_size
barsbought = barssince(bought)
barssold = barssince(sold)
//////LOWEST LOW//////
//Lowest Low LONG
profitfactorlong = input(title="ProfitfactorLong", type=input.float, step=0.1, defval=1.9)
loLen = input(title="Lowest Low Lookback", type=input.integer,
  defval=46, minval=2)
stop_level_long = lowest(low, loLen)[1]

if strategy.position_size>0
    profit_level_long = strategy.position_avg_price + ((strategy.position_avg_price - stop_level_long[barsbought])*profitfactorlong)
    strategy.exit(id="TP/ SL", stop=stop_level_long[barsbought], limit=profit_level_long)

//Lowest Low SHORT
profitfactorshort = input(title="ProfitfactorShort", type=input.float, step=0.1, defval=2.1)
highLen = input(title="highest high lookback", type=input.integer,
  defval=25, minval=2)
stop_level_short = highest(high, highLen)[1]

if strategy.position_size<0
    profit_level_short = strategy.position_avg_price - ((stop_level_short[barssold] - strategy.position_avg_price)*profitfactorshort)
    strategy.exit(id="TP/ SL", stop=stop_level_short[barssold], limit=profit_level_short)

//PLOTT TP SL
plot(stop_level_long, title="SL Long", linewidth=1, color=color.red)
plot(stop_level_short, title="SL Short", linewidth=1, color=color.red)