概述
该策略采用霍德里克-普雷斯科特(Hodrick-Prescott,HP)滤波器平滑价格,提取价格趋势线。然后基于用户定义的时间范围计算自定义加权平均价格(VWAP)。当价格高于趋势线时做多,低于时做空。同时结合ATR止损确保交易风险可控。
策略原理
使用HP滤波器提取价格趋势线。HP滤波器通过优化方法提取价格的长期趋势成分,滤除短期波动干扰。
基于用户自定义的时间范围计算VWAP。VWAP能更准确反映不同周期下的平均价格。
当价格高于HP趋势线时满足做多条件;当价格低于HP趋势线时满足做空条件。这样能捕捉价格自下而上的突破或自上而下的突破。
ATR止损结合承担合理风险,避免亏损过大。
优势分析
采用HP滤波器提取价格趋势,相比MA等指标更为平滑,避免被短期价格波动误导。
自定义VWAP周期,更灵活适应市场周期变化。
根据趋势方向交易,符合趋势交易理念,胜率较高。
ATR止损控制单笔亏损,避免亏损过大。
多种参数可调整空间大,可针对不同市场进行优化。
风险与对策
在震荡盘整理中可能出现止损频繁被击中。可适当放宽止损范围。
趋势末期 ClientRawResponse常出现回调试探性突破使策略被套。应结合其他指标判断趋势末期,及时平仓。
VWAP周期设置不当可能错过更有效的交易机会。应配合趋势指标动态调整VWAP周期。
优化方向
1.HP滤波器参数λ可调整平滑强度。λ值大时趋势线更平滑,更有利于捕捉长线趋势;λ值小时响应价格变化更敏感,更适合捕捉中短线机会。
ATR倍数可调整止损范围。可配合λ参数优化,λ值大时适当扩大止损范围;λ值小可缩小止损范围锁定更多利润。
风险回报比例(R:R)直接影响盈亏比。可测试不同倍数情况下回撤控制和盈利能力。
总结
该策略整体采用趋势跟踪思路设计。通过多种参数设置可以针对长中短不同时间周期进行优化,胜率和盈利能力都较强。风险控制方面也做了一定考虑,能有效保证单笔亏损不会过大。总体而言,该策略利用较科学的方法提取价格趋势特征,再结合参数优化空间较大的特点,应用前景较好。
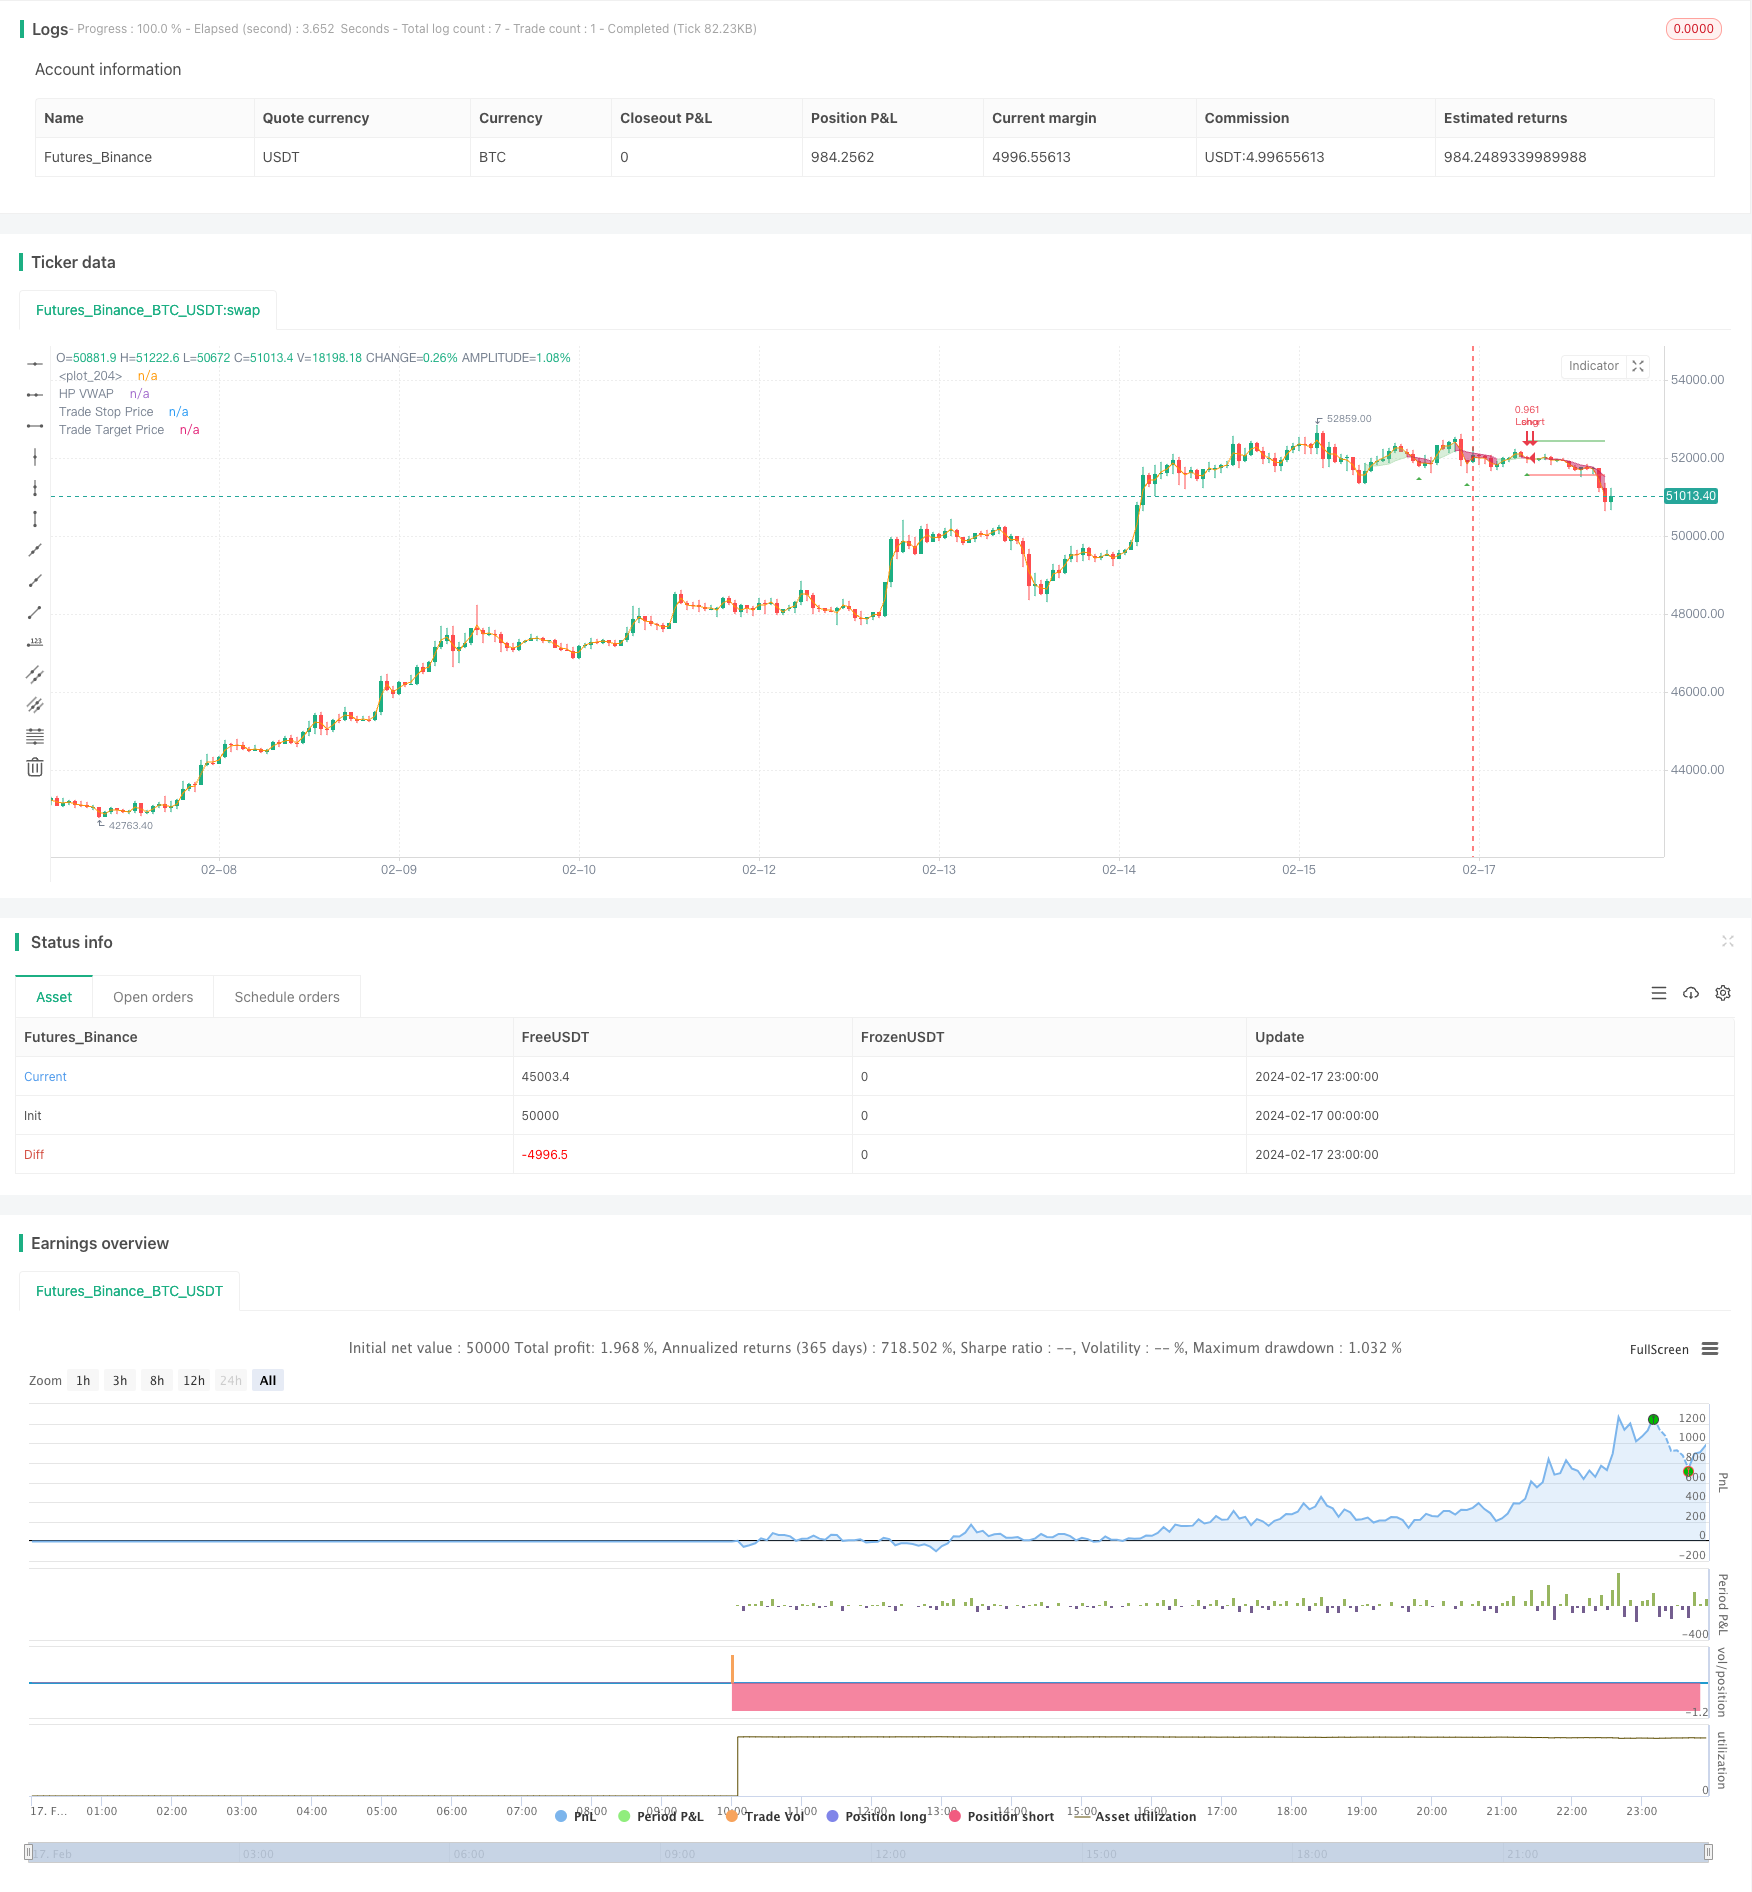
/*backtest
start: 2024-02-17 00:00:00
end: 2024-02-18 00:00:00
period: 1h
basePeriod: 15m
exchanges: [{"eid":"Futures_Binance","currency":"BTC_USDT"}]
*/

// This source code is subject to the terms of the Mozilla Public License 2.0 at https://mozilla.org/MPL/2.0/
// © tathal animouse hajixde

//@version=4
strategy("LPB MicroCycles Strategy", "HPVWAP", overlay=true, default_qty_type=strategy.percent_of_equity, default_qty_value=100, max_bars_back=5000)
startDate = input(title="Start Date", type=input.integer,
     defval=1, minval=1, maxval=31)
startMonth = input(title="Start Month", type=input.integer,
     defval=1, minval=1, maxval=12)
startYear = input(title="Start Year", type=input.integer,
     defval=2010, minval=1800, maxval=2100)

endDate = input(title="End Date", type=input.integer,
     defval=31, minval=1, maxval=31)
endMonth = input(title="End Month", type=input.integer,
     defval=12, minval=1, maxval=12)
endYear = input(title="End Year", type=input.integer,
     defval=2021, minval=1800, maxval=2100)

// STEP 2:
// Look if the close time of the current bar
// falls inside the date range
inDateRange = true

///

// Strategy Settings
var g_strategy      = "Strategy Settings"
stopMultiplier      = input(title="Stop Loss ATR", type=input.float, defval=1.0, group=g_strategy, tooltip="Stop loss multiplier (x ATR)")
rr                  = input(title="R:R", type=input.float, defval=1.0, group=g_strategy, tooltip="Risk:Reward profile")

/// Backtester Settings
var g_tester        = "Backtester Settings"
startBalance        = input(title="Starting Balance", type=input.float, defval=10000.0, group=g_tester, tooltip="Your starting balance for the custom inbuilt tester system")
riskPerTrade        = input(title="Risk Per Trade", type=input.float, defval=1.0, group=g_tester, tooltip="Your desired % risk per trade (as a whole number)")
drawTester          = input(title="Draw Backtester", type=input.bool, defval=true, group=g_tester, tooltip="Turn on/off inbuilt backtester display")

////////////////INPUTS///////////////////
lambda = input(defval = 1000, type = input.float, title = "Smoothing Factor (Lambda)", minval = 1)
leng = input(defval = 100, type = input.integer, title = "Filter Length", minval = 1)
src = ohlc4
atr = atr(14)

///////////Construct Arrays///////////////
a = array.new_float(leng, 0.0)
b = array.new_float(leng, 0.0)
c = array.new_float(leng, 0.0)
d = array.new_float(leng, 0.0)
e = array.new_float(leng, 0.0)
f = array.new_float(leng, 0.0)

/////////Initialize the Values///////////

ll1 = leng-1
ll2 = leng-2

for i = 0 to ll1
    array.set(a,i, lambda*(-4))
    array.set(b,i, src[i])
    array.set(c,i, lambda*(-4))
    array.set(d,i, lambda*6 + 1)
    array.set(e,i, lambda)
    array.set(f,i, lambda)

array.set(d, 0,  lambda + 1.0)
array.set(d, ll1, lambda + 1.0)
array.set(d, 1,  lambda * 5.0 + 1.0)
array.set(d, ll2, lambda * 5.0 + 1.0)

array.set(c, 0 , lambda * (-2.0))
array.set(c, ll2, lambda * (-2.0))

array.set(a, 0 , lambda * (-2.0))
array.set(a, ll2, lambda * (-2.0))

//////////////Solve the optimization issue/////////////////////
float r = array.get(a, 0)
float s = array.get(a, 1)
float t = array.get(e, 0)
float xmult = 0.0

for i = 1 to ll2
    xmult := r / array.get(d, i-1)
    array.set(d, i, array.get(d, i) - xmult * array.get(c, i-1))
    array.set(c, i, array.get(c, i) - xmult * array.get(f, i-1))
    array.set(b, i, array.get(b, i) - xmult * array.get(b, i-1))

    xmult := t / array.get(d, i-1)
    r     := s - xmult*array.get(c, i-1)
    array.set(d, i+1, array.get(d, i+1) - xmult * array.get(f, i-1))
    array.set(b, i+1, array.get(b, i+1) - xmult * array.get(b, i-1))

    s     := array.get(a, i+1)
    t     := array.get(e, i)

xmult := r / array.get(d, ll2)
array.set(d, ll1, array.get(d, ll1) - xmult * array.get(c, ll2))

x = array.new_float(leng, 0)
array.set(x, ll1, (array.get(b, ll1) - xmult * array.get(b, ll2)) / array.get(d, ll1))
array.set(x, ll2, (array.get(b, ll2) - array.get(c, ll2) * array.get(x, ll1)) / array.get(d, ll2))

for j = 0 to leng-3
    i = leng-3 - j
    array.set(x, i, (array.get(b,i) - array.get(f,i)*array.get(x,i+2) - array.get(c,i)*array.get(x,i+1)) / array.get(d, i))


//////////////Construct the output///////////////////
HP = array.get(x,0)

///////////////Custom VWAP////////////////////////
TimeFrame = input('1', type=input.resolution)
start = security(syminfo.tickerid, TimeFrame, time)

//------------------------------------------------
newSession = iff(change(start), 1, 0)
//------------------------------------------------
vwapsum = 0.0
vwapsum := iff(newSession, HP*volume, vwapsum[1]+HP*volume)
volumesum = 0.0
volumesum := iff(newSession, volume, volumesum[1]+volume)
v2sum = 0.0
v2sum := iff(newSession, volume*HP*HP, v2sum[1]+volume*HP*HP)
myvwap = vwapsum/volumesum
dev = sqrt(max(v2sum/volumesum - myvwap*myvwap, 0))
Coloring=close>myvwap?color.new(#81c784, 62):color.new(#c2185b, 38)
av=myvwap
showBcol = input(true, type=input.bool, title="Show barcolors")


///////////////Entry & Exit///////////////////

// Custom function to convert pips into whole numbers
toWhole(number) =>
    return = atr < 1.0 ? (number / syminfo.mintick) / (10 / syminfo.pointvalue) : number
    return := atr >= 1.0 and atr < 100.0 and syminfo.currency == "JPY" ? return * 100 : return

// Custom function to convert whole numbers back into pips
toPips(number) =>
    return = atr >= 1.0 ? number : (number * syminfo.mintick) * (10 / syminfo.pointvalue)
    return := atr >= 1.0 and atr < 100.0 and syminfo.currency == "JPY" ? return / 100 : return

// Custom function to truncate (cut) excess decimal places
truncate(_number, _decimalPlaces) =>
    _factor = pow(10, _decimalPlaces)
    int(_number * _factor) / _factor


///////////////Conditional Strategy Logic//////////////
Long = crossover(av, ohlc4)
Sell = crossunder(av, ohlc4)

// Check if we have confirmation for our setup
validLong = Long and strategy.position_size == 0 and inDateRange and barstate.isconfirmed
validShort = Sell and strategy.position_size == 0 and inDateRange and barstate.isconfirmed


// Calculate our stop distance & size for the current bar
stopSize = atr * stopMultiplier
longStopPrice = low < low[1] ? low - stopSize : low[1] - stopSize
longStopDistance = close - longStopPrice
longTargetPrice = close + (longStopDistance * rr)


// Save trade stop & target & position size if a valid setup is detected
var t_entry = 0.0
var t_stop = 0.0
var t_target = 0.0
var t_direction = 0

// Detect valid long setups & trigger alert
if validLong
    t_entry := close
    t_stop := longStopPrice
    t_target := longTargetPrice
    t_direction := 1
    strategy.entry(id="Long", long=strategy.long, when=validLong, comment="(SL=" + tostring(truncate(toWhole(longStopDistance),2)) + " pips)")
    // Fire alerts
    alert(message="Long Detected", freq=alert.freq_once_per_bar_close)

// Check if price has hit long stop loss or target
if t_direction == 1 and (low <= t_stop or high >= t_target)
    t_direction := 0

// Check if price has hit short stop loss or target
if t_direction == -1 and (high >= t_stop or low <= t_target)
    t_direction := 0


// Exit trades whenever our stop or target is hit
strategy.exit(id="Long Exit", from_entry="Long", limit=t_target, stop=t_stop, when=strategy.position_size > 0)

// Draw trade data
plot(strategy.position_size != 0 or validLong? t_stop : na, title="Trade Stop Price", color=color.red, style=plot.style_linebr)
plot(strategy.position_size != 0 or validLong? t_target : na, title="Trade Target Price", color=color.green, style=plot.style_linebr)

/////////////////////Plotting//////////////////////////

A=plot(av, color=Coloring, title="HP VWAP")

barcolor(showBcol?Coloring:na)

fill(A, plot(ohlc4), Coloring)

// Draw price action setup arrows
plotshape(validLong ? 1 : na, style=shape.triangleup, location=location.belowbar, color=color.green, title="Bullish Setup")

// // --- BEGIN TESTER CODE --- //
// // Declare performance tracking variables
// var balance = startBalance
// var drawdown = 0.0
// var maxDrawdown = 0.0
// var maxBalance = 0.0
// var totalPips = 0.0
// var totalWins = 0
// var totalLoss = 0

// // Detect winning trades
// if strategy.wintrades != strategy.wintrades[1]
//     balance := balance + ((riskPerTrade / 100) * balance) * rr
//     totalPips := totalPips + abs(t_entry - t_target)
//     totalWins := totalWins + 1
//     if balance > maxBalance
//         maxBalance := balance

// // Detect losing trades
// if strategy.losstrades != strategy.losstrades[1]
//     balance := balance - ((riskPerTrade / 100) * balance)
//     totalPips := totalPips - abs(t_entry - t_stop)
//     totalLoss := totalLoss + 1
//     // Update drawdown
//     drawdown := (balance / maxBalance) - 1
//     if drawdown < maxDrawdown
//         maxDrawdown := drawdown

// // Prepare stats table
// var table testTable = table.new(position.top_right, 5, 2, border_width=1)
// f_fillCell(_table, _column, _row, _title, _value, _bgcolor, _txtcolor) =>
//     _cellText = _title + "\n" + _value
//     table.cell(_table, _column, _row, _cellText, bgcolor=_bgcolor, text_color=_txtcolor)

// // Draw stats table
// var bgcolor = color.new(color.black,0)
// if drawTester
//     if barstate.islastconfirmedhistory
//         // Update table
//         dollarReturn = balance - startBalance
//         f_fillCell(testTable, 0, 0, "Total Trades:", tostring(strategy.closedtrades), bgcolor, color.white)
//         f_fillCell(testTable, 0, 1, "Win Rate:", tostring(truncate((strategy.wintrades/strategy.closedtrades)*100,2)) + "%", bgcolor, color.white)
//         f_fillCell(testTable, 1, 0, "Starting:", "$" + tostring(startBalance), bgcolor, color.white)
//         f_fillCell(testTable, 1, 1, "Ending:", "$" + tostring(truncate(balance,2)), bgcolor, color.white)
//         f_fillCell(testTable, 2, 0, "Return:", "$" + tostring(truncate(dollarReturn,2)), dollarReturn > 0 ? color.green : color.red, color.white)
//         f_fillCell(testTable, 2, 1, "Pips:", (totalPips > 0 ? "+" : "") + tostring(truncate(toWhole(totalPips),2)), bgcolor, color.white)
//         f_fillCell(testTable, 3, 0, "Return:", (dollarReturn > 0 ? "+" : "") + tostring(truncate((dollarReturn / startBalance)*100,2)) + "%", dollarReturn > 0 ? color.green : color.red, color.white)
//         f_fillCell(testTable, 3, 1, "Max DD:", tostring(truncate(maxDrawdown*100,2)) + "%", color.red, color.white)
// // --- END TESTER CODE --- //