概述
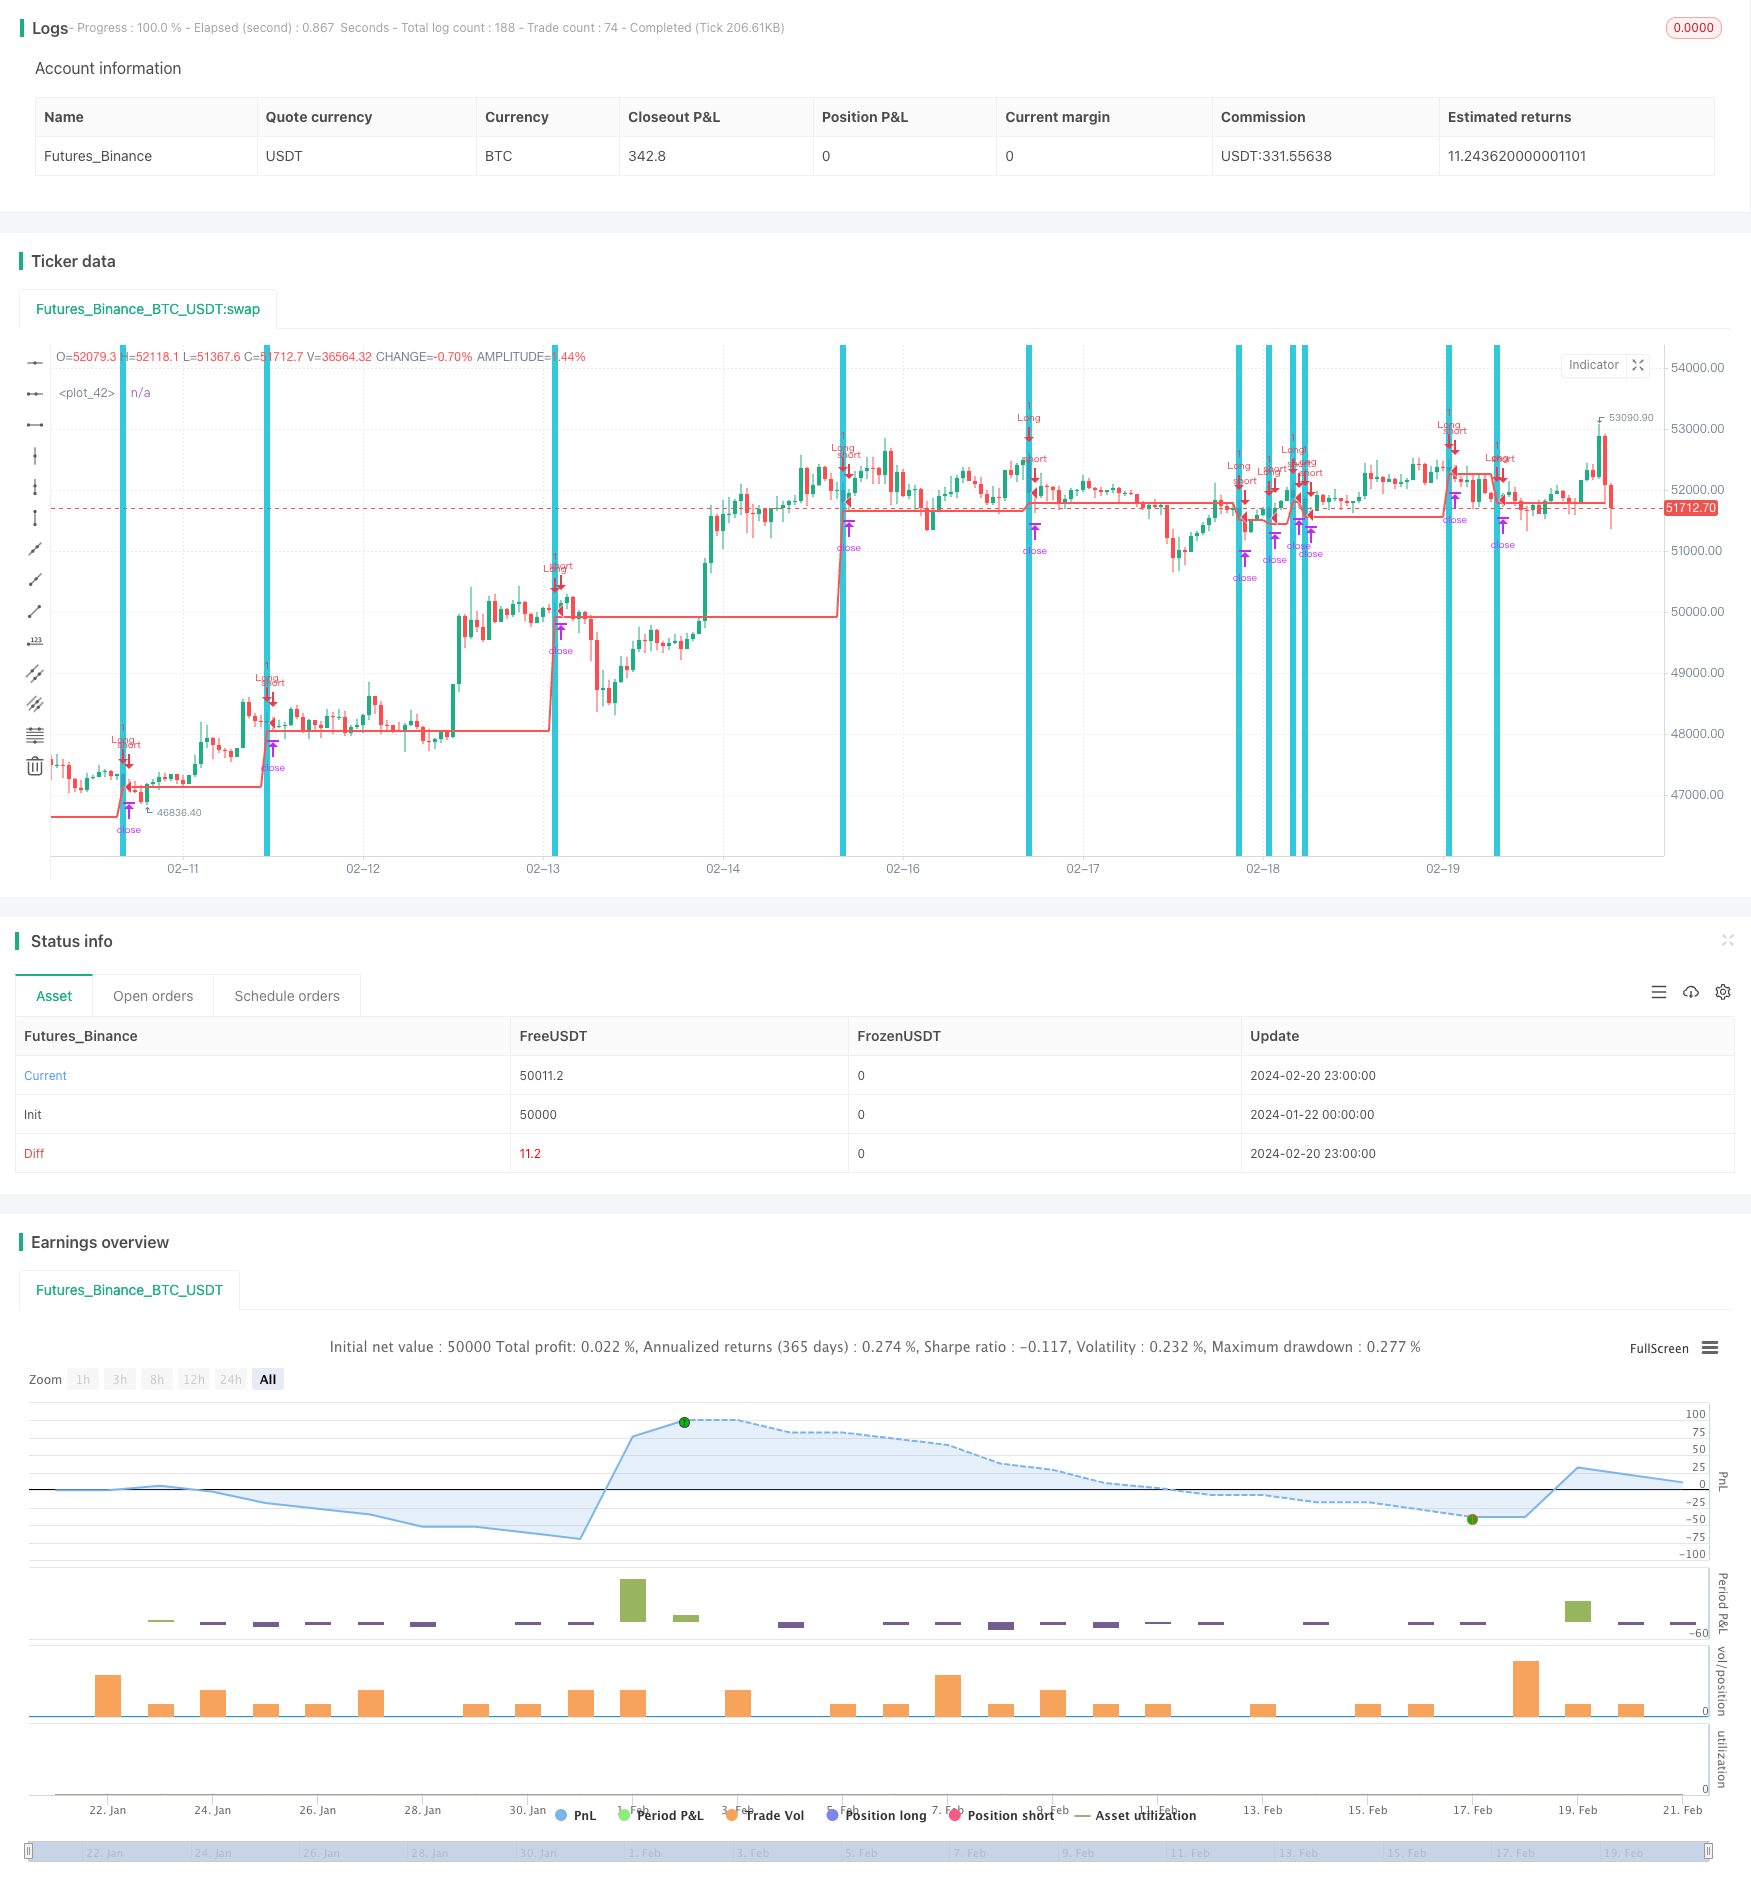
该策略的主要思想是在出现特定的K线形态后开仓做多,即在出现向下跳空的阴线(colorbar)并且下一根K线低点回调的情况下在下一根K线开盘的时候做多入场。
策略原理
该策略判断的具体条件是:前一根K线相比前两根K线的最低点更低而最高点更高,即出现了向下跳空;而当前K线的最低点又低于或等于前一根K线的最低点,即发生了回调。当同时满足这两个条件时,在下一根K线开盘的时候做多入场。
做多后设置止损为回调低点即前一根K线的最低价,同时设置止盈为开仓价格的2%以上。当价格触碰到止盈或者止损价格后平仓。
优势分析
该策略最大的优势在于抓住了短期内极有可能出现的反弹机会。当出现向下跳空的K线然后发生回调时,这是一个非常有力的技术形态,说明空头的力量可能在该级别耗尽,有很大的概率会出现反弹。因此这是一个相对比较适合短线操作的策略。
风险分析
该策略的主要风险在于回调结束后价格继续下跌的可能性。因为我们是在回调低点附近做多,如果不能及时止损,那么可能面临较大的损失。此外,如果回调幅度较小,止损点设置得比较近的话,可能会被套。因此这个策略还是比较适合短线操作,需要密切关注价格行情,及时止损。
优化方向
可以考虑结合其他指标来确定入场时机,比如可以在MACD发生金叉时再入场,或者可以计算typical price看是否处于支撑位置等,这可以过滤一些假信号,提高策略的稳定性。此外,可以研究不同品种、不同时间周期下该策略的表现,寻找最佳的参数组合。还可以通过机器学习等方法来自动优化参数。
总结
该策略总的来说是一个典型的短线突破回调做多策略。它抓住了跳空且发生回调这一强势形态所提供的反弹机会。但同时也面临着无法及时止损而造成较大损失的风险,因此适合频繁监控市场的短线操作。通过进一步结合其他指标过滤信号以及参数优化,可以提高策略的效果。
策略源码
/*backtest
start: 2024-01-22 00:00:00
end: 2024-02-21 00:00:00
period: 1h
basePeriod: 15m
exchanges: [{"eid":"Futures_Binance","currency":"BTC_USDT"}]
*/

//@version=3
//  Created by Leon Ross
//study(title="OutsideDownOpenLower", shorttitle="ODOL", overlay=true)
strategy(title = "Outside", shorttitle = "OB", overlay = true )


//Window of time
//start     = timestamp(2018, 01, 01, 00, 00)  // backtest start window
//finish    = timestamp(2018, 12, 31, 23, 59)        // backtest finish window
//window()  => time >= start and time <= finish ? true : false // create function "within window of time"

//Conditions
outsideBar = low < low[1] and high > high[1] and close < open
allConditions = outsideBar

//Stop and Take Profit as percentages
//inpTakeProfit   = input(2, title='Take Profit %', type=float)/100
//takeProfitValue = strategy.position_avg_price * (1 + inpTakeProfit)
//useTakeProfit   = inpTakeProfit  > 0 ?  takeProfitValue : na
//inpStopLoss     = input(1, title='Stop Loss %', type=float)/100
//stopLossValue = strategy.position_avg_price * (1 - inpStopLoss)
//useStopLoss     = inpStopLoss    > 0 ?  stopLossValue   : na
//entry = strategy.position_avg_price


//Stop as last bars low and profit as percentage
entry = strategy.position_avg_price
inpTakeProfit   = input(2.0, title='Take Profit %', type=float)/100
takeProfitValue = strategy.position_avg_price * (1 + inpTakeProfit)
useTakeProfit   = inpTakeProfit  > 0 ?  takeProfitValue : na
inpStopLoss     = valuewhen(allConditions, low, 0)
stopLossValue = inpStopLoss
useStopLoss     = inpStopLoss    > 0 ?  stopLossValue   : na


//Plots
bgcolor(allConditions ==1 ? aqua : na, transp=70)
plot(entry, color=blue, style=linebr, linewidth=2)
plot(useStopLoss, color=red, style=linebr, linewidth=2)
plot(useTakeProfit, color=green, style=linebr, linewidth=2)


//Entires
strategy.entry(id = "Long", long = true, when = allConditions) // use function or simple condition to decide when to get in

//Exits
//if (barssince(allConditions) == 2)
    //strategy.close("Long")
//else
strategy.exit("Exit Long", from_entry = "Long", stop = useStopLoss)