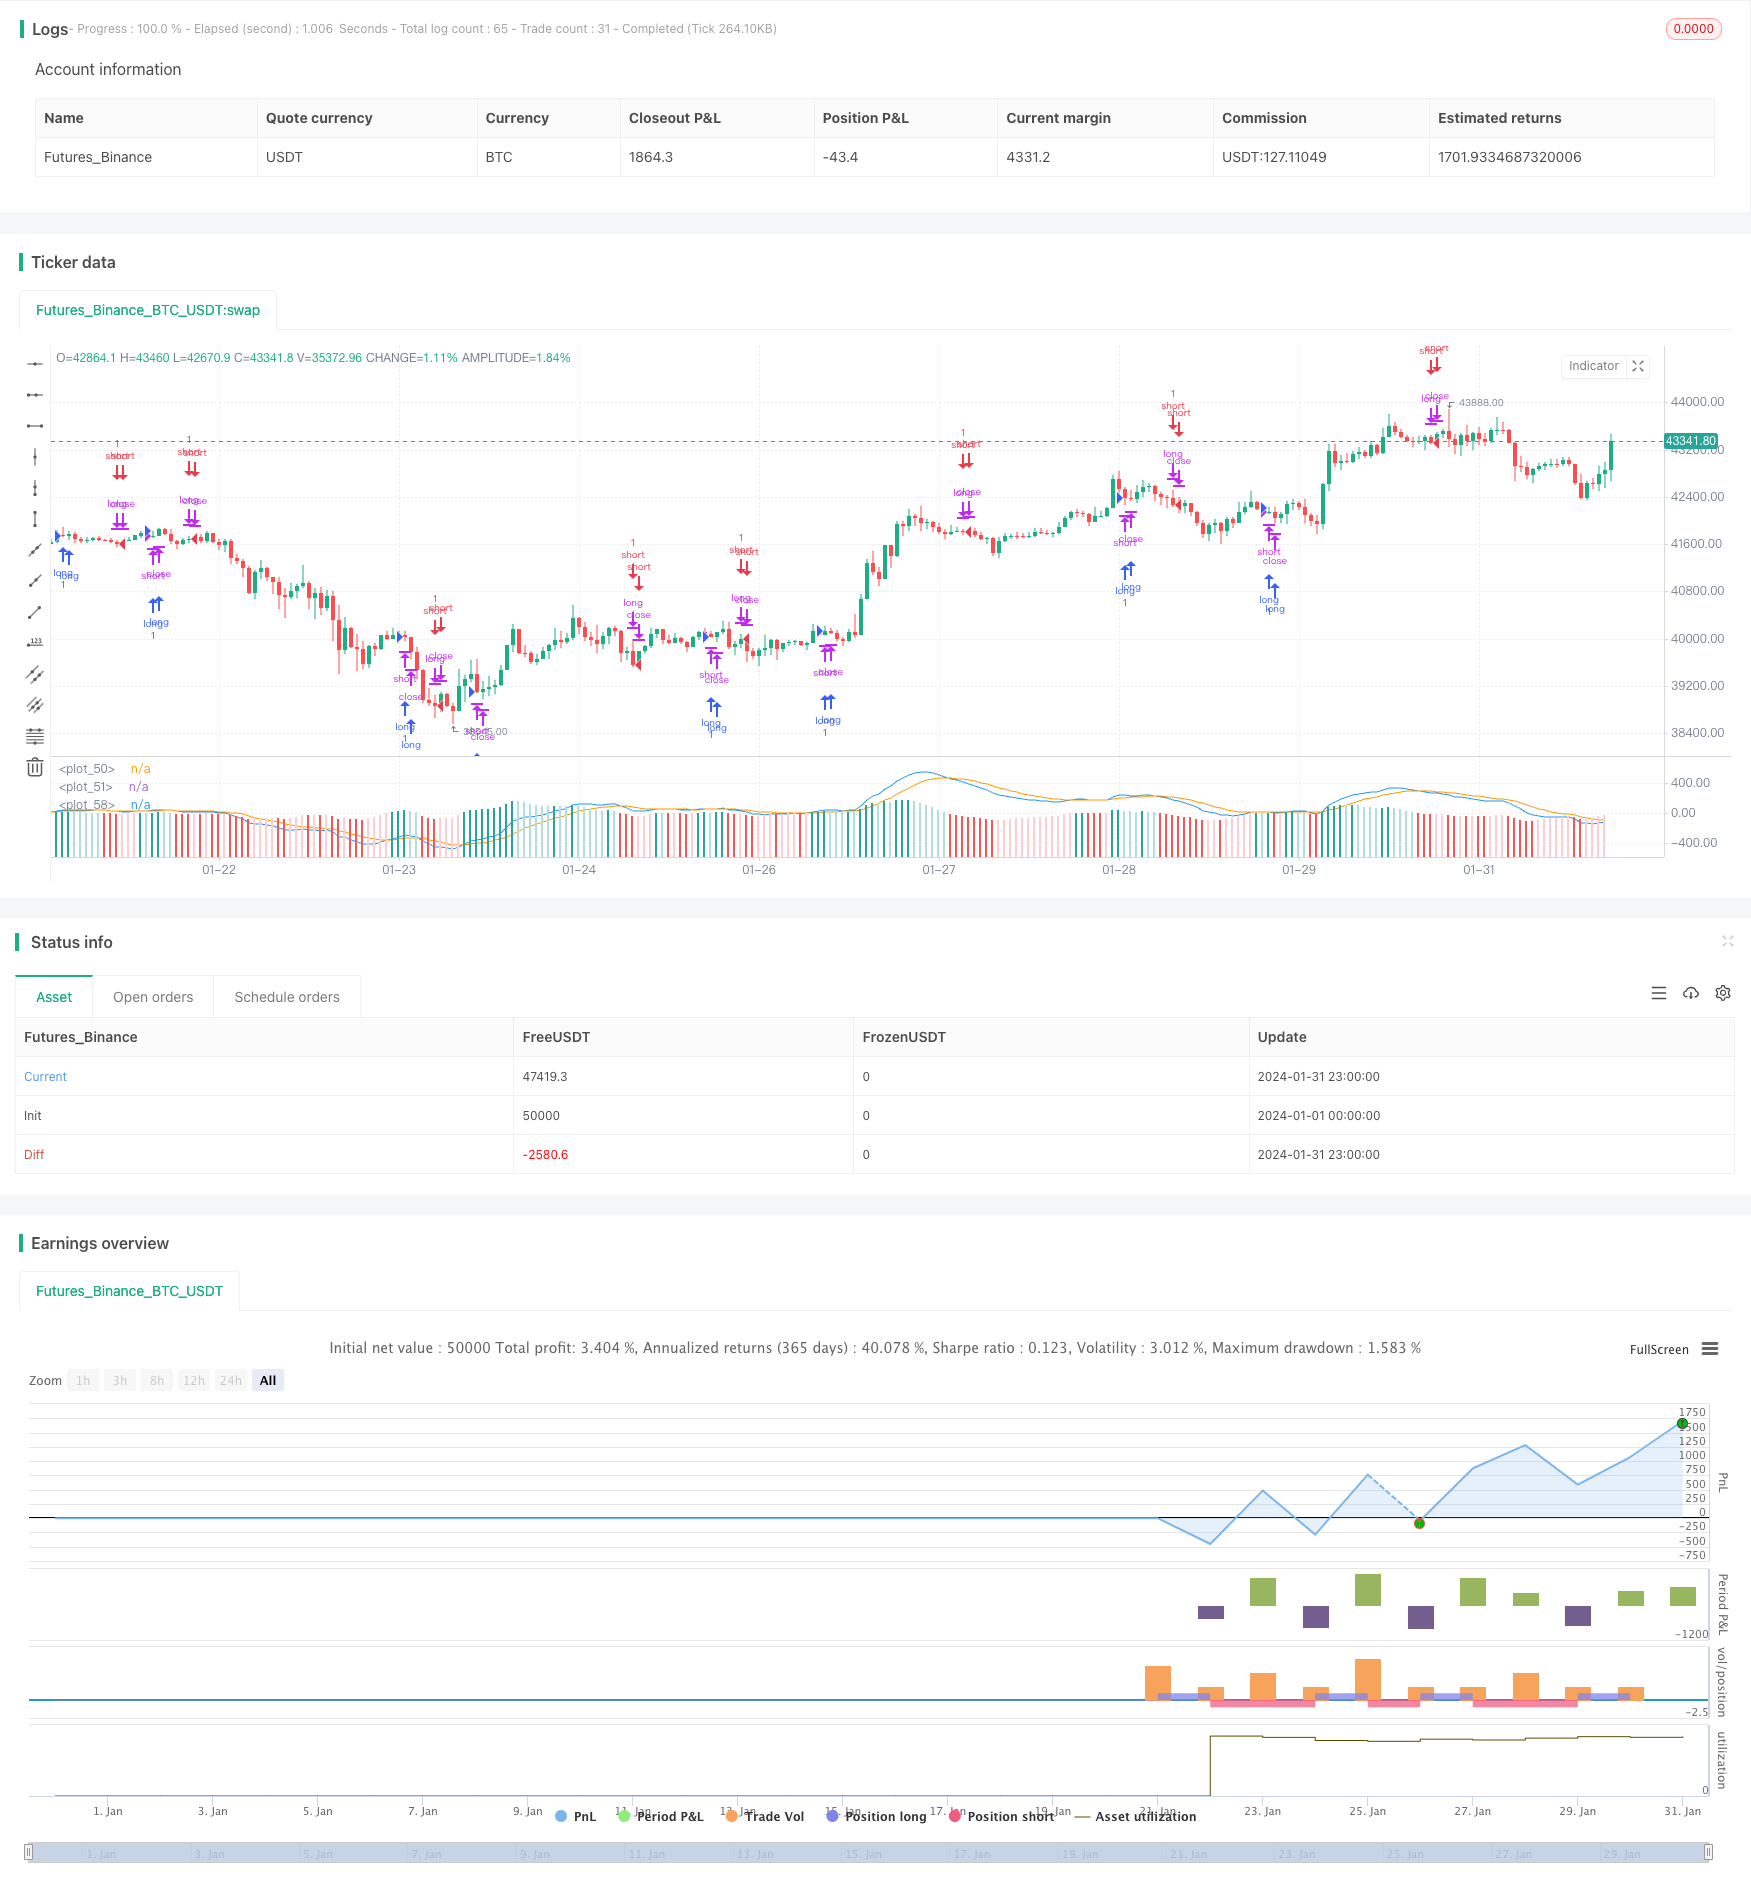
概述
移动平均线金叉死叉交易策略是一种追踪短期和长期移动平均线(EMA)的交叉情况,在金叉和死叉时进行买入和卖出操作的量化交易策略。该策略结合MACD指标进行交易信号判断。
策略原理
该策略主要依赖12日EMA、26日EMA和MACD指标。具体逻辑是:
- 计算12日EMA和26日EMA。
- 计算MACD(即12日EMA减26日EMA)。
- 计算MACD的9日EMA作为信号线。
- 当MACD上穿信号线时,产生买入信号。
- 当MACD下穿信号线时,产生卖出信号。
- 在产生信号的第二根K线收盘时,进行对应的买入或者卖出操作。
另外,该策略还设置了一些过滤条件:
- 交易时间为每天的非收市时间。
- MACD和信号线差值的绝对值需要大于0.08。
- 每次只允许单向持仓。
优势分析
该策略结合移动平均线交叉和MACD指标,可以有效捕捉市场短期和中期趋势的转折点。主要优势有:
- 策略规则简单清晰,容易理解和实现。
- 指标参数经过优化,表现较为稳定。
- 兼顾追踪中短期趋势与及时止损退出。
- 交易逻辑严谨,避免无效交易。
风险分析
该策略也存在一些风险:
- 回测数据拟合风险。实际运用时,参数和阈值可能需要调整。
- 频繁交易带来的滑点成本过高的风险。
- 趋势反转没有及时退出带来的亏损风险。
- 量化交易本身的杠杆风险放大。
对应缓解方法:
- 动态优化参数,调整阈值。
- 适当放宽交易规则,减少不必要交易。
- 结合更多指标判断反转信号。
- 严格控制仓位和杠杆。
优化方向
该策略主要可从以下方面进行优化:
- 测试更长周期的移动平均线组合,寻找最优参数。
- 增加公司业绩、重大事件等基本面因素作为过滤器。
- 结合更多指标判断趋势反转时机,如布林带、KDJ等。
- 开发止损机制。当亏损达到事先设定的止损点时,主动止损。
- 添加 dangere ratio 以控制最大回撤。
总结
移动平均线金叉死叉结合MACD交易策略,通过简单的趋势跟踪形成交易信号,易于实现,并结合适当的过滤条件控制风险,是一种行之有效的量化交易策略。该策略可通过参数优化、止损机制增加、结合更多辅助指标等方式得到改进。
策略源码
/*backtest
start: 2024-01-01 00:00:00
end: 2024-01-31 23:59:59
period: 1h
basePeriod: 15m
exchanges: [{"eid":"Futures_Binance","currency":"BTC_USDT"}]
*/

//@version=5
strategy("EMMA", max_bars_back = 200)

var up1 = #26A69A
var up2 = #B2DFDB
var down1 = #FF5252
var down2 = #FFCDD2
var confirmationLength = 2

var earliest = timestamp("20 Jan 2024 00:00 +0000")

// Regn u
shortEMA = ta.ema(close, 12)
longEMA = ta.ema(close, 26)
macd = shortEMA - longEMA
signal = ta.ema(macd, 9)
delta = macd - signal
absDelta = math.abs(delta)
previousDelta = delta[1]

signalCrossover = ta.crossover(macd, signal)
signalCrossunder = ta.crossunder(macd, signal)

harskiftetdag = hour(time[confirmationLength]) > hour(time)

enterLongSignal = signalCrossover[confirmationLength] and (macd > signal) and (absDelta >= 0.08)
exitLongSignal = signalCrossunder[confirmationLength] and (macd < signal)

enterShortSignal = signalCrossunder[confirmationLength] and (macd < signal) and (absDelta >= 0.08)
exitShortSignal = signalCrossover[confirmationLength] and (macd > signal)

// Så er det tid til at købe noe
qty = math.floor(strategy.equity / close)

if time >= earliest and not harskiftetdag
    if exitLongSignal
        strategy.close("long")
    else if enterLongSignal
        strategy.close("short")
        strategy.entry("long", strategy.long, qty = qty)

    if exitShortSignal
        strategy.close("short")
    else if enterShortSignal
        strategy.close("long")
        strategy.entry("short", strategy.short, qty = qty)

// Så er det tid til at vise noe

plot(macd, color=color.blue)
plot(signal, color=color.orange)

// bgcolor(color = delta > 0.1 ? color.new(color.green, 90) : color.new(color.green, 100))
// bgcolor(color = signalCrossover ? color.purple : signalCrossunder ? color.aqua : color.new(color.green, 100))

histogramColor = delta > 0 ? (previousDelta < delta ? up1 : up2) : (previousDelta > delta ? down1 : down2)

plot(
     delta,
     style=plot.style_columns,
     color=histogramColor
     )