概述
本策略将恩勒斯优雅震荡指标、恩勒斯循环指标、恩勒斯瞬时趋势线和恩勒斯斯皮尔曼等级相关系数指标组合到一起,形成一个全方位捕捉趋势、震荡、动量和量价特征的量化交易策略。策略名称为“量化震荡指标组合策略”。
策略原理
本策略使用4个关键指标进行判断。
首先,恩勒斯优雅震荡指标,其通过指数平均线平滑后得到信号线,与原始线的差值可判断当前趋势方向和强度。其次,恩勒斯循环指标,可有效识别循环周期低点,判断主趋势是否反转。再次,恩勒斯瞬时趋势线追踪快速移动平均线,用于判断短期趋势方向。最后,恩勒斯斯皮尔曼等级相关系数指标判断量价关系,可有效过滤假突破。
具体来说,策略的四项入场条件为:优雅震荡指标信号线和循环指标信号线同时向上穿0;原始线向上突破循环线;原始线高于上升的瞬时趋势线;斯皮尔曼等级相关系数为正。
而出场条件则简单得多,仅当原始线下穿瞬时趋势线时平仓。
做空条件与做多条件类似,仅将判断条件取反即可。
优势分析
本策略最大的优势在于指标组合得当,可有效发挥各指标的优势,相互验证,避免假阳性,从而过滤掉大量噪音,使信号更加可靠。
具体来说,优雅震荡指标可判断趋势方向和力度,循环指标可判断循环转折点,瞬时趋势线可判断短期趋势,斯皮尔曼等级相关系数可判断量价关系。四者组合,可全面判断市场在趋势、循环、动量和量价方面的特征,从而得出高可靠性交易信号。
此外,该策略仅以中期线为参考对象,避开了短期市场噪音的干扰,可减少不必要的反转交易。同时,策略信号稀少、出场规则简单,可大幅降低交易频率,避免过度交易的问题。
风险分析
本策略最大的风险在于缺乏止损机制。当市场出现剧烈变动时,无法及时止损,可能导致亏损扩大。此外,也缺乏附加过滤器,如边际系统过滤和能量指标等,可能导致一定程度的假阳性交易。
为减小这些风险,可设置避险止损位,当亏损超过一定比例时自动止损。此外,也可加入 MACD 等动量指标进行二次验证,避免假突破带来的风险。
优化方向
本策略可从以下几个方面进行优化:
加入避险止损机制。根据历史回测数据计算最大回撤,设置相应的止损点。
增加过滤器。加入 MACD、布林带等指标进行多层过滤,进一步减少假信号。
结合更多时间周期。目前仅有一组参数,可引入更多周期参数,采用多时间轴验证方式,提高稳定性。
动态调整参数。加入参数优化模块,根据不同市场条件动态调整指标参数,使策略更具适应性。
多品种套利。将策略应用于不同品种,寻找套利机会,可进一步控制风险。
总结
本策略通过恩勒斯四大指标巧妙组合,形成判断趋势、循环、动量和量价全方位的交易策略。它过滤噪音的能力出色,可产生高质量信号。但缺乏止损和辅助指标过滤使其存在一定风险。通过加入止损、过滤器、更多时间周期等,可以有效优化,使策略更加稳定可靠。
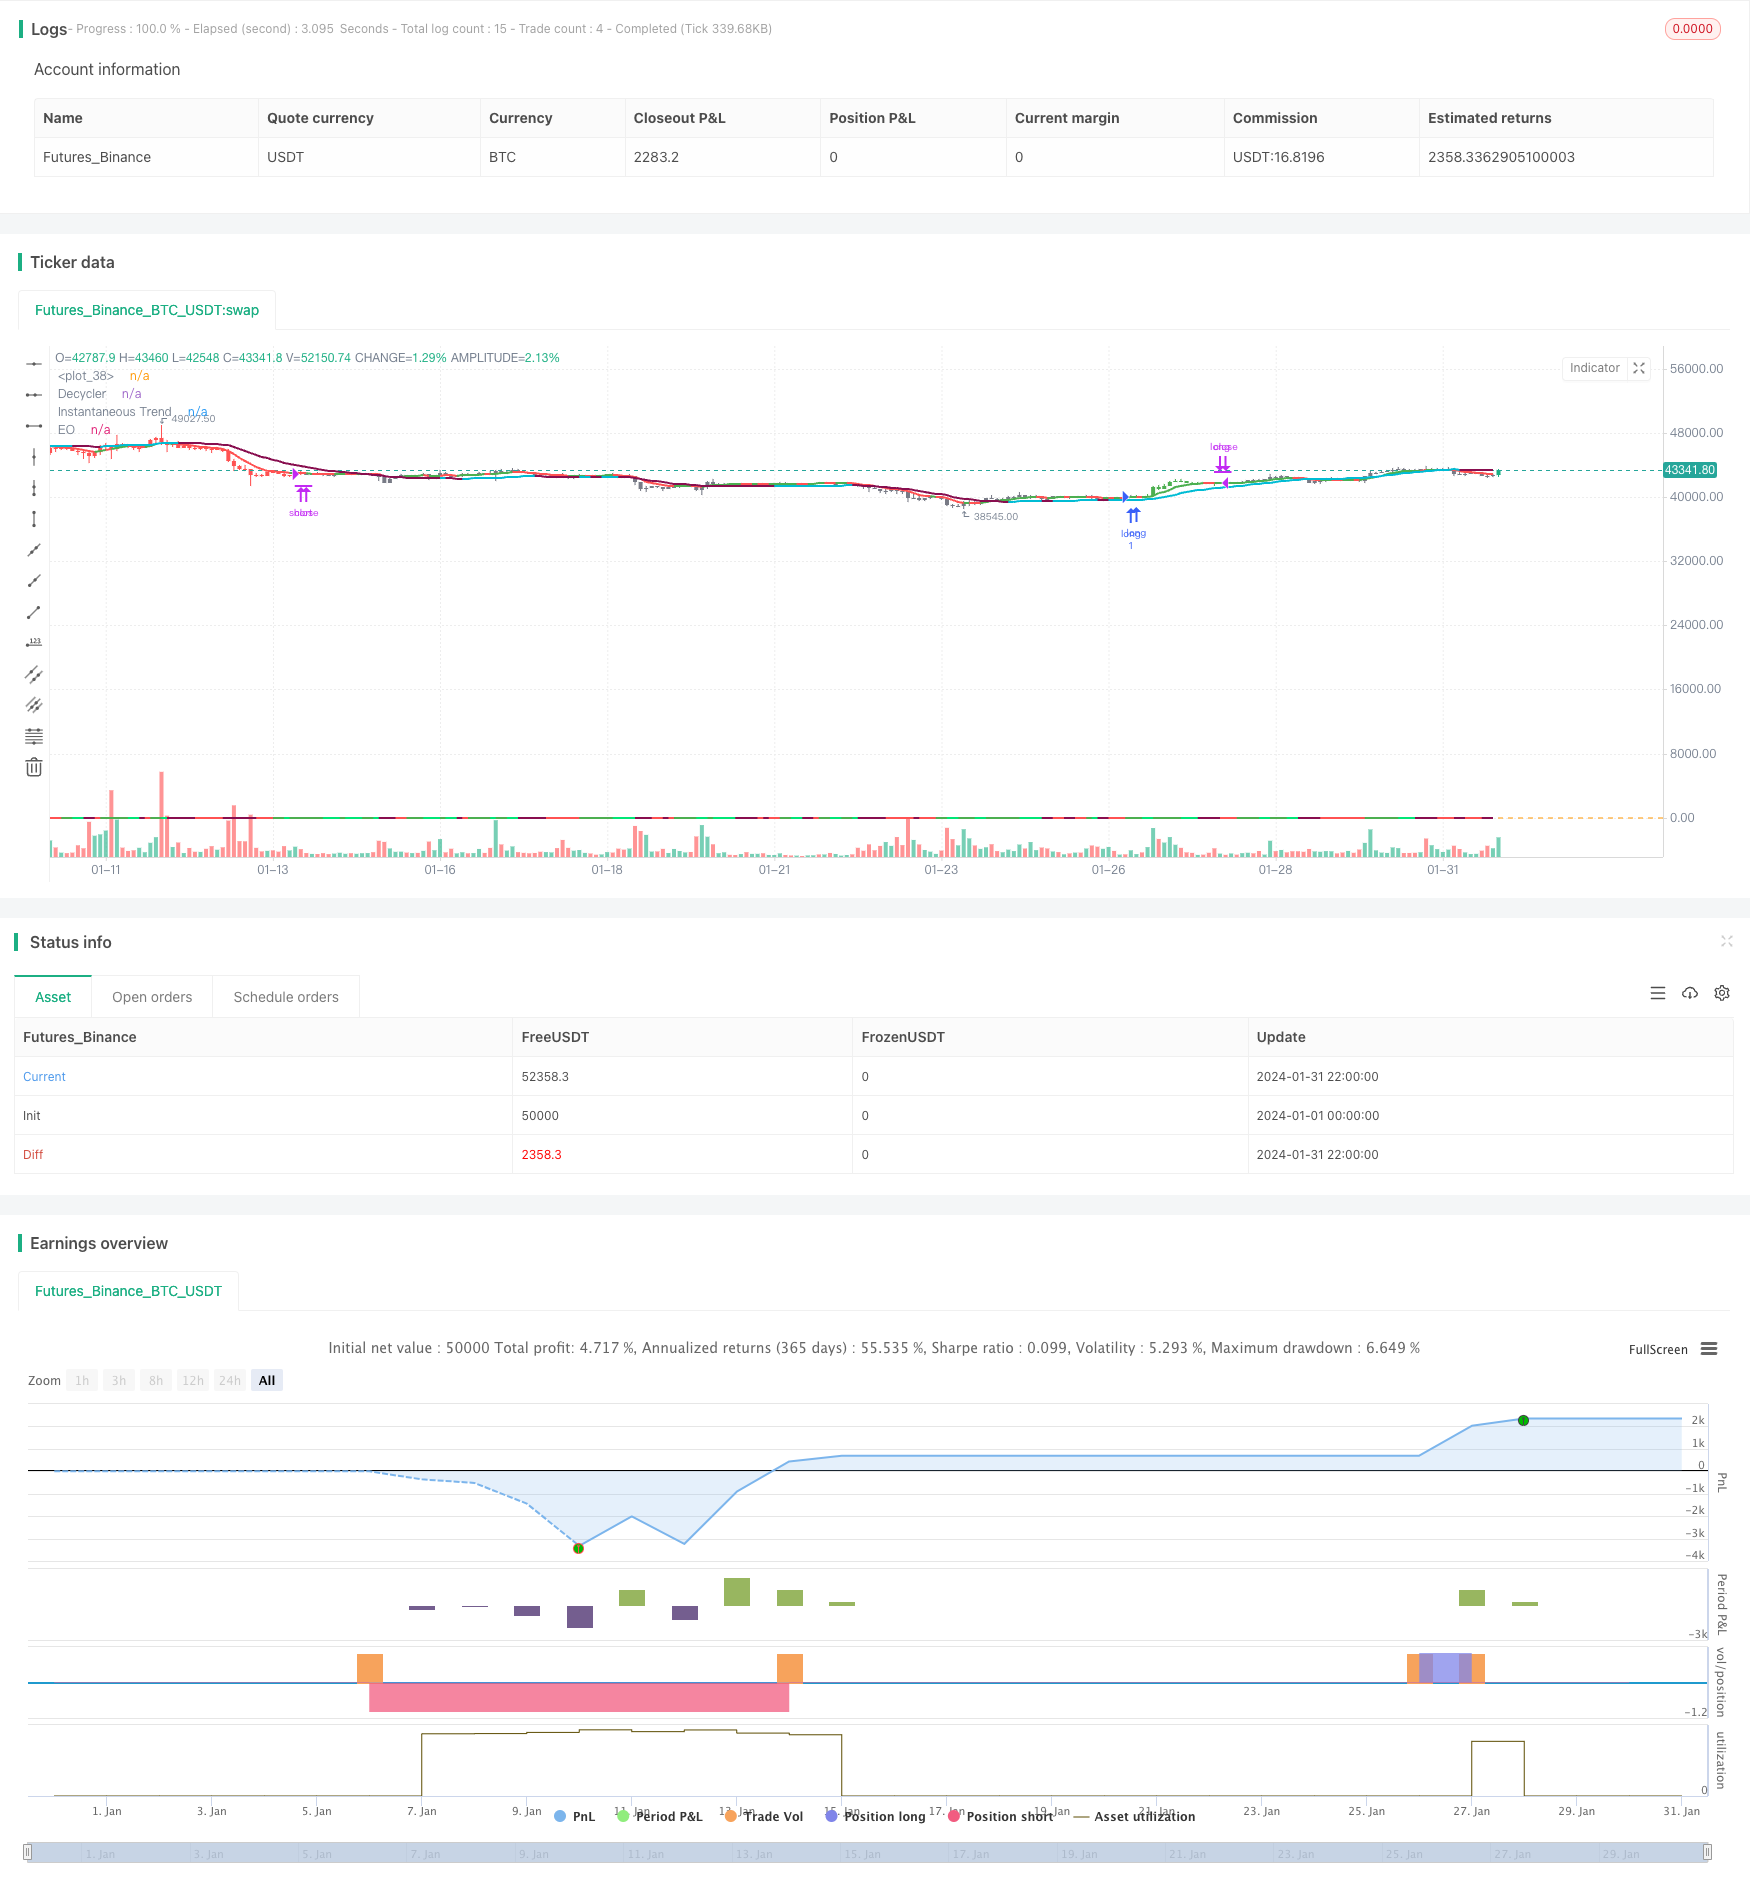
/*backtest
start: 2024-01-01 00:00:00
end: 2024-01-31 23:59:59
period: 2h
basePeriod: 15m
exchanges: [{"eid":"Futures_Binance","currency":"BTC_USDT"}]
*/

// This Pine Script™ code is subject to the terms of the Mozilla Public License 2.0 at https://mozilla.org/MPL/2.0/
// © simwai

//@version=5
strategy('Ehlers Elegant Oscillator + Ehlers Decycler + Ehlers Instantaneous + Ehlers Spearman Rank', 'Ehlers Combo', overlay=true, margin_long=100, margin_short=100)

// -- Inputs --
inp = input(title='Source', defval=close)
res = input.timeframe(title='Resolution', defval='')
bar = input(title='Allow Bar Color Change?', defval=true)
src = inp
length = input.int(title='Length', defval=20, minval=2, maxval=300)
rmsLength = input.int(title='Rms Length', defval=50, minval=2)
decyclerLength = length

// -- Calculation --
// Ehlers Elegant Oscillator
a1 = math.exp(-1.414 * math.pi / length)
b1 = 2 * a1 * math.cos(1.414 * math.pi / length)
c2 = b1
c3 = -a1 * a1
c1 = 1 - c2 - c3

deriv = src - nz(src[2])
rms = math.avg(math.pow(deriv, 2), rmsLength)
rms := rms != 0 ? math.sqrt(rms) : 0
nDeriv = rms != 0 ? deriv / rms : 0
iFish = nDeriv != 0 ? (math.exp(2 * nDeriv) - 1) / (math.exp(2 * nDeriv) + 1) : 0

ss = 0.0
ss := bar_index < 3 ? 0 : (c1 * ((iFish + nz(iFish[1])) / 2)) + (c2 * nz(ss[1])) + (c3 * nz(ss[2]))
ssSig = ta.wma(ss, length)

slo = ss - ssSig
sig = slo > 0 ? slo > nz(slo[1]) ? 2 : 1 : slo < 0 ? slo < nz(slo[1]) ? -2 : -1 : 0
eoColor = sig > 1 ? color.green : sig > 0 ? color.lime : sig < -1 ? color.maroon : sig < 0 ? color.red : color.black

hline(0)
plot(ssSig, title='EO', color=eoColor, linewidth=2)

// Ehlers Decycler
pi = 2 * math.asin(1)
twoPiPrd = 2 * pi / decyclerLength
alpha = (math.cos(twoPiPrd) + math.sin(twoPiPrd) - 1) / math.cos(twoPiPrd)

dec = 0.0
dec := ((alpha / 2) * (src + nz(src[1]))) + ((1 - alpha) * nz(dec[1]))

decyclerSig = src > dec ? 1 : src < dec ? -1 : 0
decColor = decyclerSig > 0 ? color.green : decyclerSig < 0 ? color.red : color.black
plot(dec, title='Decycler', color=decColor, linewidth=2)

// Ehlers Instantaneous Trendline
getItrend(src, alpha) =>
    Price = src
    Smooth = 0.0
    ITrend = 0.0
    Trigger = 0.0

    ITrend := (alpha - alpha * alpha / 4) * Price + .5 * alpha * alpha  * Price[1] - (alpha - .75 * alpha * alpha) * Price[2] + 2 * (1 - alpha) * nz(ITrend[1]) - (1 - alpha) * (1 - alpha) * nz(ITrend[2])
    if(bar_index < 7)
        ITrend := (Price + 2 * Price[1] + Price[2]) / 4
    Trigger := 2 * ITrend - ITrend[2]
    [ITrend, Trigger]

itrendAlpha = 2 / (length + 1) / 2
[iT, Tr] = getItrend(src, itrendAlpha)

iTColor = Tr > iT ? color.aqua : color.maroon
plot(iT, 'Instantaneous Trend', iTColor, 2)

// Ehlers Spearman Rank
priceArray = array.new_float(300, 0.0)
rank = array.new_float(300, 0.0)
for i = 1 to length
    array.set(priceArray, i, nz(src[i - 1]))
    array.set(rank, i, i)

for i = 1 to length
    count = length + 1 - i
    for j = 1 to length - count
        if array.get(priceArray, j + 1) < array.get(priceArray, j)
            tempPrice = array.get(priceArray, j)
            tempRank = array.get(rank, j)
            array.set(priceArray, j, array.get(priceArray, j + 1))
            array.set(rank, j, array.get(rank, j + 1))
            array.set(priceArray, j + 1, tempPrice)
            array.set(rank, j + 1, tempRank)

sum = 0.0
for i = 1 to length
    sum := sum + math.pow(i - array.get(rank, i), 2)
signal = 2 * (0.5 - (1 - ((6 * sum) / (length * (math.pow(length, 2) - 1)))))
spearmanSlo = signal - nz(signal[1])
spearmanSig = spearmanSlo > 0 or signal > 0 ? spearmanSlo > nz(spearmanSlo[1]) ? 2 : 1 : spearmanSlo < 0 or signal < 0 ? spearmanSlo < nz(spearmanSlo[1]) ? -2 : -1 : 0

// -- Signals --
bool enterLong = ta.crossover(sig, 0) and ta.crossover(decyclerSig, 0) and ta.crossover(src, dec) and (src > iT) and iT[1] < iT and spearmanSig > 0
bool enterShort = ta.crossunder(sig, 0) and ta.crossunder(decyclerSig, 0) and ta.crossunder(src, dec) and (src < iT) and iT[1] > iT and spearmanSig < 0
bool exitLong = ta.crossunder(src[100], iT)
bool exitShort = ta.crossover(src[100], iT)

barcolor(bar and strategy.position_size > 0 ? color.green : bar and strategy.position_size < 0 ? color.red : color.gray)

// -- Long Exits --
strategy.close('long', when=exitLong and strategy.position_size > 0, comment='EXIT_LONG')

// -- Short Exits --
strategy.close('short', when=exitShort and strategy.position_size < 0, comment='EXIT_SHORT')

bool isStrategyEntryEnabled = true
// -- Long Entries --
if (isStrategyEntryEnabled)
    strategy.entry('long', strategy.long, when=enterLong, comment='ENTER_LONG')
else
    strategy.order('long', strategy.long, when=enterLong, comment='ENTER_LONG')

// -- Short Entries --
if (isStrategyEntryEnabled)
    strategy.entry('short', strategy.short, when=enterShort, comment='ENTER_SHORT')
else
    strategy.order('short', strategy.short, when=enterShort, comment='ENTER_SHORT')