概述
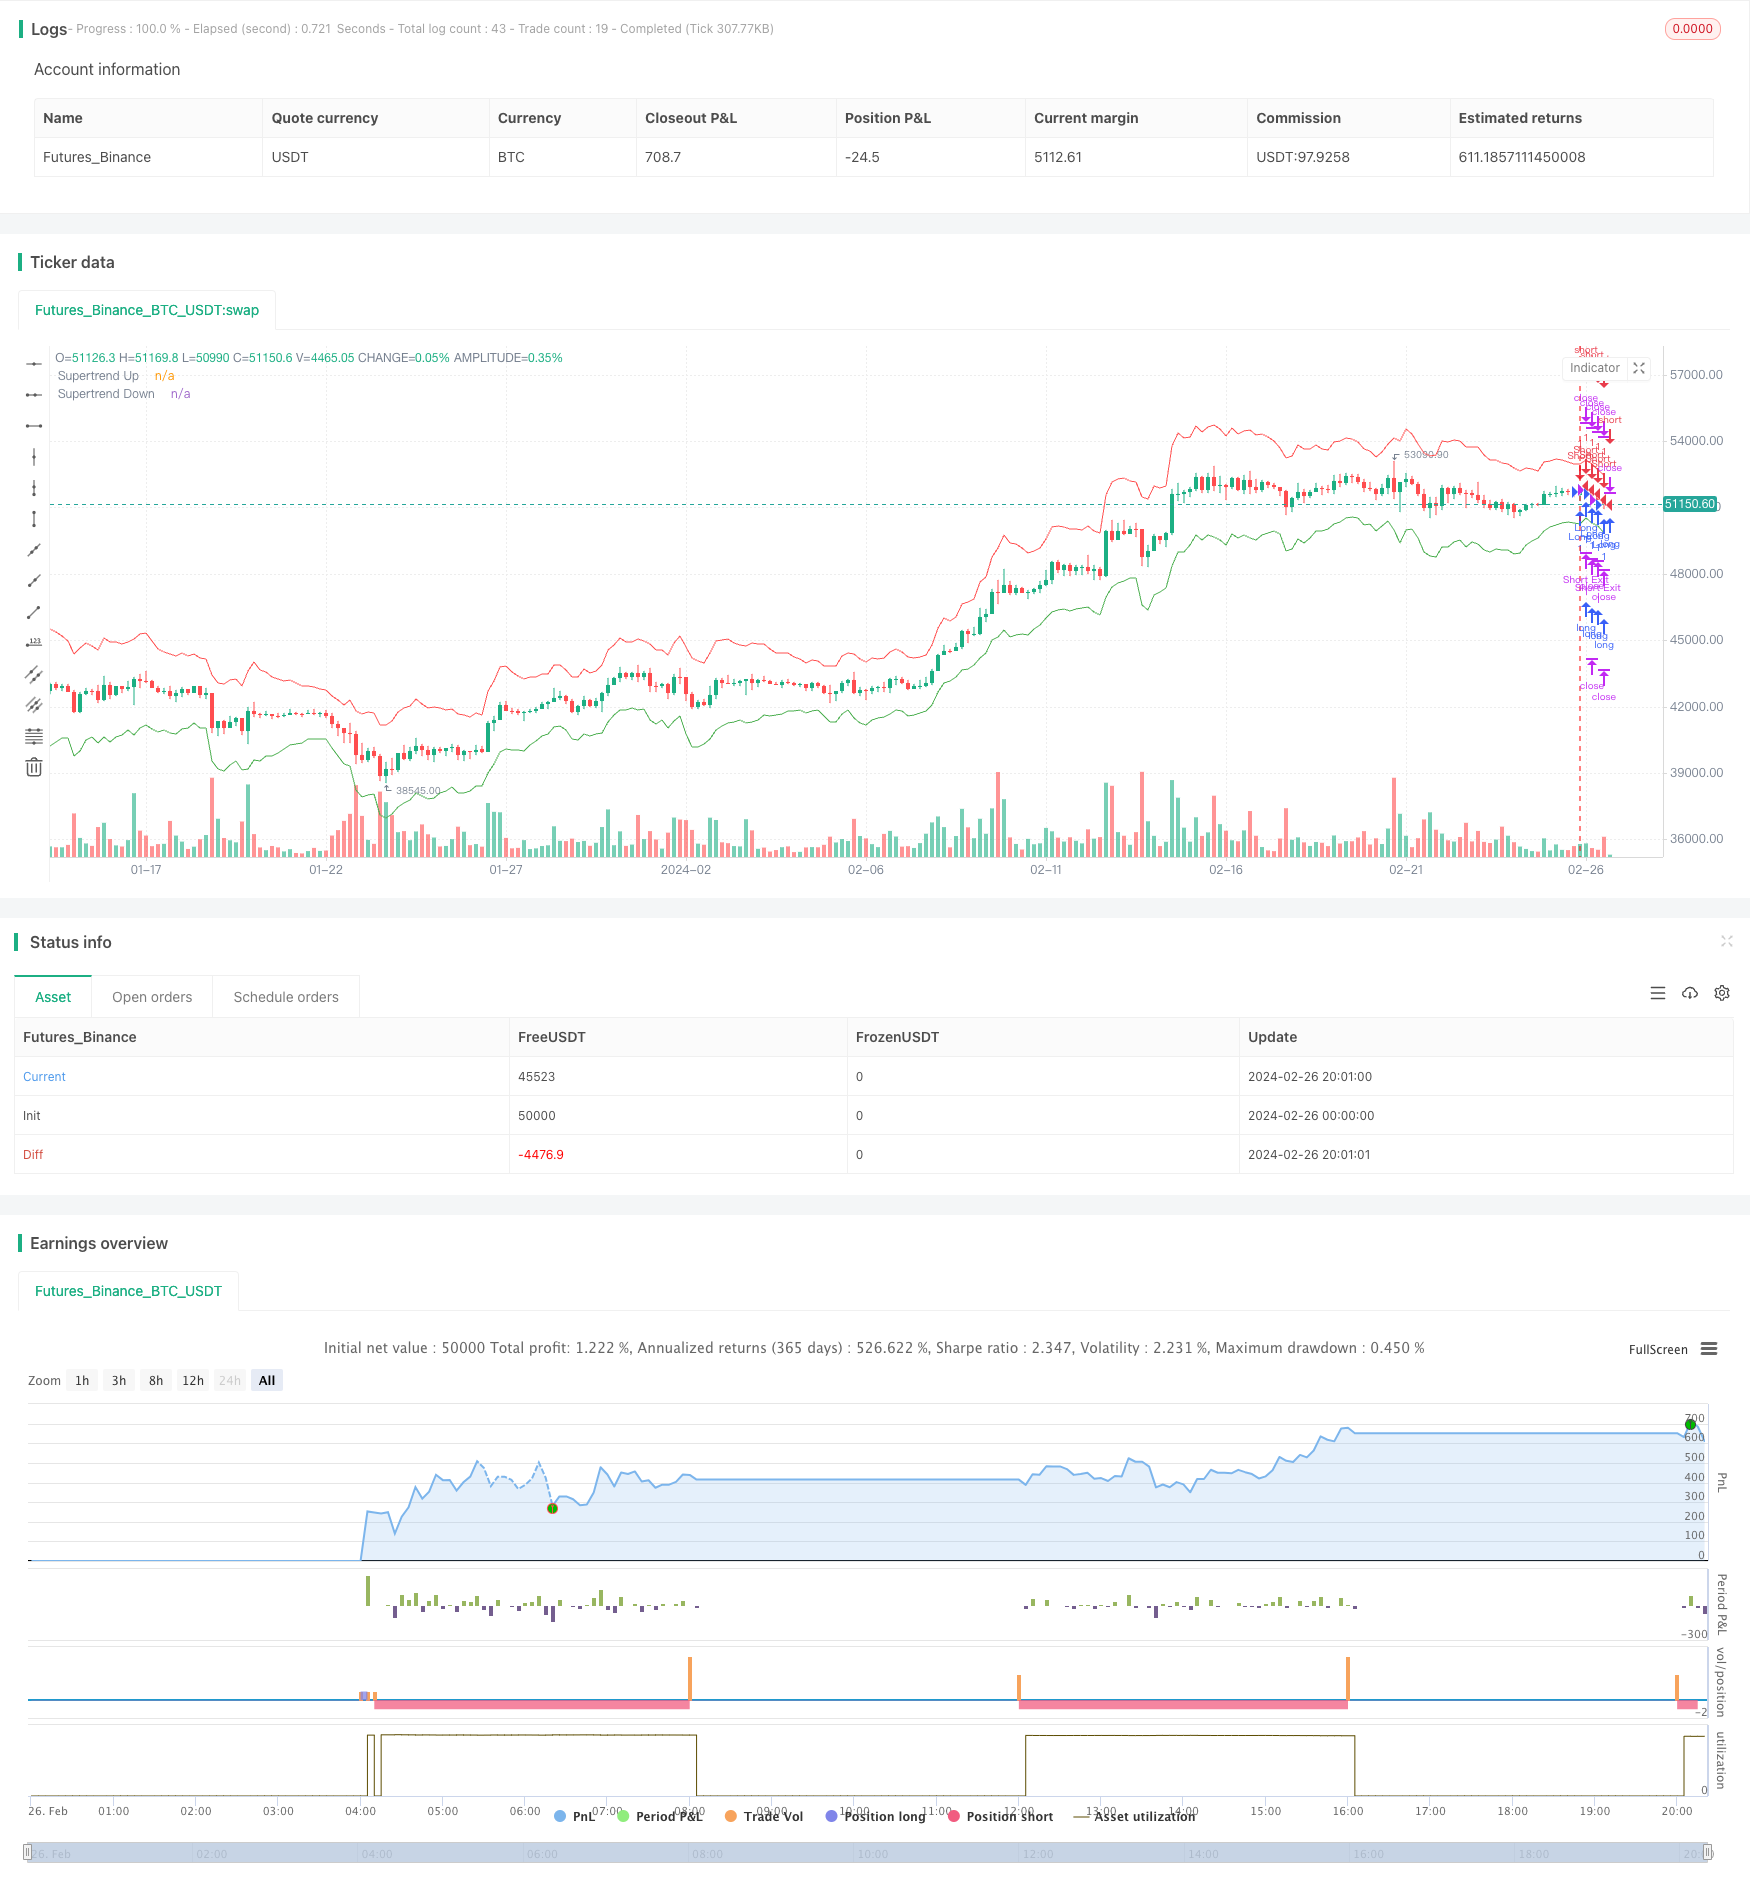
本策略利用平均真实波幅指标和价格计算出的上下轨形成的升降通道,在价格突破通道时产生交易信号。策略具有突出的趋势跟踪能力。
策略原理
本策略首先计算ATR指标作为价格波动的度量,然后结合最高价、最低价、收盘价的平均值,计算出上轨和下轨。当价格上涨突破下轨时,产生买入信号;当价格下跌突破上轨时,产生卖出信号。这样,形成一个自适应的升降通道,跟踪价格趋势。
在入市后,策略会设置目标利润点数和止损点数,当价格达到目标点数时止盈,如果回撤达到止损点数则止损。
优势分析
本策略最大的优势在于其出色的趋势跟踪能力。升降通道能够自适应地调整,捕捉价格趋势的变化。同时,ATR指标的运用也提供了一定的顺势操作的保证。此外,策略中的止盈止损机制也使得盈亏控制更为明确。
风险分析
本策略的一个主要风险在于容易产生较多的空仓期。当价格处于震荡时,常常导致上下通道被频繁触发,则会产生较多无效交易。此外,止损点数设置也会直接影响最终收益。
为降低这些风险,可以考虑优化ATR参数或调整通道宽度,使通道更加贴近真实趋势。此外,也可以结合其他指标过滤入市时机。
优化方向
本策略可以从以下几个方面进行优化:
优化ATR参数。可以测试不同周期参数,使ATR更好地反映真实波动。
通道宽度优化。可以测试不同的乘数值,确定最佳参数。
增加其他指标过滤。比如结合MACD指标判断买卖点,可以一定程度上减少无效交易。
停损点数和止盈点数优化。测试不同参数对最终收益率的影响。
考虑夏普率或盈亏比作为优化目标。以更全面地评估策略质量。
总结
本策略通过自适应升降通道和突破原理实现了出色的趋势跟踪。同时也具备了相对清晰的止盈止损逻辑。通过一定的参数和规则优化,有望进一步增强策略的动态跟踪性能,使之能够适用于更广泛的市场环境。
策略源码
/*backtest
start: 2024-02-26 00:00:00
end: 2024-02-26 20:20:00
period: 4h
basePeriod: 15m
exchanges: [{"eid":"Futures_Binance","currency":"BTC_USDT"}]
*/

//@version=5
strategy("Supertrend Strategy", overlay=true)

// Input parameters
atr_length = input.int(10, title="ATR Length")
multiplier = input.float(3.0, title="Multiplier")

target_points = input.int(100, title="Target Points")
stop_loss_points = input.int(50, title="Stop Loss Points")

// Calculate ATR and Supertrend
atr = ta.atr(atr_length)
upper_band = hlc3 + (multiplier * atr)
lower_band = hlc3 - (multiplier * atr)
is_uptrend = close > lower_band
is_downtrend = close < upper_band
trend_changed = (is_uptrend[1] and is_downtrend) or (is_downtrend[1] and is_uptrend)

// Strategy logic
long_condition = is_uptrend and trend_changed
short_condition = is_downtrend and trend_changed

// Plot Supertrend
plot(is_uptrend ? lower_band : na, color=color.green, title="Supertrend Up", style=plot.style_linebr)
plot(is_downtrend ? upper_band : na, color=color.red, title="Supertrend Down", style=plot.style_linebr)

// Strategy entry and exit
if long_condition
    strategy.entry("Long", strategy.long)
if short_condition
    strategy.entry("Short", strategy.short)

// Calculate target and stop loss levels
long_target = strategy.position_avg_price + target_points
long_stop_loss = strategy.position_avg_price - stop_loss_points
short_target = strategy.position_avg_price - target_points
short_stop_loss = strategy.position_avg_price + stop_loss_points

// Strategy exit
strategy.exit("Long Exit", "Long", limit=long_target, stop=long_stop_loss)
strategy.exit("Short Exit", "Short", limit=short_target, stop=short_stop_loss)