概述
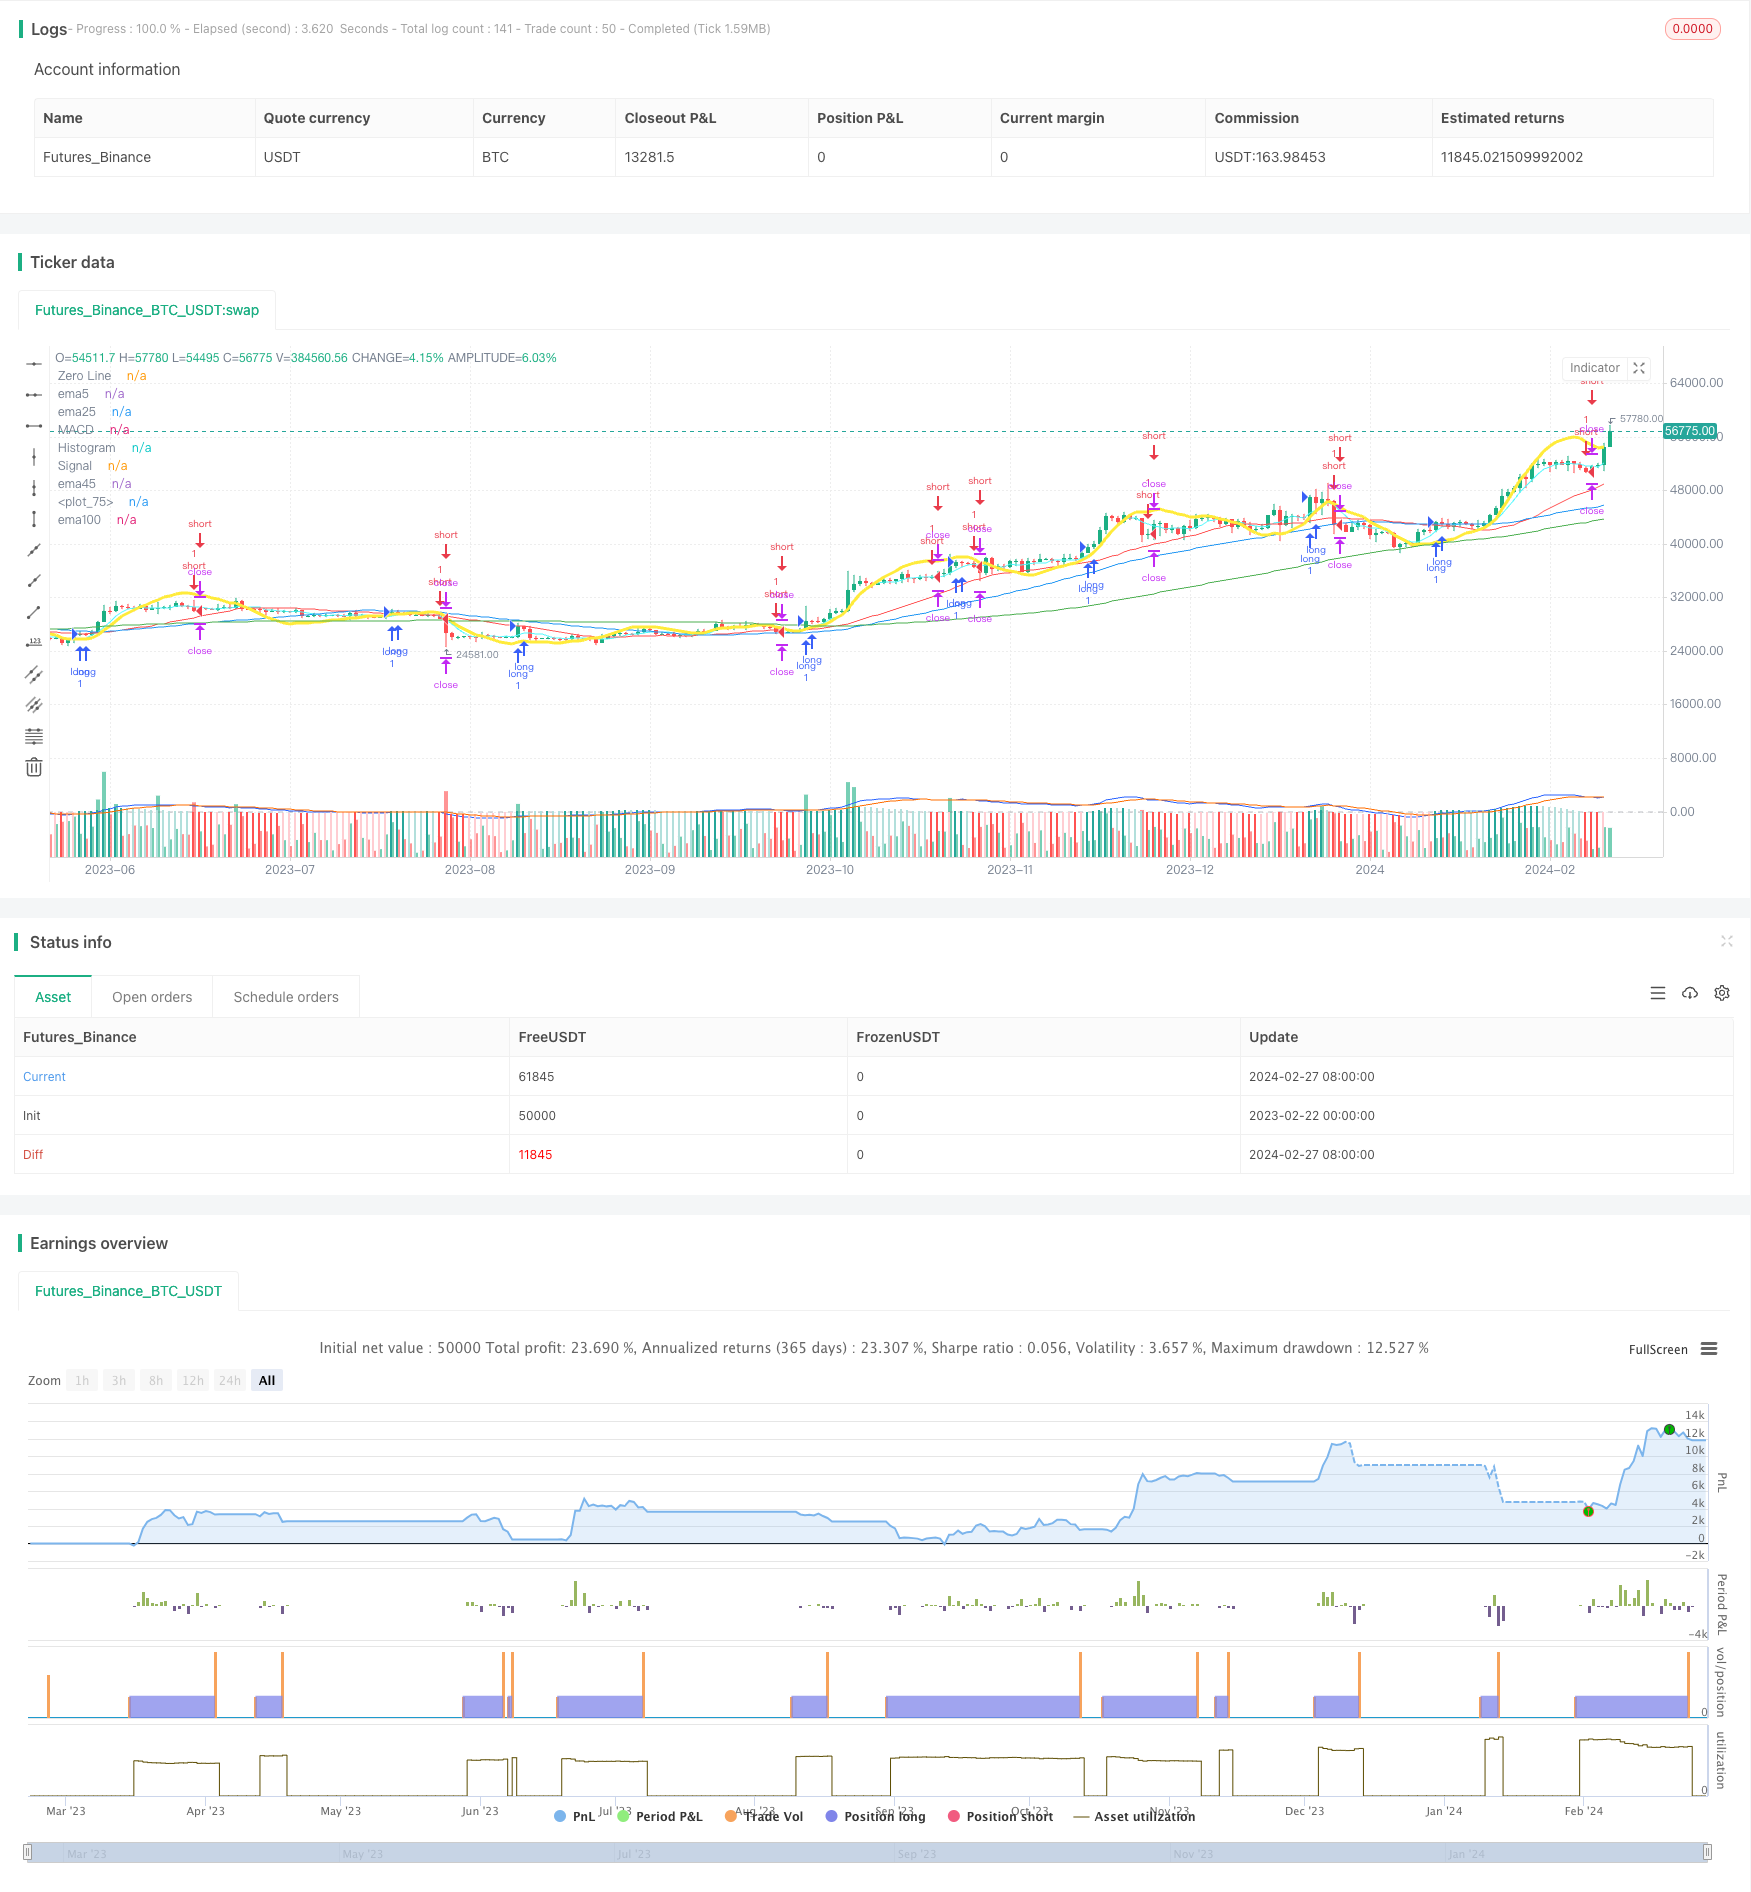
本策略名称为“多重均线交易策略”。该策略利用MACD指标与多重均线的交叉作为交易信号,结合ZLSMA指标辅助判断趋势,设定止盈止损Exiting逻辑,实现自动化交易。
策略原理
计算MACD指标的快线、慢线和MACD柱。设置金叉做多,死叉做空。
计算5日线、25日线、45日线、100日线四条均线。均线越长代表趋势持续性越强。
计算两组均线之间的距离,如果距离超过某一阈值,说明均线发散,可设定为交易信号。
计算ZLSMA指标,表示价格中长线趋势方向。ZLSMA形成拐点时可判断趋势转折。
结合MACD指标交叉、均线发散信号和ZLSMA趋势判断,设定多空交易策略。
设置止盈止损点,实现自动化Exiting逻辑。
优势分析
多重过滤信号提高策略效率。MACD指标与均线发散信号可相互验证,避免假突破。
ZLSMA指标辅助判断中长期趋势方向,避免逆势交易。
自动化Exiting设定止盈止损点,降低人为干预频率。
风险分析
参数设置不当可能导致过度交易或漏单。需要优化参数以达到最佳效果。
固定止盈止损点会限制获利空间或扩大损失。可以结合ATR指标设置动态止损。
均线策略对震荡行情效果不佳,可考虑辅助其他指标或人工干预。
优化方向
优化均线参数组合,测试不同长度均线的效果。
测试加入其他指标,如KDJ、BOLL等判断买卖点。
尝试动态止损策略,根据波动率设置止损位置。
加入机器学习模型,自动寻找最优参数。
总结
本策略整合MACD指标、多重均线和ZLSMA趋势判断实现自动化交易。通过多重信号过滤提高策略稳定性,设置Exiting逻辑降低风险,具有一定的实战价值。后续通过参数优化、指标扩展、止损动态化等手段可进一步提升策略表现。
策略源码
/*backtest
start: 2023-02-22 00:00:00
end: 2024-02-28 00:00:00
period: 1d
basePeriod: 1h
exchanges: [{"eid":"Futures_Binance","currency":"BTC_USDT"}]
*/

//@version=5
strategy("MACD ZLSMA_izumi⑤(4つの条件、MCDがクロスしてたら)", overlay=true)

fast_length = input(title = "Fast Length", defval = 12)
slow_length = input(title = "Slow Length", defval = 26)
src = input(title = "Source", defval = close)
signal_length = input.int(title = "Signal Smoothing",  minval = 1, maxval = 50, defval = 9)
sma_source = input.string(title = "Oscillator MA Type",  defval = "EMA", options = ["SMA", "EMA"])
sma_signal = input.string(title = "Signal Line MA Type", defval = "EMA", options = ["SMA", "EMA"])
// Calculating
fast_ma = sma_source == "SMA" ? ta.sma(src, fast_length) : ta.ema(src, fast_length)
slow_ma = sma_source == "SMA" ? ta.sma(src, slow_length) : ta.ema(src, slow_length)
macd = fast_ma - slow_ma
signal = sma_signal == "SMA" ? ta.sma(macd, signal_length) : ta.ema(macd, signal_length)
hist = macd - signal

alertcondition(hist[1] >= 0 and hist < 0, title = 'Rising to falling', message = 'The MACD histogram switched from a rising to falling state')
alertcondition(hist[1] <= 0 and hist > 0, title = 'Falling to rising', message = 'The MACD histogram switched from a falling to rising state')

hline(0, "Zero Line", color = color.new(#787B86, 50))
plot(hist, title = "Histogram", style = plot.style_columns, color = (hist >= 0 ? (hist[1] < hist ? #26A69A : #B2DFDB) : (hist[1] < hist ? #FFCDD2 : #FF5252)))
plot(macd,   title = "MACD",   color = #2962FF)
plot(signal, title = "Signal", color = #FF6D00)

//MACDクロス設定
enterLong = ta.crossover(macd, signal)
enterShort = ta.crossunder(macd, signal)

//移動平均線の期間を設定
ema5 = input(5, title="ma期間5")
ema25 = input(25, title="ma期間25")
ema45 = input(45, title="ma期間45")
ema100 = input(100, title="ma期間100")

//移動平均線を計算
//sma関数で「ema25」バー分のcloseを移動平均線として「Kema」に設定
Kema5 = ta.sma(close,ema5)
Kema25 = ta.sma(close,ema25)
Kema45 = ta.sma(close,ema45)
Kema100 = ta.sma(close,ema100)


//移動平均線をプロット
plot(Kema5, color=color.rgb(82, 249, 255),title="ema5")
plot(Kema25, color=color.red,title="ema25")
plot(Kema45, color=color.blue,title="ema45")
plot(Kema100, color=color.green,title="ema100")

//ema同士の距離が30以上の時に「distancOK」にTureを返す
//distance1 = math.abs(Kema5-Kema25)
distance2 = math.abs(Kema25-Kema45)
distanceValue1 = input(0.030, title ="ema同士の乖離値")
//distanceOk1 = distance1 > distanceValue1
distanceOk2 = distance2 > distanceValue1

//2区間のema同士の距離が30以上の時に「distanceOKK」にTrueを返す
//distanceOkK1 = distanceOk1 and distanceOk2
distanceOkK1 = distanceOk2

//5EMAとロウソクの乖離判定
//DistanceValue5ema = input(0.03, title ="5emaとロウソクの乖離率")
//emaDistance = math.abs(Kema5 - close)
//emaDistance5ema = emaDistance < DistanceValue5ema

//ZLSMA追加のコード
length = input.int(32, title="Length")
offset = input.int(0, title="offset")
src2 = input(close, title="Source")
lsma = ta.linreg(src2, length, offset)
lsma2 = ta.linreg(lsma, length, offset)
eq= lsma-lsma2
zlsma = lsma+eq
//ZLSMAのプロット
plot(zlsma, color=color.yellow, linewidth=3)

//ZLSMAの前回高値を検索
//var float zlsmaHigh = na
//var float zlsmaHighValue = na
//if ta.highest(zlsma,35) == zlsma[3]
//    zlsmaHighValue := zlsmaHigh
//    zlsmaHigh := zlsma[3]

//if (na(zlsmaHighValue))
 //   zlsmaHighValue := zlsmaHigh

//ZLSMAの前回安値を検索
//var float zlsmaLow = na
//var float zlsmaLowValue = na
//if ta.lowest(zlsma,35) == zlsma[3]
//    zlsmaLowValue := zlsmaLow
//    zlsmaLow := zlsma[3]

///if (na(zlsmaLowValue))
//    zlsmaLowValue := zlsmaLow

//利確・損切りポイントの初期化(変数の初期化)
var longProfit = 0.0
var longStop = 0.0
var shortProfit = 0.0
var shortStop = 0.0

//inputで設定画面の選択項目を設定
longProfitValue = input(0.06, title ="ロング利確pips")
shortProfitValue = input(-0.06, title ="ショート利確pips")
longStopValue = input(-0.06, title ="ロング損切pips")
shortStopValue = input(0.06, title ="ショート損切pips")

// クロスの強さを推定
//angleThreshold = input(0.001, title = "クロスの強さ調節" )

// クロスの強さの閾値、この値を調整してクロスの強さの基準を変える
//macdDiff = macdLine - signalLine
//strongCross = math.abs(macdDiff) > angleThreshold

// エントリー条件 (MACDラインとシグナルラインがクロス)
//ta.crossover(macdLine, signalLine) and strongCross


//ロングエントリー条件
if  distanceOkK1 and enterLong
	strategy.entry("long", strategy.long, comment="long")
    longProfit := close + longProfitValue
    longStop := close + longStopValue

//    if na(strategy.position_avg_price) and close>strategy.position_avg_price + 0.05 * syminfo.mintick
 //       longStop := strategy.position_avg_price + 10 * syminfo.mintick
  //  strategy.exit("exit", "long",stop = longStop)

strategy.exit("exit", "long", limit = longProfit,stop = longStop)


if  distanceOkK1 and enterShort
	strategy.entry("short", strategy.short, comment="short")
    shortProfit := close + shortProfitValue
    shortStop := close + shortStopValue

 //   if na(strategy.position_avg_price) and close>strategy.position_avg_price - 0.05 * syminfo.mintick
  //      shortStop := strategy.position_avg_price - 0.1 * syminfo.mintick
  //  strategy.exit("exit", "long",stop = longStop)


strategy.exit("exit", "short", limit = shortProfit,stop = shortStop)
//plot(strategy.equity, title="equity", color=color.red, linewidth=2, style=plot.style_areabr)