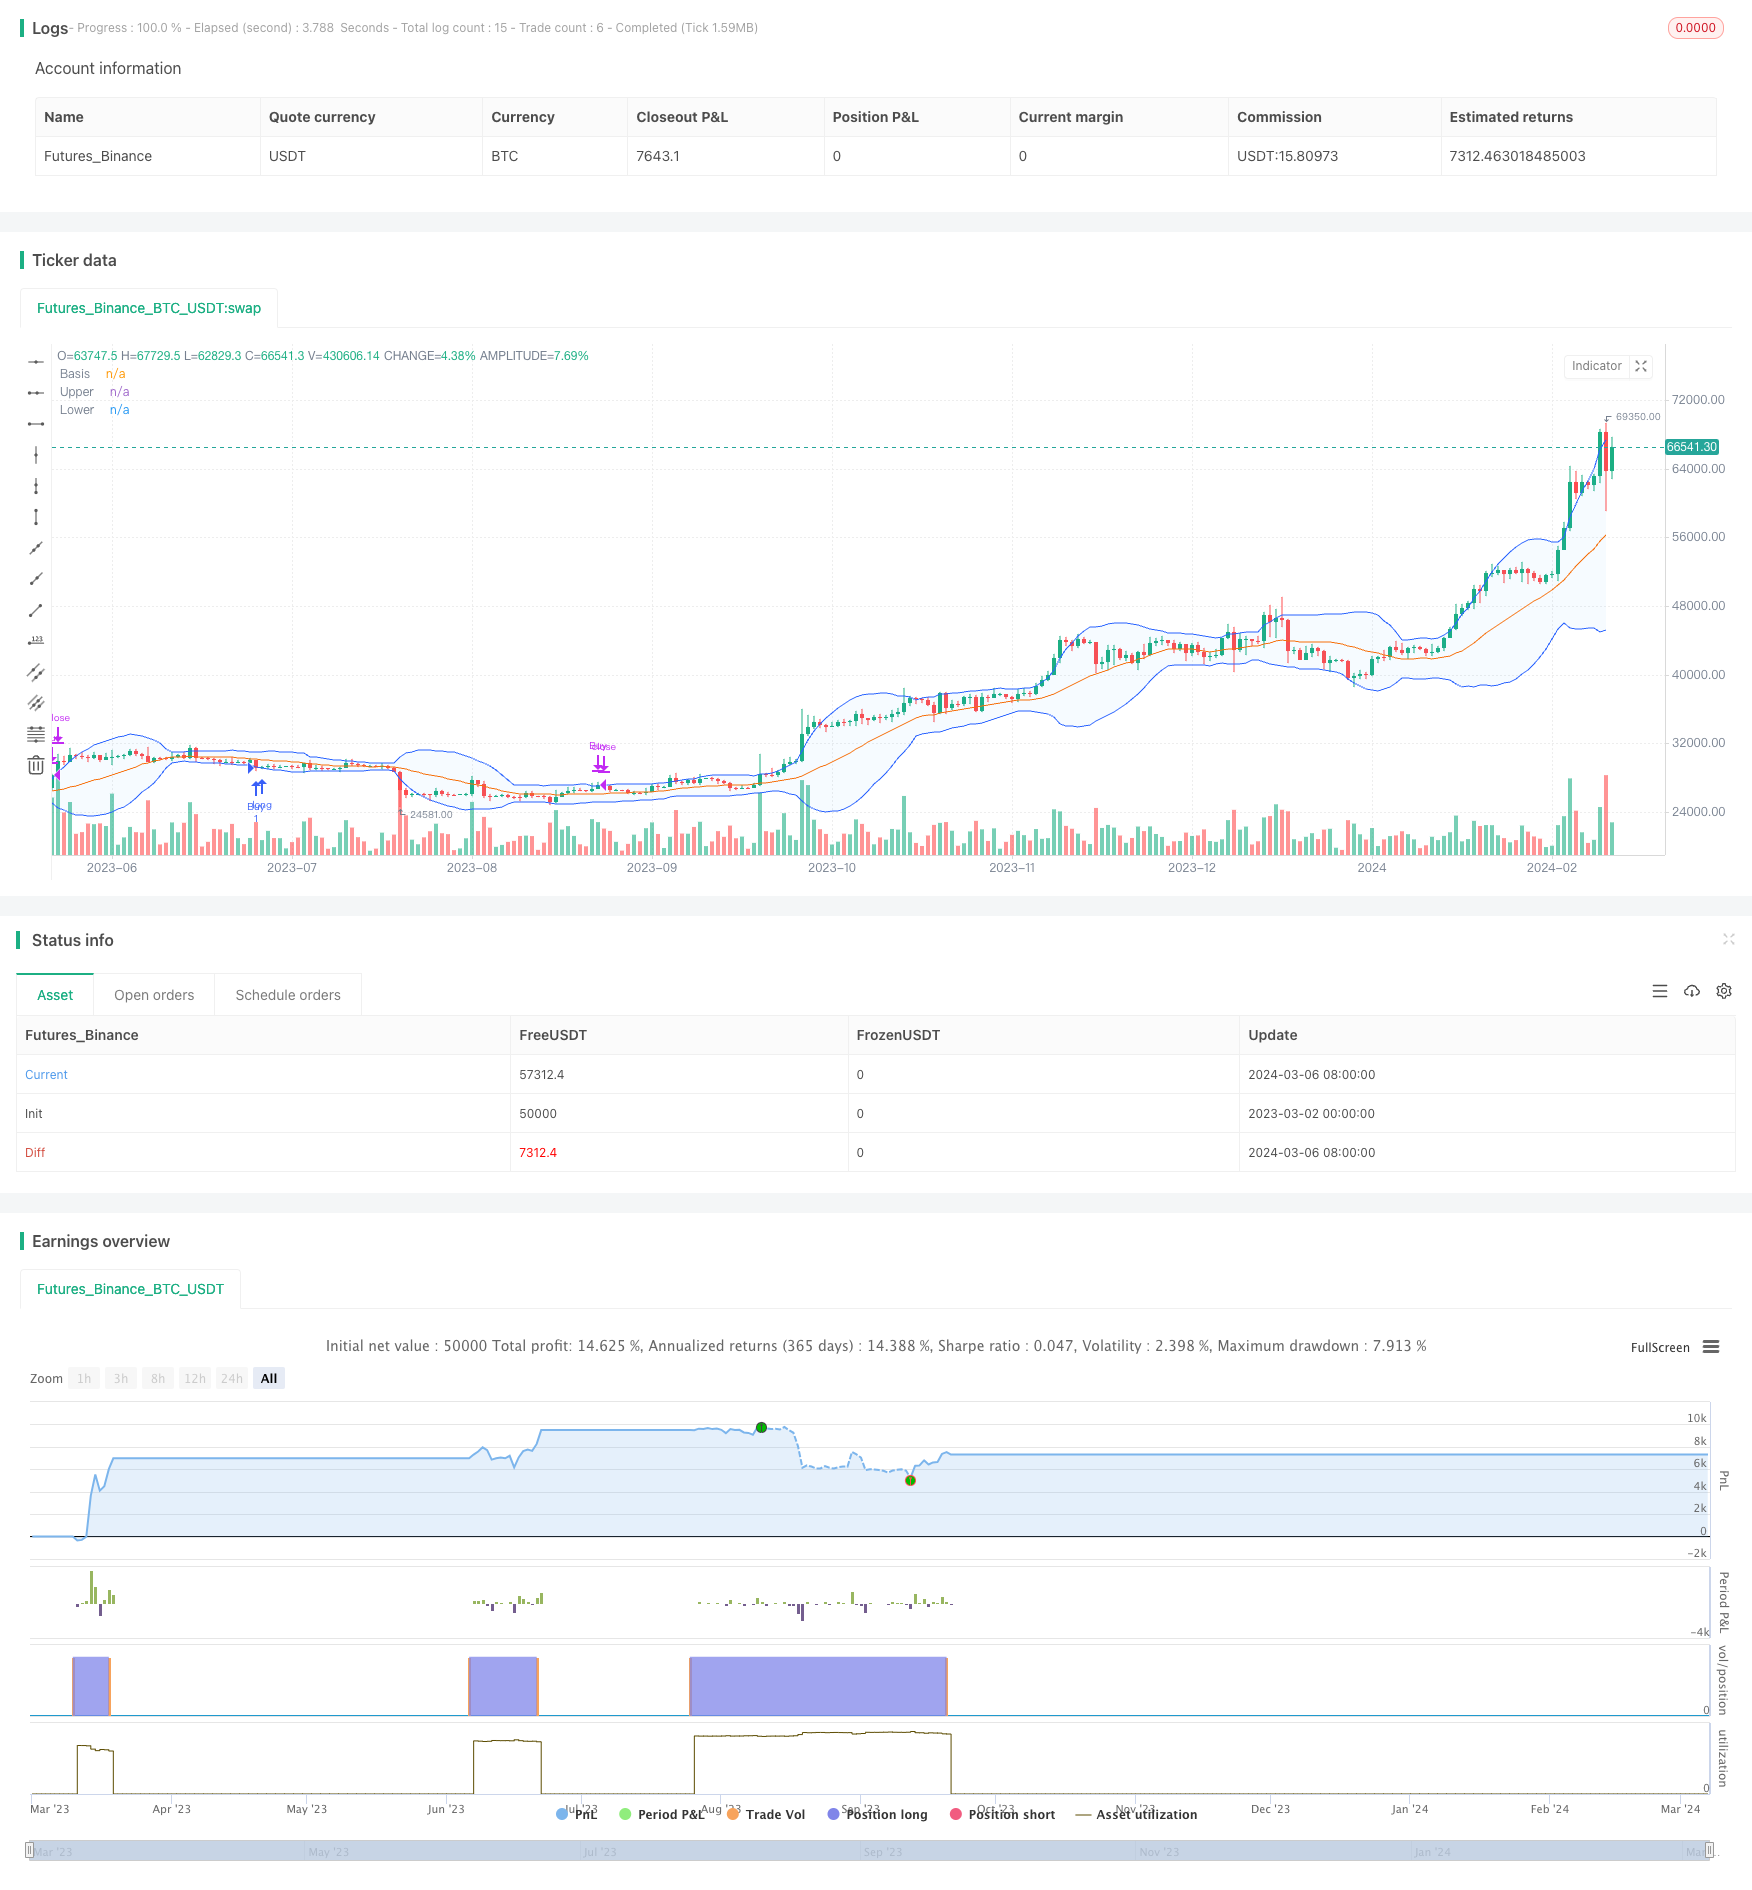
The Bollinger Bands Mean Reversion Strategy is a quantitative trading strategy based on the Bollinger Bands indicator. The strategy utilizes the statistical regularity of prices fluctuating around the moving average, aiming to profit from price reversals towards the mean by taking opposite positions when prices deviate from the upper or lower bands.
Bollinger Bands consist of three lines: the middle band is the moving average, while the upper and lower bands are a certain number of standard deviations above and below the middle band. According to statistical principles, in a normal distribution, approximately 95% of values will fall within two standard deviations of the mean.
The Bollinger Bands Mean Reversion Strategy leverages this principle. When the price crosses above the upper band, it suggests that the price may be overbought and at risk of a pullback; when the price crosses below the lower band, it indicates that the price may be oversold and has a potential for a rebound. Therefore, this strategy goes short when the price hits the upper band and goes long when it hits the lower band, aiming to capture the profit potential as the price reverts to the mean.
The main logic of the strategy code is as follows:
Calculate the moving average of the specified period as the middle band of the Bollinger Bands. Various types of moving averages can be selected, such as SMA, EMA, SMMA, WMA, VWMA, etc.
Calculate the standard deviation of the price over the same period, and combine it with the user-defined multiple parameter to obtain the upper and lower bands.
When the closing price crosses above the upper band, a sell signal is triggered; when the closing price crosses below the lower band, a buy signal is triggered.
The strategy executes trades: open a long position when a buy signal is triggered, and close the position when a sell signal appears.
Through this process, the strategy establishes opposite positions when prices significantly deviate from the moving average, and profits when prices revert to the mean.
The Bollinger Bands Mean Reversion Strategy has the following advantages:
Simple logic and easy to understand and implement. The strategy is based on basic statistical principles, using Bollinger Bands to characterize the range of price fluctuations, with clear entry and exit conditions.
High adaptability and applicability to multiple markets and instruments. Bollinger Bands are a versatile technical indicator with a certain level of adaptability to both trending and oscillating markets. Users can flexibly adjust parameters to adapt to different market characteristics.
Captures opportunities from price volatility. The expansion and contraction of Bollinger Bands reflect the volatility of prices. By establishing positions when prices reach relative highs or lows, the strategy seeks to profit from the reversion of prices to the mean.
Relatively clear take-profit and stop-loss levels. Since Bollinger Bands correspond to a certain confidence interval, the take-profit and stop-loss levels of this strategy are relatively easy to determine, which helps control risk.
Although the Bollinger Bands Mean Reversion Strategy has its advantages, it also carries certain risks:
Underperformance in trending markets. If the market exhibits a continuous unilateral trend, with prices persistently running near the upper or lower bands, the strategy may frequently incur losing trades.
Sensitivity to parameter settings. The period and multiple parameters of the Bollinger Bands have a significant impact on the strategy’s performance. Different parameter combinations may lead to drastically different results. If the parameters are not set properly, the effectiveness of the strategy will be greatly diminished.
Risk of frequent oscillations. When market volatility is high and prices frequently oscillate between the upper and lower bands, the strategy may experience consecutive small losses, leading to a decline in overall profitability.
Lack of consideration for trading costs. The example code does not take into account factors such as spreads and commissions. In practical applications, these factors will impact the strategy’s net profitability to a certain extent.
To address these risks, the following measures can be considered to optimize the strategy:
Incorporate trend indicators for filtering. When judging signals, auxiliary trend indicators such as moving averages can be used to avoid frequent trading in unilateral trends.
Optimize parameter selection. By backtesting historical data and analyzing the strategy’s performance under different parameter combinations, select the optimal parameters suitable for the current market. Regularly evaluate and adjust parameters.
Introduce other filtering conditions. For example, consider volatility indicators like ATR and suspend trading when volatility is too high; or reference other indicators like trading volume to further confirm the reliability of signals.
Incorporate trading cost factors. In backtesting and live trading, spreads, commissions, and other trading costs should be included in calculations to more accurately assess the strategy’s actual performance.
In addition to the risk mitigation measures mentioned above, the Bollinger Bands Mean Reversion Strategy can be optimized in the following aspects:
Dynamic parameter adjustment. Dynamically adjust the period and multiple parameters of the Bollinger Bands based on changes in the market. Consider using adaptive moving averages (such as KAMA) as the middle band or dynamically adjust the multiple parameter based on indicators like ATR to adapt to the current market rhythm.
Introduce long-short position management. When opening positions, dynamically adjust the position size based on the distance between the price and the middle band. The further away from the middle band, the smaller the position size to control risk; the closer to the middle band, the larger the position size to capture more opportunities.
Combine with other technical indicators. Use Bollinger Bands in conjunction with other technical indicators (such as RSI, MACD, etc.) to form a more robust signal confirmation mechanism. Only trade when multiple indicators resonate, improving the reliability of signals.
Consider multi-position management. Under appropriate conditions, multiple positions can be held simultaneously to diversify risk. For example, apply the strategy on different time frames or simultaneously open positions on different trading instruments to obtain more stable returns.
The purpose of these optimization measures is to improve the adaptability, robustness, and profitability of the strategy. Through dynamic adjustments, multi-indicator combinations, position management, and other means, the strategy can better cope with market changes, control risks, and capture more trading opportunities.
The Bollinger Bands Mean Reversion Strategy is a quantitative trading strategy based on statistical principles. It characterizes the range of price fluctuations using Bollinger Bands and takes opposite positions when prices deviate from the upper or lower bands, aiming to profit from mean reversion. The strategy has simple logic, strong adaptability, and the ability to capture opportunities from price volatility. However, it also faces risks such as underperformance in trending markets, sensitivity to parameter settings, and frequent oscillations.
To address these risks, optimization measures can be taken, such as incorporating trend indicators, optimizing parameter selection, introducing other filtering conditions, and considering trading costs. Furthermore, the strategy’s adaptability and robustness can be enhanced through dynamic parameter adjustments, long-short position management, combining with other technical indicators, and multi-position management.
Overall, the Bollinger Bands Mean Reversion Strategy provides a simple yet effective approach to quantitative trading. In practical applications, the strategy needs to be appropriately optimized and refined based on specific market characteristics and trading requirements. Through continuous testing and adjustment, finding the most suitable trading method for oneself is the key to long-term success in quantitative trading.
/*backtest start: 2023-03-02 00:00:00 end: 2024-03-07 00:00:00 period: 1d basePeriod: 1h exchanges: [{"eid":"Futures_Binance","currency":"BTC_USDT"}] */ //@version=5 strategy("BB Strategy", shorttitle="BB", overlay=true) length = input.int(20, minval=1) maType = input.string("SMA", "Basis MA Type", options = ["SMA", "EMA", "SMMA (RMA)", "WMA", "VWMA"]) src = input(close, title="Source") mult = input.float(2.0, minval=0.001, maxval=50, title="StdDev") // Calculate moving average based on selected type ma(source, length, _type) => switch _type "SMA" => ta.sma(source, length) "EMA" => ta.ema(source, length) "SMMA (RMA)" => ta.rma(source, length) "WMA" => ta.wma(source, length) "VWMA" => ta.vwma(source, length) // Calculate Bollinger Bands basis = ma(src, length, maType) dev = mult * ta.stdev(src, length) upper = basis + dev lower = basis - dev // Plot Bollinger Bands plot(basis, "Basis", color=#FF6D00) p1 = plot(upper, "Upper", color=#2962FF) p2 = plot(lower, "Lower", color=#2962FF) fill(p1, p2, title = "Background", color=color.rgb(33, 150, 243, 95)) // Buy condition: Price below lower Bollinger Band buy_condition = close < lower // Sell condition: Price above upper Bollinger Band sell_condition = close > upper // Execute trades strategy.entry("Buy", strategy.long, when=buy_condition) strategy.close("Buy", when=sell_condition)