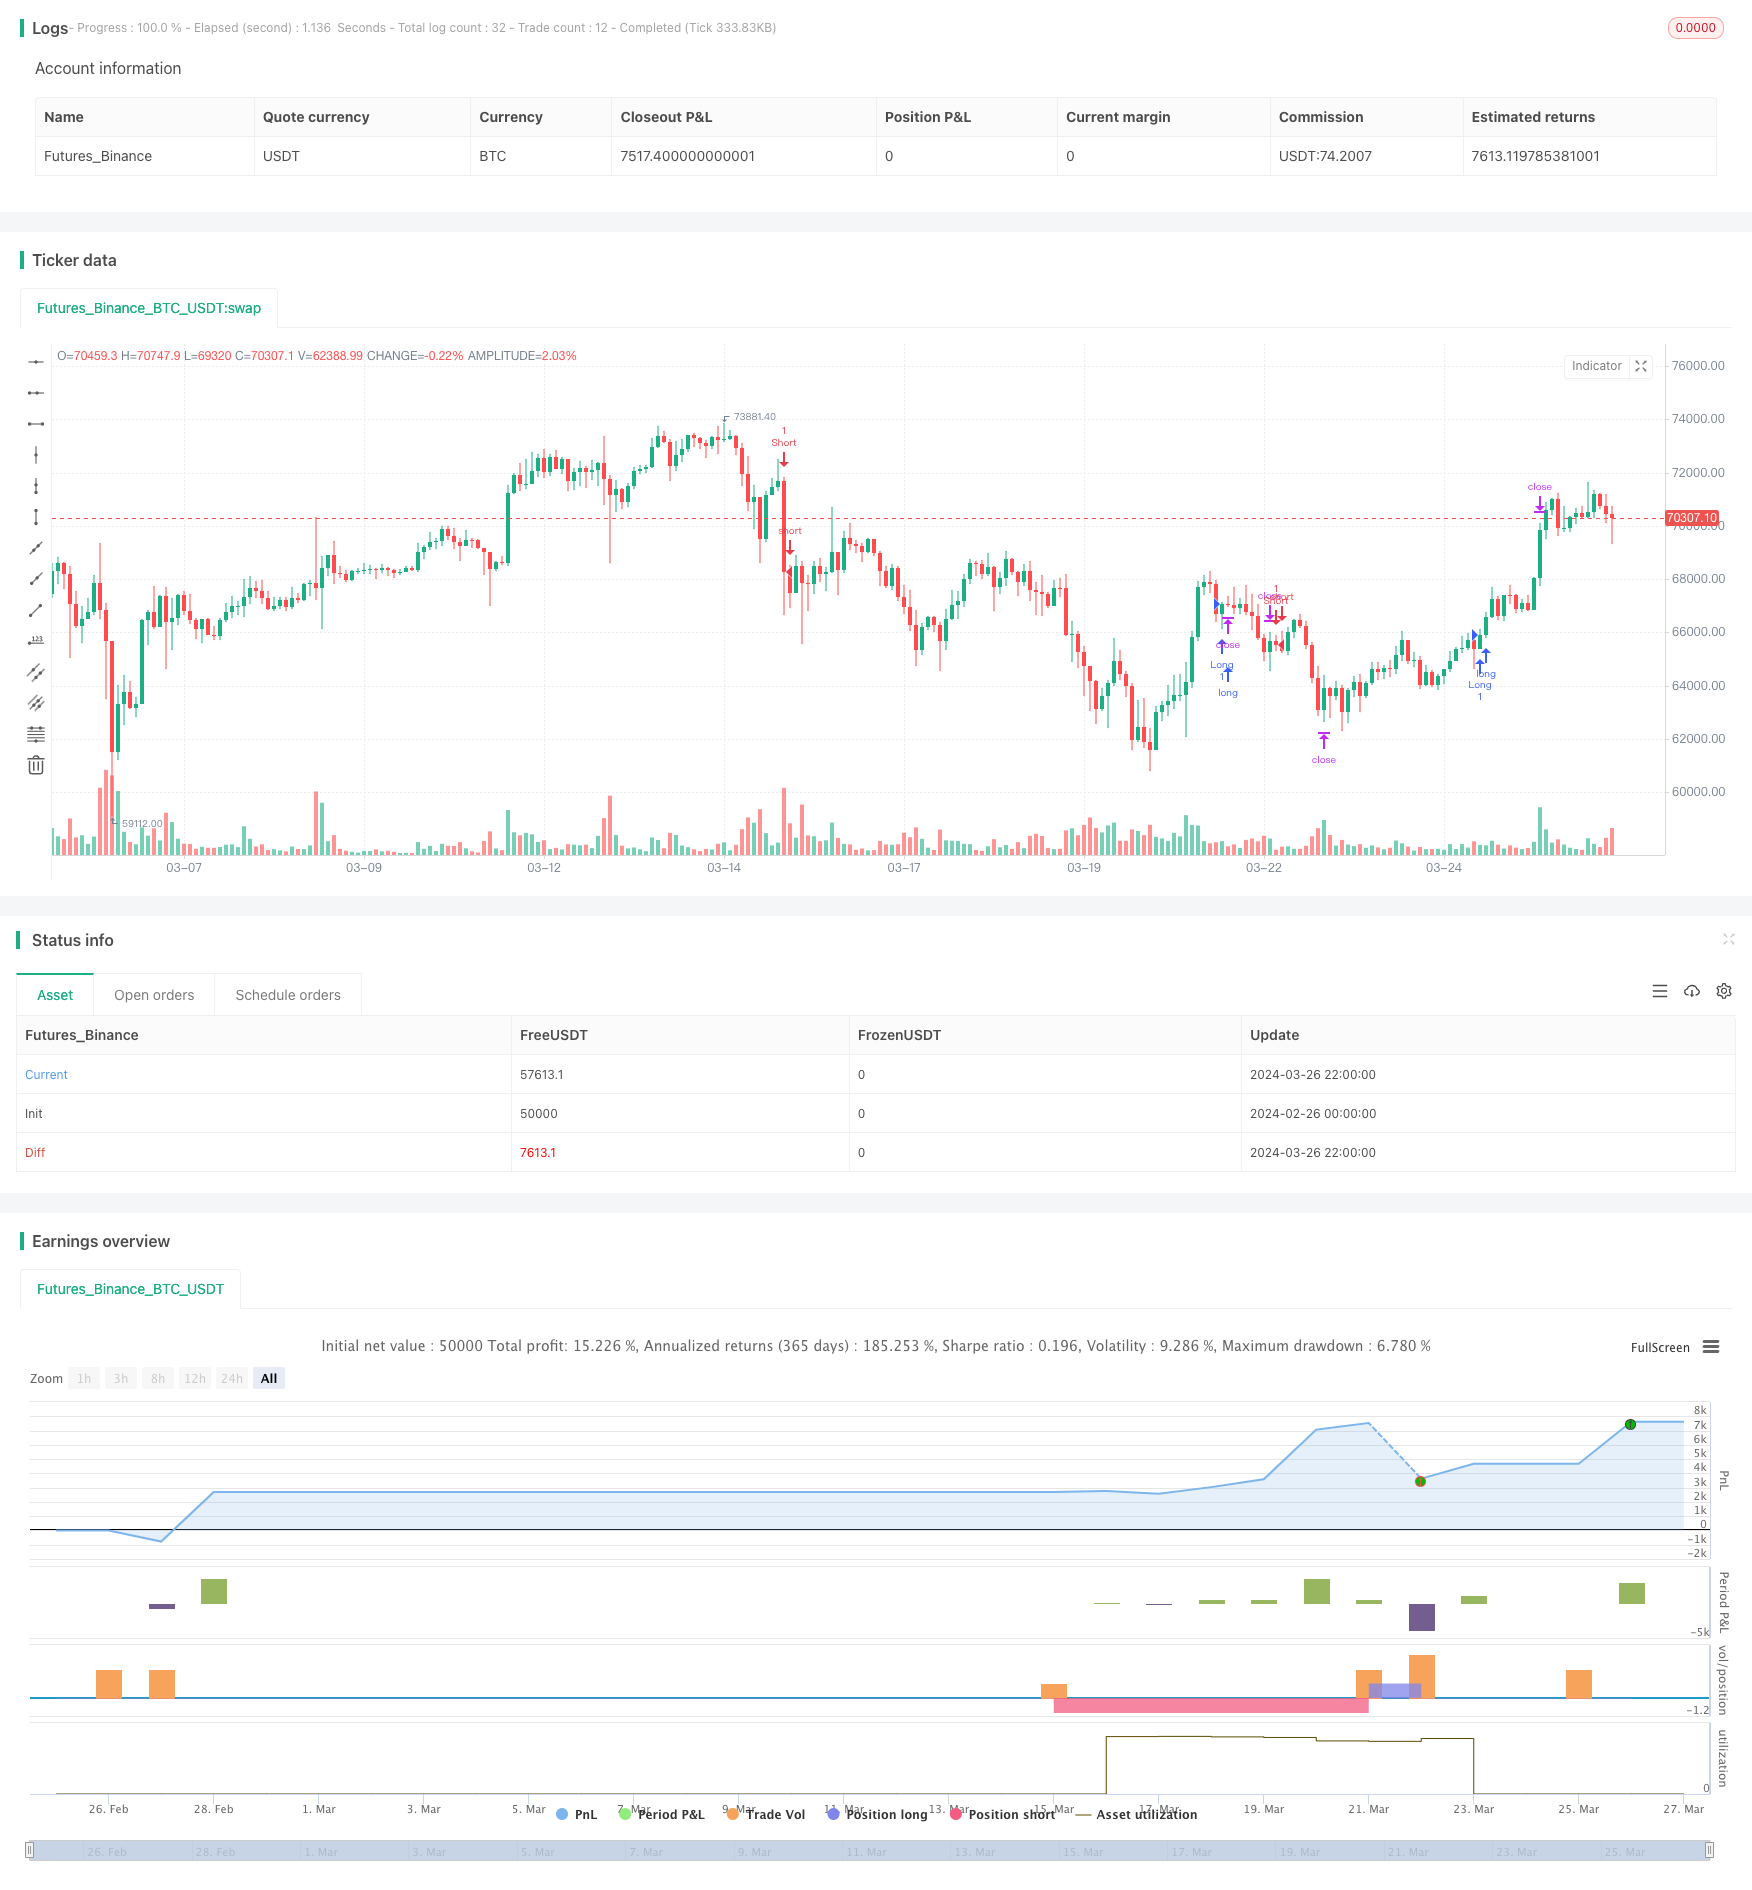
概述
ADR均线交叉策略是一个基于TradingView平台的量化交易策略,融合了多个技术指标来判断趋势、过滤信号并设置止盈止损。该策略采用两条不同周期的指数移动平均线(EMA)来识别主要趋势,使用平均真实波幅(ATR)作为波动率过滤器,并根据风险回报比动态设置止盈止损。此外,该策略还引入了交易时间窗口、盈亏平衡、最大日亏损等风控措施,力求在把握趋势机会的同时,严格控制下行风险。
策略原理
双均线交叉:策略采用两条不同周期的EMA线来判断趋势。当短期EMA上穿长期EMA时,认为趋势向上,产生做多信号;反之,当短期EMA下穿长期EMA时,认为趋势向下,产生做空信号。
ADR波动率过滤:为了避免在波动率较低的环境下产生交易信号,策略引入了ADR指标作为波动率过滤器。只有当ADR值高于预设的最小阈值时,才允许开仓。
交易时间窗口:该策略允许用户设置每日交易的起止时间。只有在指定的时间窗口内,才会执行交易。这有助于避开流动性较差或波动性较大的时段。
动态止盈止损:策略根据最近N根K线的平均最高价和最低价,并结合预设的风险回报比,动态计算止盈价和止损价。这确保了每笔交易的风险回报是可控的。
盈亏平衡:当持仓达到一定的盈利幅度后(用户可设置风险回报比),策略会将止损位上移至开仓价格,即盈亏平衡位。这有助于保护已获得的利润。
最大日亏损限制:为了控制单日最大亏损,策略设置了每日亏损限额。一旦当日亏损达到该限额,策略将停止交易,直到第二天开盘。
收盘平仓:无论持仓是否触及止盈或止损线,策略都会在每个交易日的固定时间(如16:00)平掉所有仓位,避免隔夜风险。
优势分析
趋势跟踪能力强:通过双均线交叉来判断趋势,可以有效捕捉到市场的主要趋势,从而提高策略的胜率和盈利潜力。
波动率适应性好:引入ADR指标作为波动率过滤器,可以避免在波动率较低的环境下频繁交易,减少了无效信号和虚假突破带来的损失。
风险控制严格:该策略从多个维度设置了风控措施,包括动态止盈止损、盈亏平衡、最大日亏损限制等,有效控制了策略的下行风险,提高了风险调整后收益。
参数灵活可调:策略的各项参数,如均线周期、ADR的长度、风险回报比、交易时间窗口等,都可以根据用户的偏好和市场特点进行灵活设置,从而优化策略表现。
自动化程度高:该策略基于TradingView平台,交易逻辑完全由程序自动执行,减少了人为情绪和主观判断的干扰,有利于战略的长期稳定运行。
风险分析
参数优化风险:尽管该策略的参数可以灵活调整,但如果优化过度,可能会导致过度拟合,在样本外表现不佳。因此,在参数设置时,需要进行充分的回测和分析,以确保策略的稳健性。
突发事件风险:该策略主要基于技术指标交易,对于一些突发的重大基本面事件,如政策变动、经济数据大幅波动等,可能反应不足,导致较大的回撤。
趋势转折风险:在趋势转折的关键时期,双均线交叉信号可能会出现延迟,导致策略错过最佳的建仓时机,或者在趋势反转初期遭受损失。
流动性风险:尽管策略设置了交易时间窗口,但如果交易的标的流动性较差,仍可能面临滑点、交易延迟等风险,影响策略表现。
技术指标失效风险:该策略高度依赖于技术指标,如果市场环境发生重大变化,导致指标失去原有的指示意义,策略的有效性可能会下降。
优化方向
引入更多维度的指标:在现有双均线和ADR的基础上,可以考虑引入更多有效的技术指标,如MACD、RSI等,以提高信号的可靠性和稳健性。
动态优化参数:可以建立一套参数优化的机制,根据不同的市场状态(如趋势型、震荡型等),动态调整策略的关键参数,以适应市场的变化。
加入基本面因素:适当考虑一些重要的基本面指标,如经济数据、政策风向等,可以帮助策略更好地把握市场趋势,并及时规避系统性风险。
改进止盈止损机制:在现有的动态止盈止损基础上,可以进一步优化止盈止损的逻辑,如引入追踪止损、部分止盈等方法,以更好地保护利润和控制风险。
多标的、多时间周期:将该策略扩展到多个交易标的和多个时间周期上,通过分散投资和时间周期的优化,提高策略的适应性和稳定性。
总结
ADR均线交叉策略是一个基于技术分析的量化交易策略,通过双均线交叉来判断趋势,并使用ADR指标进行波动率过滤。该策略还设置了严格的风控措施,包括动态止盈止损、盈亏平衡、最大日亏损限制等,以控制下行风险。策略的优势在于趋势跟踪能力强、波动率适应性好、风险控制严格、参数灵活可调、自动化程度高。但同时也存在一些风险,如参数优化风险、突发事件风险、趋势转折风险、流动性风险和技术指标失效风险。未来,该策略可以考虑从引入更多维度指标、动态优化参数、加入基本面因素、改进止盈止损机制、扩展到多标的多周期等方面进行优化和改进,以进一步提升策略的稳健性和盈利能力。总的来说,ADR均线交叉策略为量化交易者提供了一个可供参考的交易模型,但在实际应用中还需要根据自己的风险偏好和交易风格进行适当的调整和优化。
/*backtest
start: 2024-02-26 00:00:00
end: 2024-03-27 00:00:00
period: 2h
basePeriod: 15m
exchanges: [{"eid":"Futures_Binance","currency":"BTC_USDT"}]
*/

// This Pine Script™ code is subject to the terms of the Mozilla Public License 2.0 at https://mozilla.org/MPL/2.0/
// © Sameh_Hussein

//@version=5
strategy('EMA Cross ADR Strategy with Stats', overlay=true)

// Adjustable Parameters
shortEmaLength = input(10, title='Short EMA Length')
longEmaLength = input(50, title='Long EMA Length')
adrLength = input(14, title='ADR Length')
riskRewardRatio = input(2.0, title='Risk/Reward Ratio')
lookbackCandles = input(10, title='Lookback Candles for Stop Loss')
startTime = input(0900, title='Start Time')
endTime = input(1600, title='End Time')
minAdrValue = input(10, title='Minimum ADR Value for Entry')
breakEvenProfit = input.float(1.0, title='Break-Even Profit', minval=0.0)
breakEvenRR = input.float(1.0, title='Break-Even Risk-Reward Ratio', minval=0.0)
dailyLossLimit = input(-2000.0, title='Daily Loss Limit')

// Exponential Moving Averages
shortEma = ta.ema(close, shortEmaLength)
longEma = ta.ema(close, longEmaLength)

// Average Daily Range
adr = ta.sma(ta.tr, adrLength)

// Time Filter Function
timeFilter() => true

// Entry Conditions with ADR filter
longCondition = ta.crossover(shortEma, longEma) and timeFilter() and adr > minAdrValue
shortCondition = ta.crossunder(shortEma, longEma) and timeFilter() and adr > minAdrValue

// Calculate the average low and average high of the previous 'lookbackCandles' candles
averageLow = ta.sma(low, lookbackCandles)
averageHigh = ta.sma(high, lookbackCandles)

// Risk and Reward Calculation
stopLossLong = averageLow
takeProfitLong = close + (close - averageLow) * riskRewardRatio
stopLossShort = averageHigh
takeProfitShort = close - (averageHigh - close) * riskRewardRatio

// Entry Control Variables
var longEntryAllowed = true
var shortEntryAllowed = true

// Update entry price on trade execution
var float entryPriceLong = na
var float entryPriceShort = na

if (strategy.position_size > 0)
    if (strategy.position_size[1] <= 0)
        entryPriceLong := strategy.opentrades.entry_price(strategy.opentrades - 1)
    else
        entryPriceLong := entryPriceLong
else
    entryPriceLong := na

if (strategy.position_size < 0)
    if (strategy.position_size[1] >= 0)
        entryPriceShort := strategy.opentrades.entry_price(strategy.opentrades - 1)
    else
        entryPriceShort := entryPriceShort
else
    entryPriceShort := na

// Adjust stop loss to break-even plus the defined profit when the specified risk-reward ratio is reached
breakEvenTriggerLong = entryPriceLong + (entryPriceLong - stopLossLong) * breakEvenRR
breakEvenTriggerShort = entryPriceShort - (stopLossShort - entryPriceShort) * breakEvenRR

if (longEntryAllowed and close >= breakEvenTriggerLong)
    stopLossLong := entryPriceLong + breakEvenProfit

if (shortEntryAllowed and close <= breakEvenTriggerShort)
    stopLossShort := entryPriceShort - breakEvenProfit

// Close all trades at 1600
if (hour == 15 and minute == 59)
    strategy.close_all(comment='Close at 1600')

// Define the daily loss variable and last trade day
var float[] dailyLossArray = array.new_float(1, 0.0)
var int[] lastTradeDayArray = array.new_int(1, na)

// Function to update the daily loss
updateDailyLoss() =>
    _dailyLoss = array.get(dailyLossArray, 0)
    _lastTradeDay = array.get(lastTradeDayArray, 0)
    if na(_lastTradeDay) or dayofmonth != _lastTradeDay
        _dailyLoss := 0.0
        array.set(lastTradeDayArray, 0, dayofmonth)
    if not na(strategy.closedtrades.entry_bar_index(strategy.closedtrades - 1))
        _dailyLoss += strategy.closedtrades.profit(strategy.closedtrades - 1)
    array.set(dailyLossArray, 0, _dailyLoss)

// Call the function to update the daily loss
updateDailyLoss()

// Execute Strategy
if longCondition and longEntryAllowed
    strategy.entry('Long', strategy.long)
    strategy.exit('Take Profit/Stop Loss', 'Long', stop=stopLossLong, limit=takeProfitLong)
    longEntryAllowed := false

if shortCondition and shortEntryAllowed
    strategy.entry('Short', strategy.short)
    strategy.exit('Take Profit/Stop Loss', 'Short', stop=stopLossShort, limit=takeProfitShort)
    shortEntryAllowed := false

// Reset entry control variables on position close
if strategy.position_size == 0
    longEntryAllowed := true
    shortEntryAllowed := true

// // Statistics
// winRate = strategy.wintrades / strategy.closedtrades * 100
// totalTrades = strategy.closedtrades
// averageProfit = strategy.grossprofit / strategy.wintrades
// averageLoss = strategy.grossloss / strategy.losstrades

// // Plotting
// plot(shortEma, color=color.new(color.red, 0), title='Short EMA')
// plot(longEma, color=color.new(color.blue, 0), title='Long EMA')

// // Display Table
// table statsTable = table.new(position=position.top_right, columns=2, rows=4, bgcolor=color.gray, border_width=1)
// table.cell(statsTable, column=0, row=0, text='Win Rate (%)', bgcolor=color.blue)
// table.cell(statsTable, column=1, row=0, text=str.tostring(winRate), bgcolor=color.blue)
// table.cell(statsTable, column=0, row=1, text='Total Trades', bgcolor=color.blue)
// table.cell(statsTable, column=1, row=1, text=str.tostring(totalTrades), bgcolor=color.blue)
// table.cell(statsTable, column=0, row=2, text='Average Profit', bgcolor=color.blue)
// table.cell(statsTable, column=1, row=2, text=str.tostring(averageProfit), bgcolor=color.blue)
// table.cell(statsTable, column=0, row=3, text='Average Loss', bgcolor=color.blue)
// table.cell(statsTable, column=1, row=3, text=str.tostring(averageLoss), bgcolor=color.blue)