概述
该策略使用支点(PivotHigh和PivotLow)识别价格的波动高点和低点,并以此为基础绘制向上和向下的趋势线。趋势线的斜率由ATR(平均真实范围)、标准差或线性回归等方法计算得出,并乘以一个斜率因子进行调整。当价格突破趋势线时,该策略将产生买入或卖出信号。
策略原理
- 使用ta.pivothigh()和ta.pivotlow()函数检测过去一定周期内的波动高点(ph)和波动低点(pl)。
- 根据选定的计算方法(ATR、标准差或线性回归)计算趋势线的斜率,并乘以斜率因子(mult)进行调整。
- 利用斜率和支点价格,计算向上趋势线(upper)和向下趋势线(lower)的当前值。
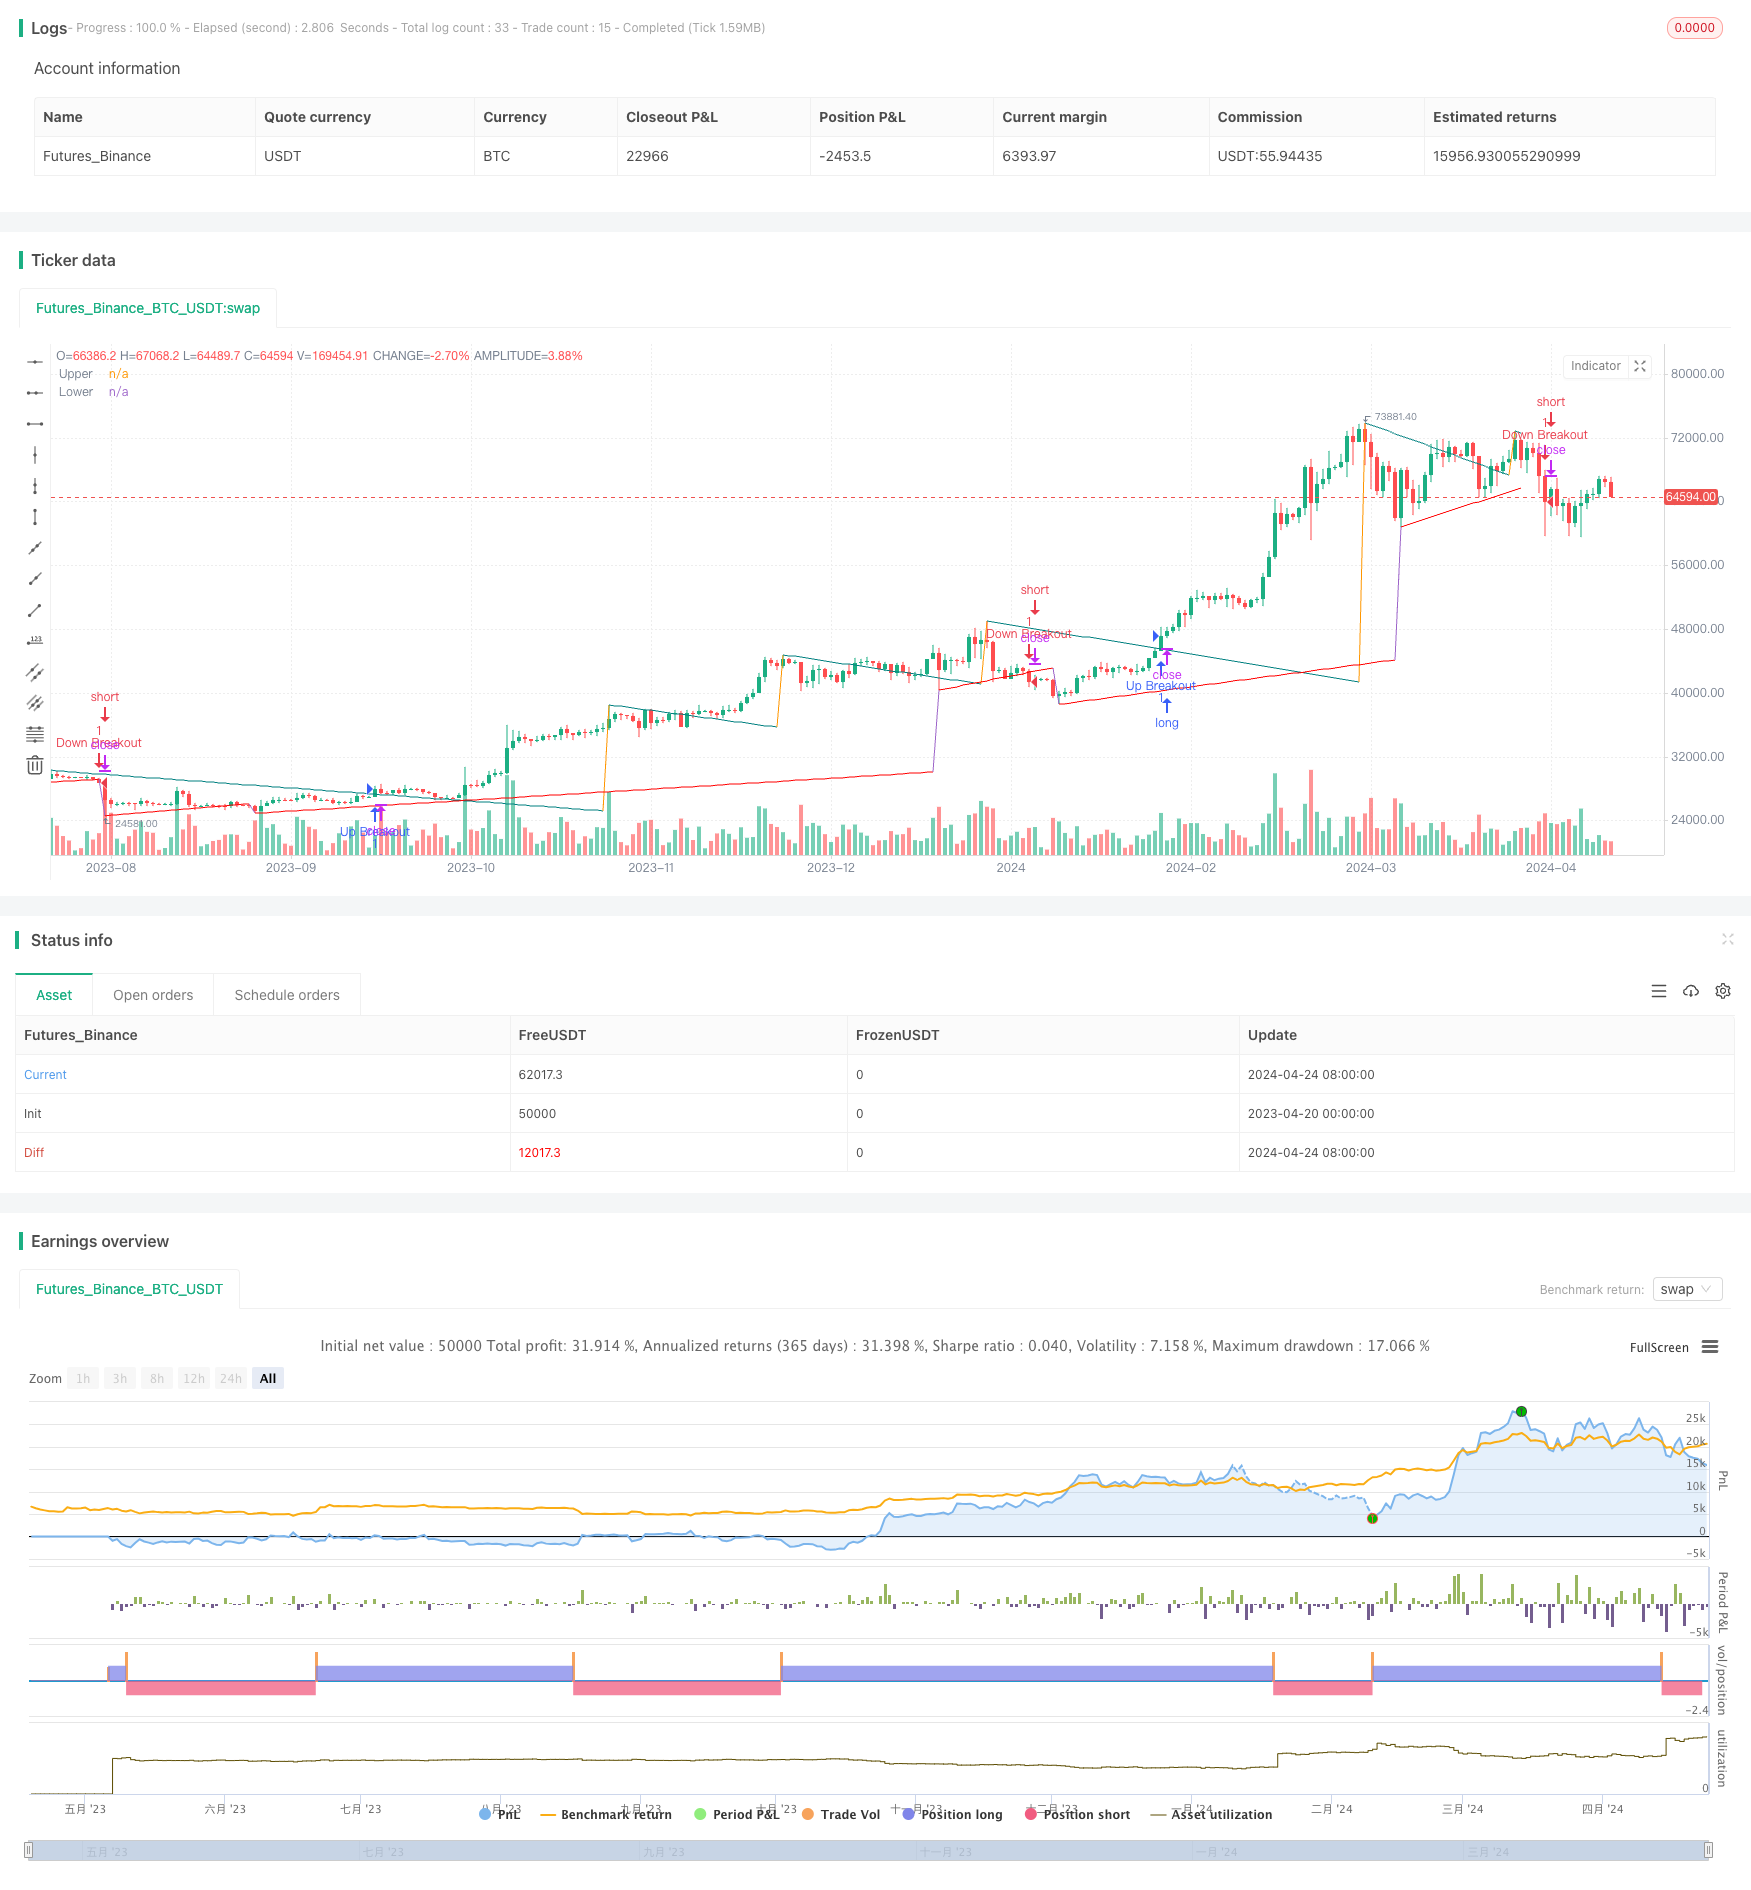
- 判断当前收盘价是否突破了趋势线:如果收盘价高于向上趋势线,则产生向上突破信号;如果收盘价低于向下趋势线,则产生向下突破信号。
- 在图表上绘制趋势线,并可选择是否延长趋势线。
- 根据突破信号进行交易:向上突破开多单,向下突破开空单。
策略优势
- 该策略基于价格行为的客观事实(支点和趋势线)产生交易信号,具有一定的可靠性和稳定性。
- 趋势线的斜率可以根据市场波动性进行动态调整,适应不同的市场环境。
- 用户可以灵活选择斜率计算方法和参数设置,以优化策略表现。
- 策略提供了实时信号和延迟信号两种模式,可以满足不同用户的需求。
- 内置的警报功能可以帮助用户及时获取交易机会。
策略风险
- 在震荡市场或趋势不明朗时,该策略可能产生频繁的虚假信号,导致盈利能力下降。
- 策略的表现依赖于参数设置,不恰当的参数可能导致策略失效或产生过多的交易。
- 延迟信号模式下,由于存在回测,实际交易结果可能与历史测试结果存在差异。
策略优化方向
- 引入更多的技术指标或价格行为特征,如交易量、波动率等,以辅助趋势线突破信号的确认,提高信号质量。
- 对交易信号进行过滤,如考虑趋势线突破的持续时间、突破幅度等因素,以减少虚假信号。
- 优化仓位管理和风险控制,如根据市场趋势强度或波动率动态调整仓位大小,设置合理的止损和止盈位置。
- 对参数进行优化,如使用机器学习或优化算法,寻找最佳的参数组合。
总结
该策略利用支点和趋势线斜率,构建了一个实时的趋势线交易系统。通过捕捉趋势线突破事件,策略可以在趋势形成的早期阶段进行交易。尽管该策略具有一定的优势,但仍需注意其在震荡市场中的风险,并通过引入更多信息、优化信号过滤和仓位管理等方式,进一步提升策略的稳健性和盈利能力。
策略源码
/*backtest
start: 2023-04-20 00:00:00
end: 2024-04-25 00:00:00
period: 1d
basePeriod: 1h
exchanges: [{"eid":"Futures_Binance","currency":"BTC_USDT"}]
*/

//@version=5
strategy(" only Ajay ", overlay=true)

//------------------------------------------------------------------------------
//Settings
//------------------------------------------------------------------------------{
length = input.int(14, 'Swing Detection Lookback')
mult = input.float(1., 'Slope', minval = 0, step = .1)
calcMethod = input.string('Atr', 'Slope Calculation Method', options = ['Atr','Stdev','Linreg'])
backpaint = input(true, tooltip = 'Backpainting offset displayed elements in the past. Disable backpainting to see real time information returned by the indicator.')

//Style
upCss = input.color(color.teal, 'Up Trendline Color', group = 'Style')
dnCss = input.color(color.red, 'Down Trendline Color', group = 'Style')
showExt = input(true, 'Show Extended Lines')

//------------------------------------------------------------------------------}
//Calculations
//------------------------------------------------------------------------------{
var upper = 0.
var lower = 0.
var slope_ph = 0.
var slope_pl = 0.

var offset = backpaint ? length : 0

n = bar_index
src = close

ph = ta.pivothigh(length, length)
pl = ta.pivotlow(length, length)

//Slope Calculation Method
slope = switch calcMethod
    'Atr'    => ta.atr(length) / length * mult
    'Stdev'  => ta.stdev(src,length) / length * mult
    'Linreg' => math.abs(ta.sma(src * n, length) - ta.sma(src, length) * ta.sma(n, length)) / ta.variance(n, length) / 2 * mult

//Get slopes and calculate trendlines
slope_ph := ph ? slope : slope_ph
slope_pl := pl ? slope : slope_pl

upper := ph ? ph : upper - slope_ph
lower := pl ? pl : lower + slope_pl

var upos = 0
var dnos = 0
upos := ph ? 0 : close > upper - slope_ph * length ? 1 : upos
dnos := pl ? 0 : close < lower + slope_pl * length ? 1 : dnos

//------------------------------------------------------------------------------}
//Extended Lines
//------------------------------------------------------------------------------{
// var uptl  = line.new(na,na,na,na, color = upCss, style = line.style_dashed, extend = extend.right)
// var dntl  = line.new(na,na,na,na, color = dnCss, style = line.style_dashed, extend = extend.right)

// if ph and showExt
//     uptl.set_xy1(n-offset, backpaint ? ph : upper - slope_ph * length)
//     uptl.set_xy2(n-offset+1, backpaint ? ph - slope : upper - slope_ph * (length+1))

// if pl and showExt
//     dntl.set_xy1(n-offset, backpaint ? pl : lower + slope_pl * length)
//     dntl.set_xy2(n-offset+1, backpaint ? pl + slope : lower + slope_pl * (length+1))

//------------------------------------------------------------------------------}
//Plots
//------------------------------------------------------------------------------{
plot(backpaint ? upper : upper - slope_ph * length, 'Upper', color = ph ? na : upCss, offset = -offset)
plot(backpaint ? lower : lower + slope_pl * length, 'Lower', color = pl ? na : dnCss, offset = -offset)

//Breakouts
upBreakout = upos > upos[1]
dnBreakout = dnos > dnos[1]

if (upBreakout)
    strategy.entry("Up Breakout", strategy.long)

if (dnBreakout)
    strategy.entry("Down Breakout", strategy.short)

//------------------------------------------------------------------------------}
//Alerts
//------------------------------------------------------------------------------{
alertcondition(upos > upos[1], 'Upward Breakout', 'Price broke the down-trendline upward')
alertcondition(dnos > dnos[1], 'Downward Breakout', 'Price broke the up-trendline downward')

//------------------------------------------------------------------------------}
相关推荐