概述
该策略基于艾略特波浪理论,尝试自动检测脉冲波。它通过寻找连续4根收盘价上涨且当前收盘价高于9天前收盘价的K线组合来定义上升脉冲波;用相反的逻辑来定义下降脉冲波。检测到脉冲波后会产生买卖信号并反转仓位,止损位设在信号K线的低点或高点。由于脉冲波通常伴随快速移动,这种止损方式应该会带来正面结果。另外在强趋势开始前,绿色或红色三角形的聚集通常表明趋势启动前平静市场中的良好入场点。
策略原理
- 定义连续收盘价上涨/下跌的周期数consclos(默认为3)和当前收盘价与N天前收盘价比较的天数daysago(默认为9)。
- 用long_cc和short_cc两个变量分别记录最近consclos根K线是否连续收阳/收阴,若连续则值为1,否则为0。
- 比较当前收盘价与daysago天前的收盘价,若当前价格更高/低则long_daysago/short_daysago为真。
- 组合long_cc、short_cc与long_daysago、short_daysago,得到最终的多空信号long和short。
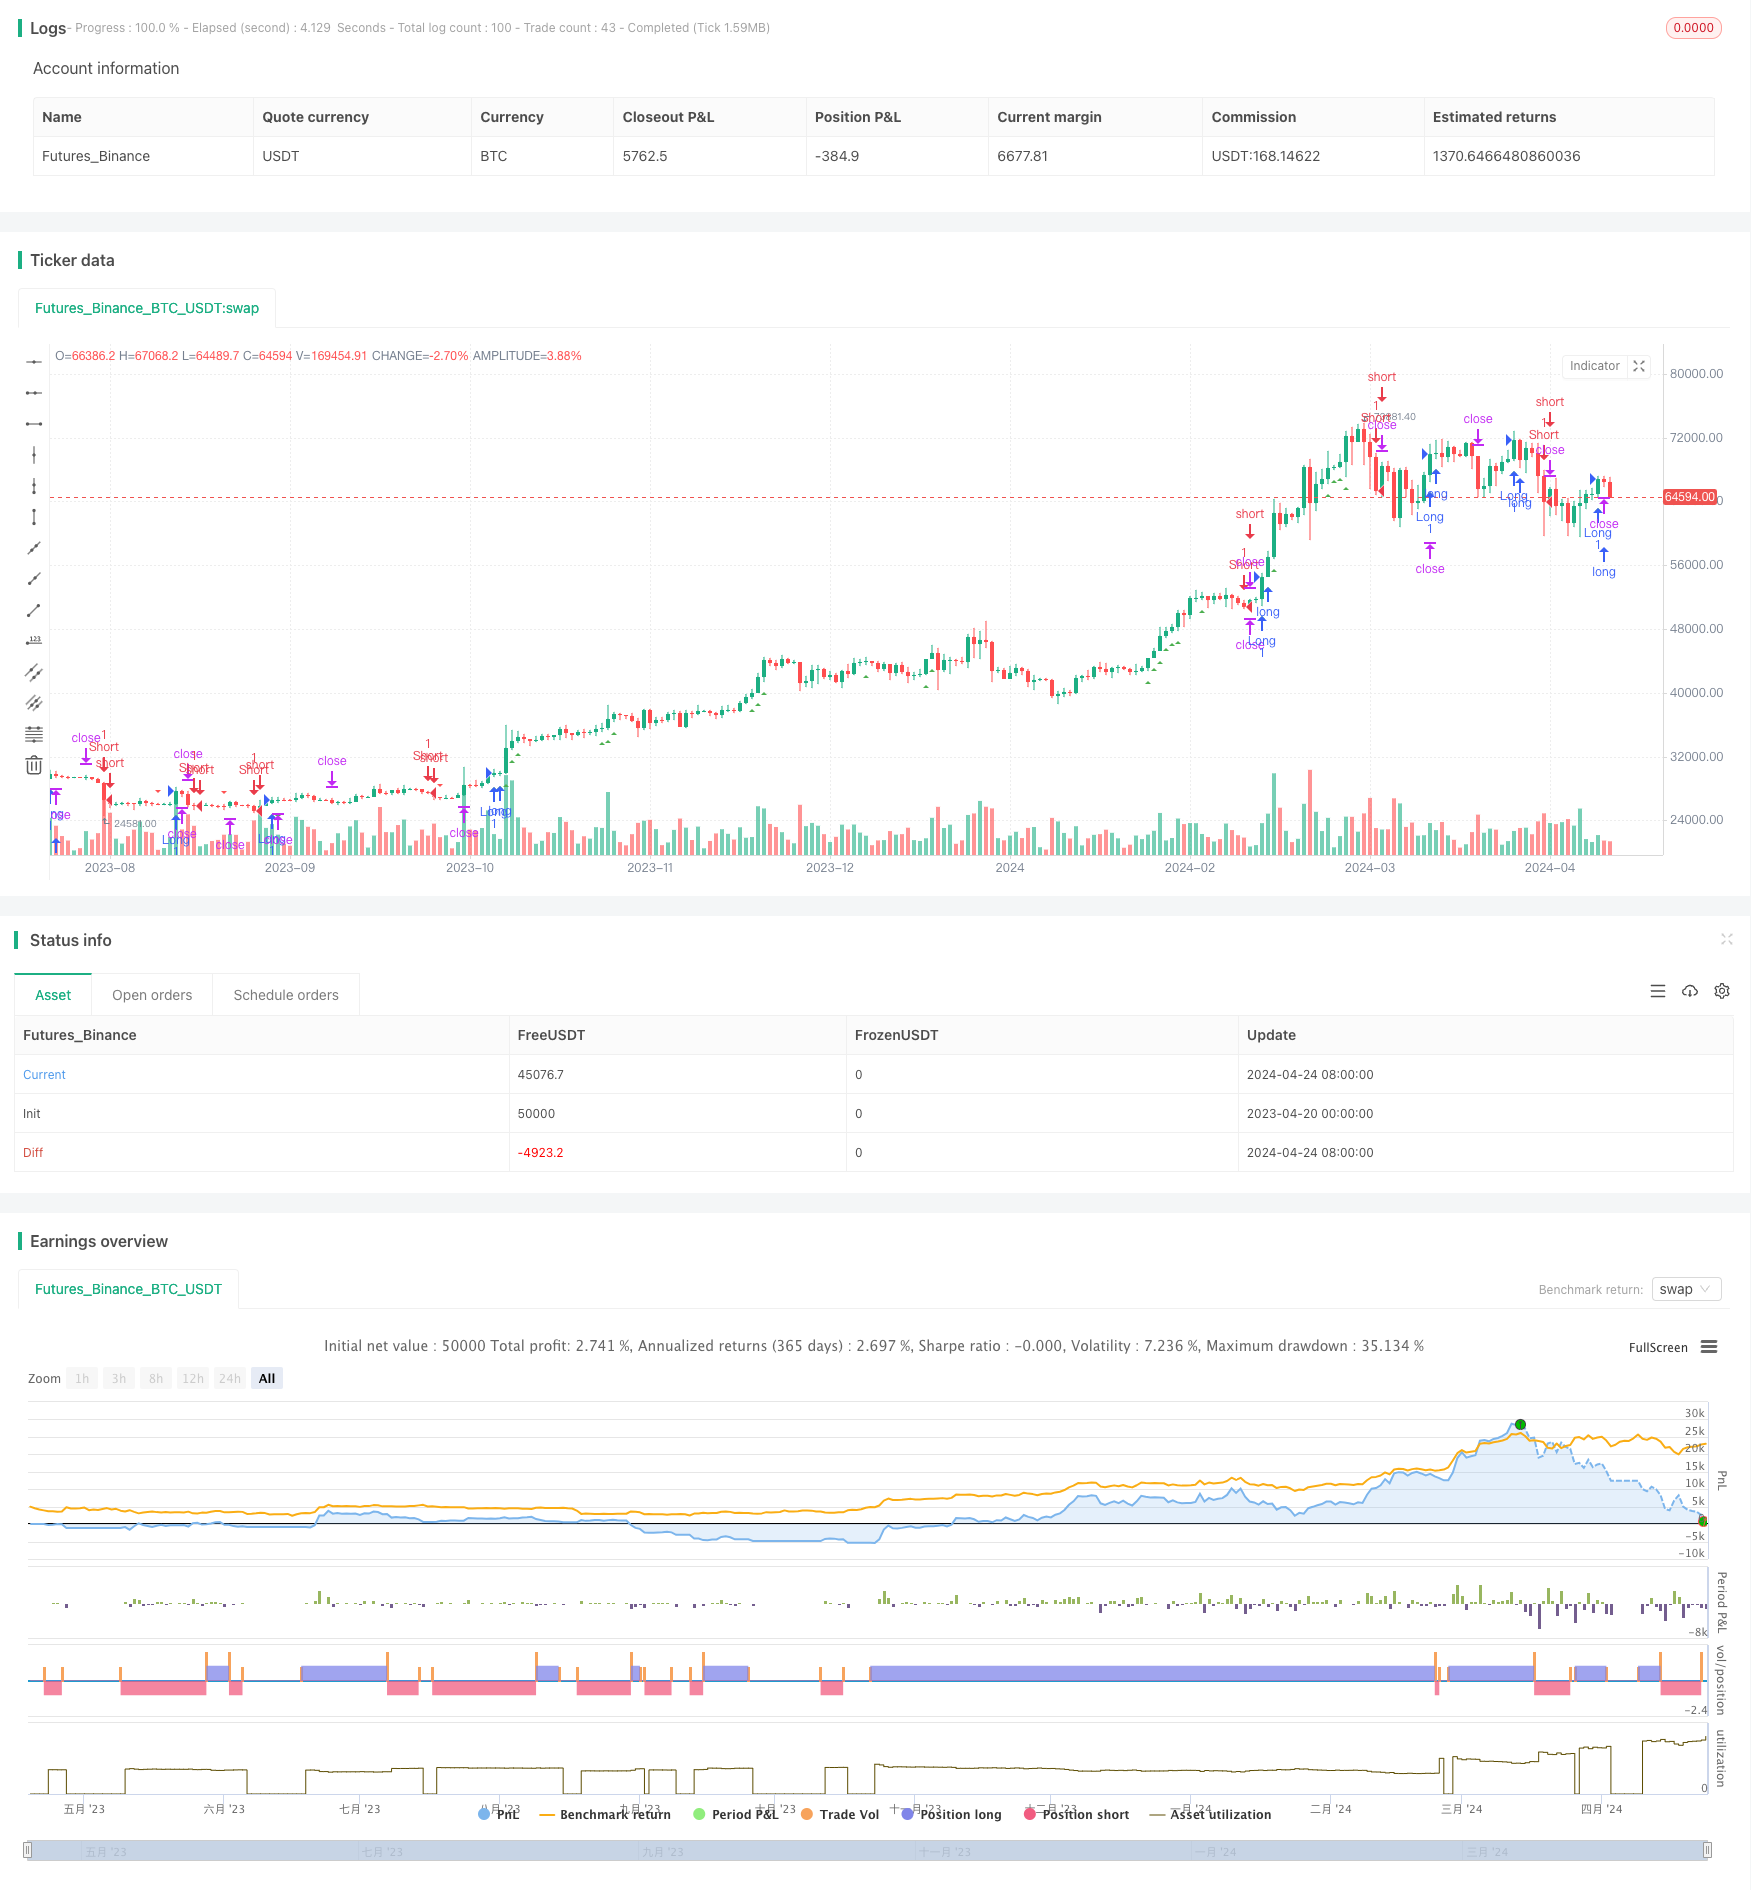
- 画出long和short信号对应的绿色和红色三角形。
- 若long信号出现且当前无多头仓位,则开多并设置止损价为信号K线低点。
- 若short信号出现且当前无空头仓位,则开空并设置止损价为信号K线高点。
优势分析
- 能够自动识别艾略特波浪理论中的脉冲浪,减少主观分析的影响。
- 脉冲浪往往伴随着强劲的趋势,这个策略能抓住这样的行情。
- 止损位的设置与趋势走向一致,提高了盈亏比。
- 能发现趋势启动前的潜在入场机会。
- 参数可调,适用性强。
风险分析
- 对于波浪理论的解读可能存在偏差,导致误判。
- 趋势的持续时间难以预计,有可能止损位设得过于靠近导致止损。
- 对震荡市可能失效,产生频繁交易。
- 缺乏头寸管理和资金管理方面的考虑。
优化方向
- 可以通过回测优化consclos和daysago参数的配置,提高信号准确性。
- 可以引入趋势确认指标如MACD等,减少噪音。
- 考虑加入移动止损以更好地保护利润。
- 在趋势尚不明朗时可以先少量建仓,趋势明朗后再加仓。
- 对仓位和风险进行控制,如限制单次交易的资金比例、设置最大回撤等。
总结
该策略基于经典的艾略特波浪理论,能够捕捉强劲的趋势行情,具有一定的适用性和盈利潜力。但是波浪理论本身的主观性以及脉冲浪的定义等,都可能影响策略表现。在实际应用中,需要注意参数优化、仓位管理、降低交易频率等问题。通过引入趋势确认指标、移动止损、逐步建仓等手段,可以进一步完善该策略的性能和稳定性。
策略源码
/*backtest
start: 2023-04-20 00:00:00
end: 2024-04-25 00:00:00
period: 1d
basePeriod: 1h
exchanges: [{"eid":"Futures_Binance","currency":"BTC_USDT"}]
*/

// This Pine Script™ code is subject to the terms of the Mozilla Public License 2.0 at https://mozilla.org/MPL/2.0/
// © Smollet

//@version=5
strategy("LW: 4-9 indicator", overlay = true)

consclos = input.int(3, "Consecutive close")
daysago = input.int(9, "Days ago")


var int long_cc = 0
var int short_cc = 0

long_cc := 1
short_cc := 1

for i = 1 to consclos
    long_cc := close[i-1] > close[i] ? long_cc*1 : long_cc*0
    short_cc := close[i-1] < close[i] ? short_cc*1 : short_cc*0

long_daysago = close > close[daysago]
short_daysago = close < close[daysago]


long = long_cc ==1 and long_daysago
short = short_cc ==1 and short_daysago


plotshape(long, style=shape.triangleup, location=location.belowbar, color=color.green)
plotshape(short, style=shape.triangledown, location=location.abovebar, color=color.red)


//Strategy code
if long and strategy.position_size <= 0
    strategy.entry("Long", strategy.long)
    strategy.exit("Long SL", "Long", stop = low)

if short and strategy.position_size >= 0
    strategy.entry("Short", strategy.short)
    strategy.exit("Short SL", "Short", stop = high)
相关推荐