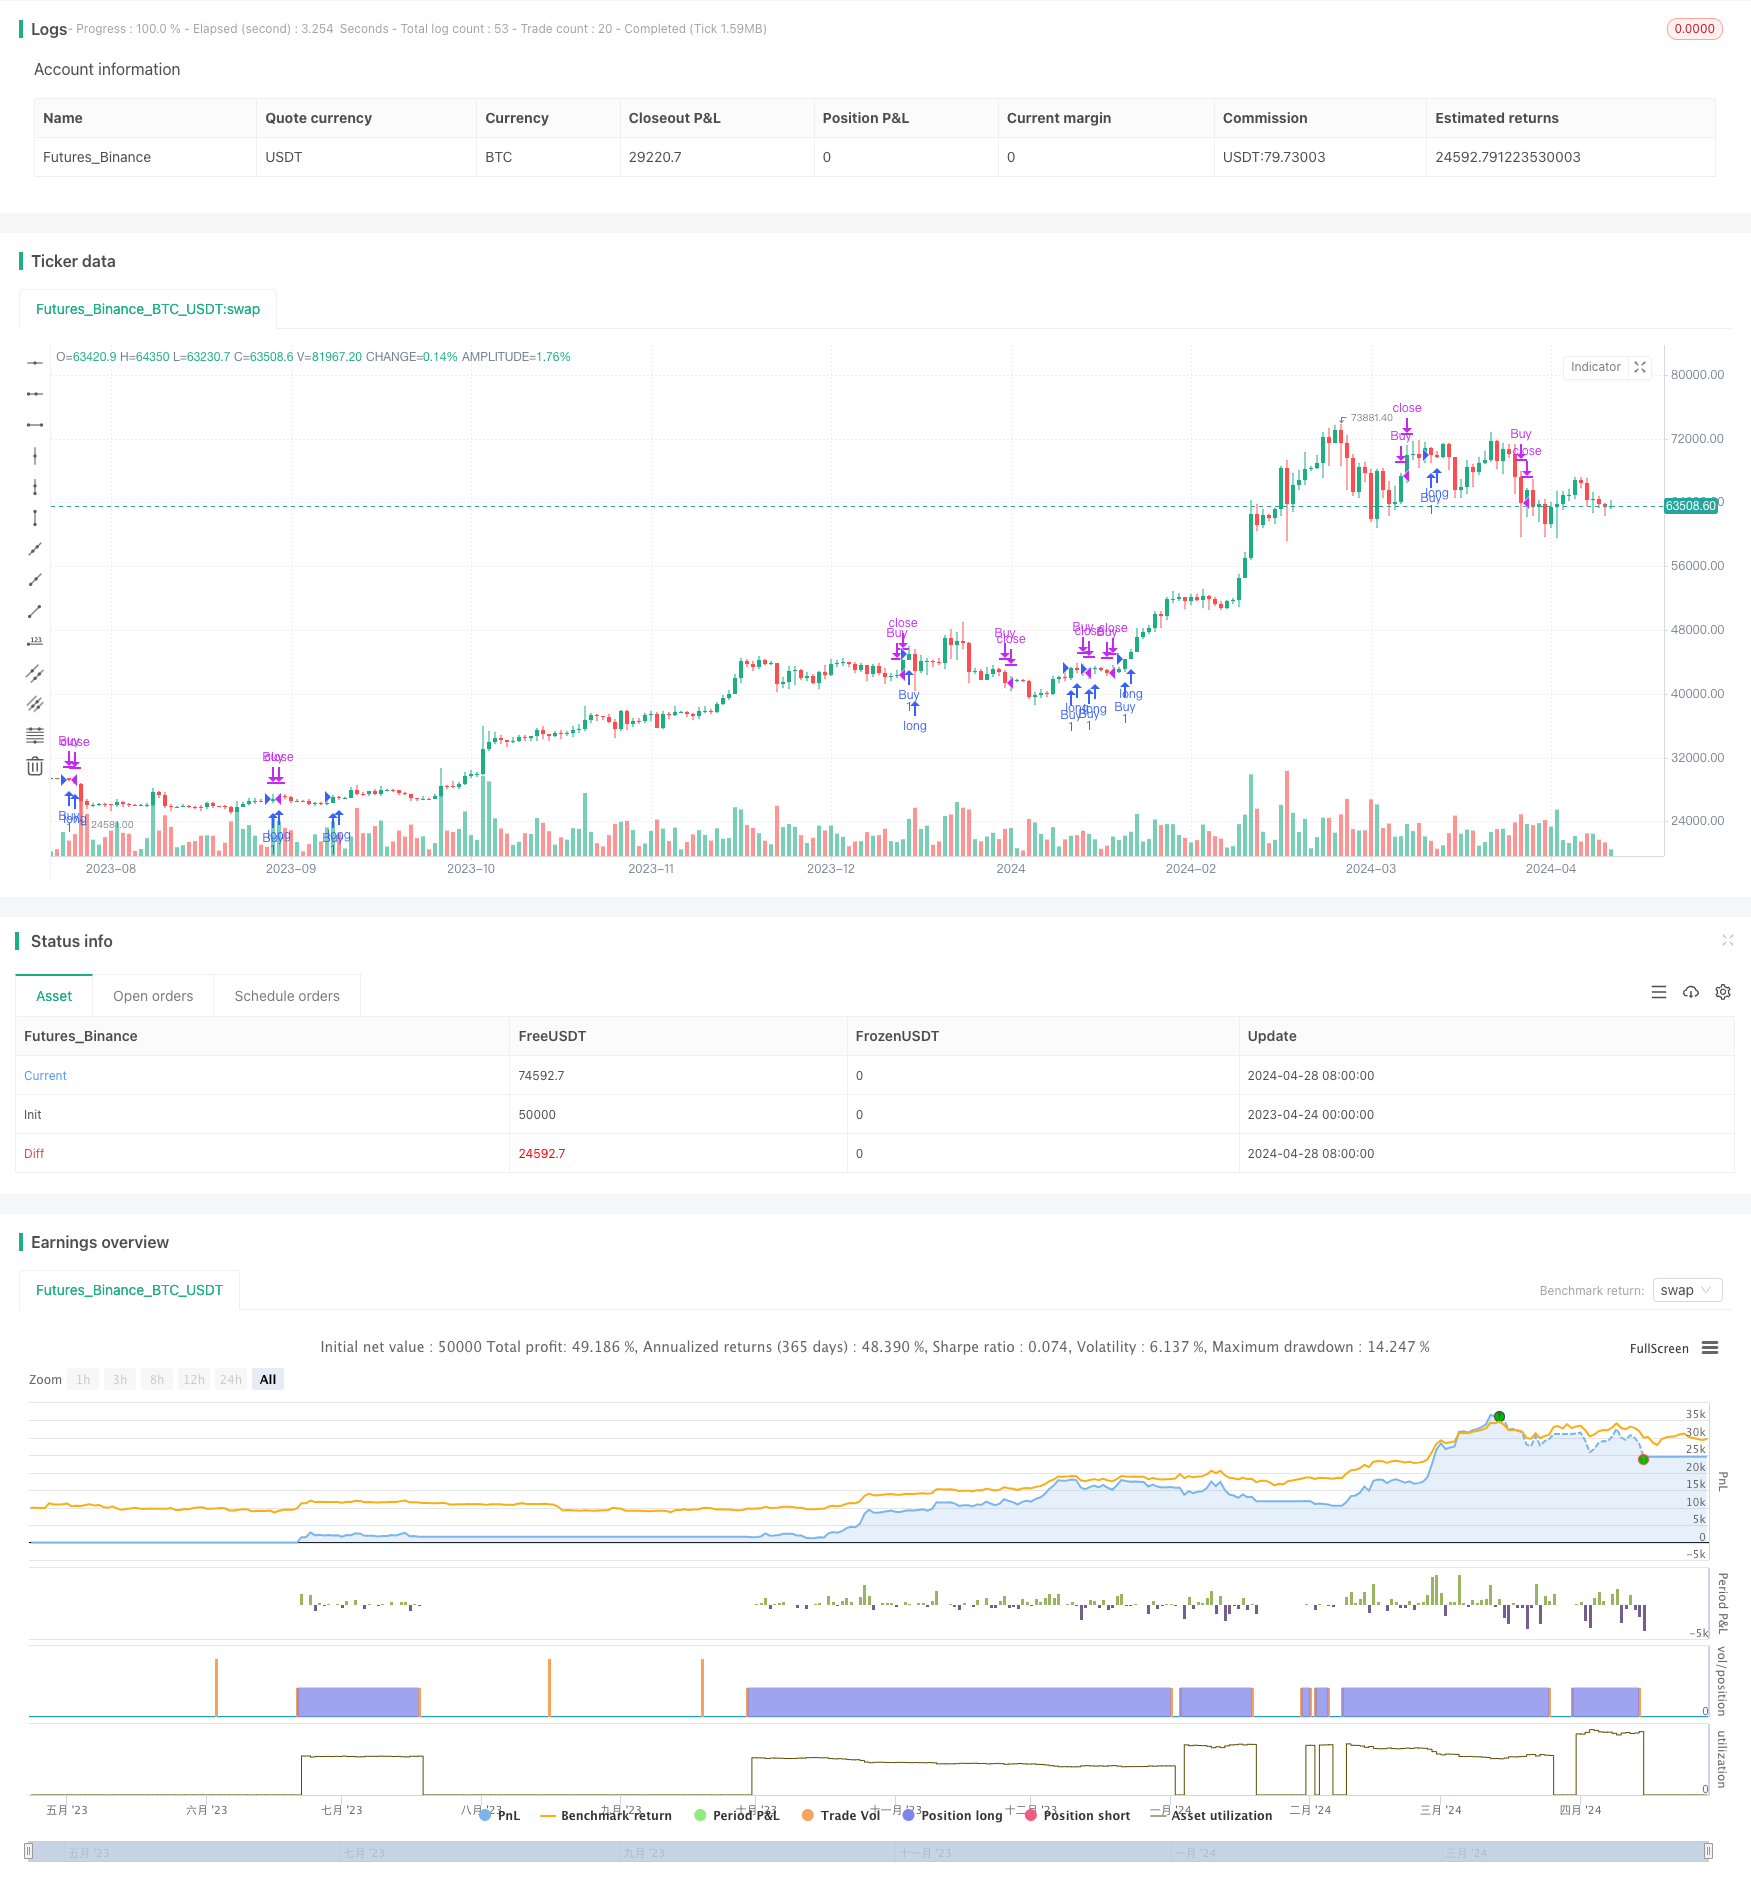
概述
“MACD RSI 一目均衡Ichimoku动量趋势多头策略”是一个综合运用MACD、RSI和一目均衡指标的量化交易策略。该策略通过分析MACD、RSI和一目均衡云图的信号,捕捉市场的趋势和动量,实现追踪趋势、把握买卖时机的目的。策略允许灵活设置指标参数和交易周期,适用于不同的交易风格和市场。
策略原理
该策略的核心是综合利用MACD、RSI和一目均衡指标: 1. MACD由快速移动平均线和慢速移动平均线的差值构成,用于判断趋势方向和动量变化。当MACD快线上穿慢线时,产生买入信号;快线下穿慢线时,产生卖出信号。 2. RSI衡量一段时期内价格涨跌幅度,指示超买超卖状态。当RSI低于30,市场可能处于超卖;高于70,市场可能超买。 3. 一目均衡云图由转折线、基准线、先行上线和先行下线构成,提供支撑位、阻力位和趋势强度等多方面信息。 该策略在MACD表现多头、价格在云图上方且RSI不超买时开多;当MACD死叉或价格跌破云图时平仓。
策略优势
- 多指标验证,提高趋势判断的准确性。MACD把握趋势方向,RSI辅助时机选择,一目均衡提供更全面的市场概览,增强策略可靠性。
- 参数灵活,适应性强。允许调整MACD、RSI和一目均衡的参数设置,满足不同交易风格和市场特征。
- 风险管理。设置止损和止盈,控制回撤;分批建仓,降低买入风险。
- 适用范围广。可用于多个市场和品种,把握各类趋势机会。
策略风险
- 指标信号冲突。MACD、RSI和一目均衡偶尔可能产生相左的信号,导致判断失误。
- 参数设置不当。不恰当的参数会使策略失效,需要根据市场特点和回测进行优化。
- 震荡市中表现欠佳。趋势策略在震荡市中往往频繁交易,较高的成本可能侵蚀利润。
- 突发事件风险。某些事件会引发价格异常波动,违背指标信号。
策略优化方向
- 增强趋势确认条件,如价格在云图中持续上涨、MACD背离等,提高开仓质量。
- 引入止损止盈和仓位管理,控制回撤,提高收益风险比。
- 对参数进行优化,适应不同品种和周期特性,提高稳健性。
- 可以考虑加入移动止损,跟踪盈利,放大优势。
总结
“MACD RSI 一目均衡Ichimoku动量趋势多头策略”是一个功能强大的量化交易策略,综合运用MACD、RSI和一目均衡指标对趋势和动量进行全面考量,在带有方向性的市场中表现出良好的捕捉趋势和把控节奏的能力。通过参数优化和风险控制措施,该策略可以成为把握市场机遇、博取稳健收益的有力工具。
策略源码
/*backtest
start: 2023-04-24 00:00:00
end: 2024-04-29 00:00:00
period: 1d
basePeriod: 1h
exchanges: [{"eid":"Futures_Binance","currency":"BTC_USDT"}]
*/

// @ Julien_Eche

//@version=5
strategy("MACD RSI Ichimoku Strategy", overlay=true)

string t1 = ("If checked, this strategy is suitable for those who buy and sell. If unchecked, it is suitable for those who only want to take long positions—buying and closing buys.")

start_date = input(timestamp("1975-01-01T00:00:00"), title="Start Date")
end_date = input(timestamp("2099-01-01T00:00:00"), title="End Date")

// Input settings for Ichimoku Cloud lengths
length1 = input.int(9, title="Tenkan-sen Length", minval=1)
length2 = input.int(26, title="Kijun-sen Length", minval=1)
length3 = input.int(52, title="Senkou Span Length", minval=1)

// Calculate Ichimoku Cloud components based on input lengths
tenkanSen = ta.sma(high + low, length1) / 2
kijunSen = ta.sma(high + low, length2) / 2
senkouSpanA = ((tenkanSen + kijunSen) / 2)[length2]
senkouSpanB = ta.sma(high + low, length3) / 2

// Input settings for MACD parameters
macdFastLength = input(12, title="MACD Fast Length")
macdSlowLength = input(26, title="MACD Slow Length")
macdSignalLength = input(9, title="MACD Signal Length")

// Calculate MACD
[macdLine, signalLine, _] = ta.macd(close, macdFastLength, macdSlowLength, macdSignalLength)

// Input settings for RSI length
rsiLength = input(14, title="RSI Length")

// Calculate RSI
rsiValue = ta.rsi(close, rsiLength)

// Determine Buy/Sell behavior based on input
buySell = input(false, title="Buy/Sell", tooltip=t1)

// More sensitive entry conditions (Buy Only)
canEnter = ta.crossover(tenkanSen, kijunSen) or (close > senkouSpanA and close > senkouSpanB and macdLine > signalLine and rsiValue < 70)

// Enter long position (Buy) with time condition
if (canEnter)
    strategy.entry("Buy", strategy.long)

// More sensitive exit conditions (Close Buy) with time condition
canExit = ta.crossunder(tenkanSen, kijunSen) or (close < senkouSpanA and close < senkouSpanB)

// Determine exit behavior based on user input
if buySell
    // Sell to close long position (Short) with time condition
    if (canExit )
        strategy.entry("Sell", strategy.short)
else
    // Sell to exit long position (Buy/Sell) with time condition
    if (canExit )
        strategy.close("Buy", comment="Sell for exit")
相关推荐