概述
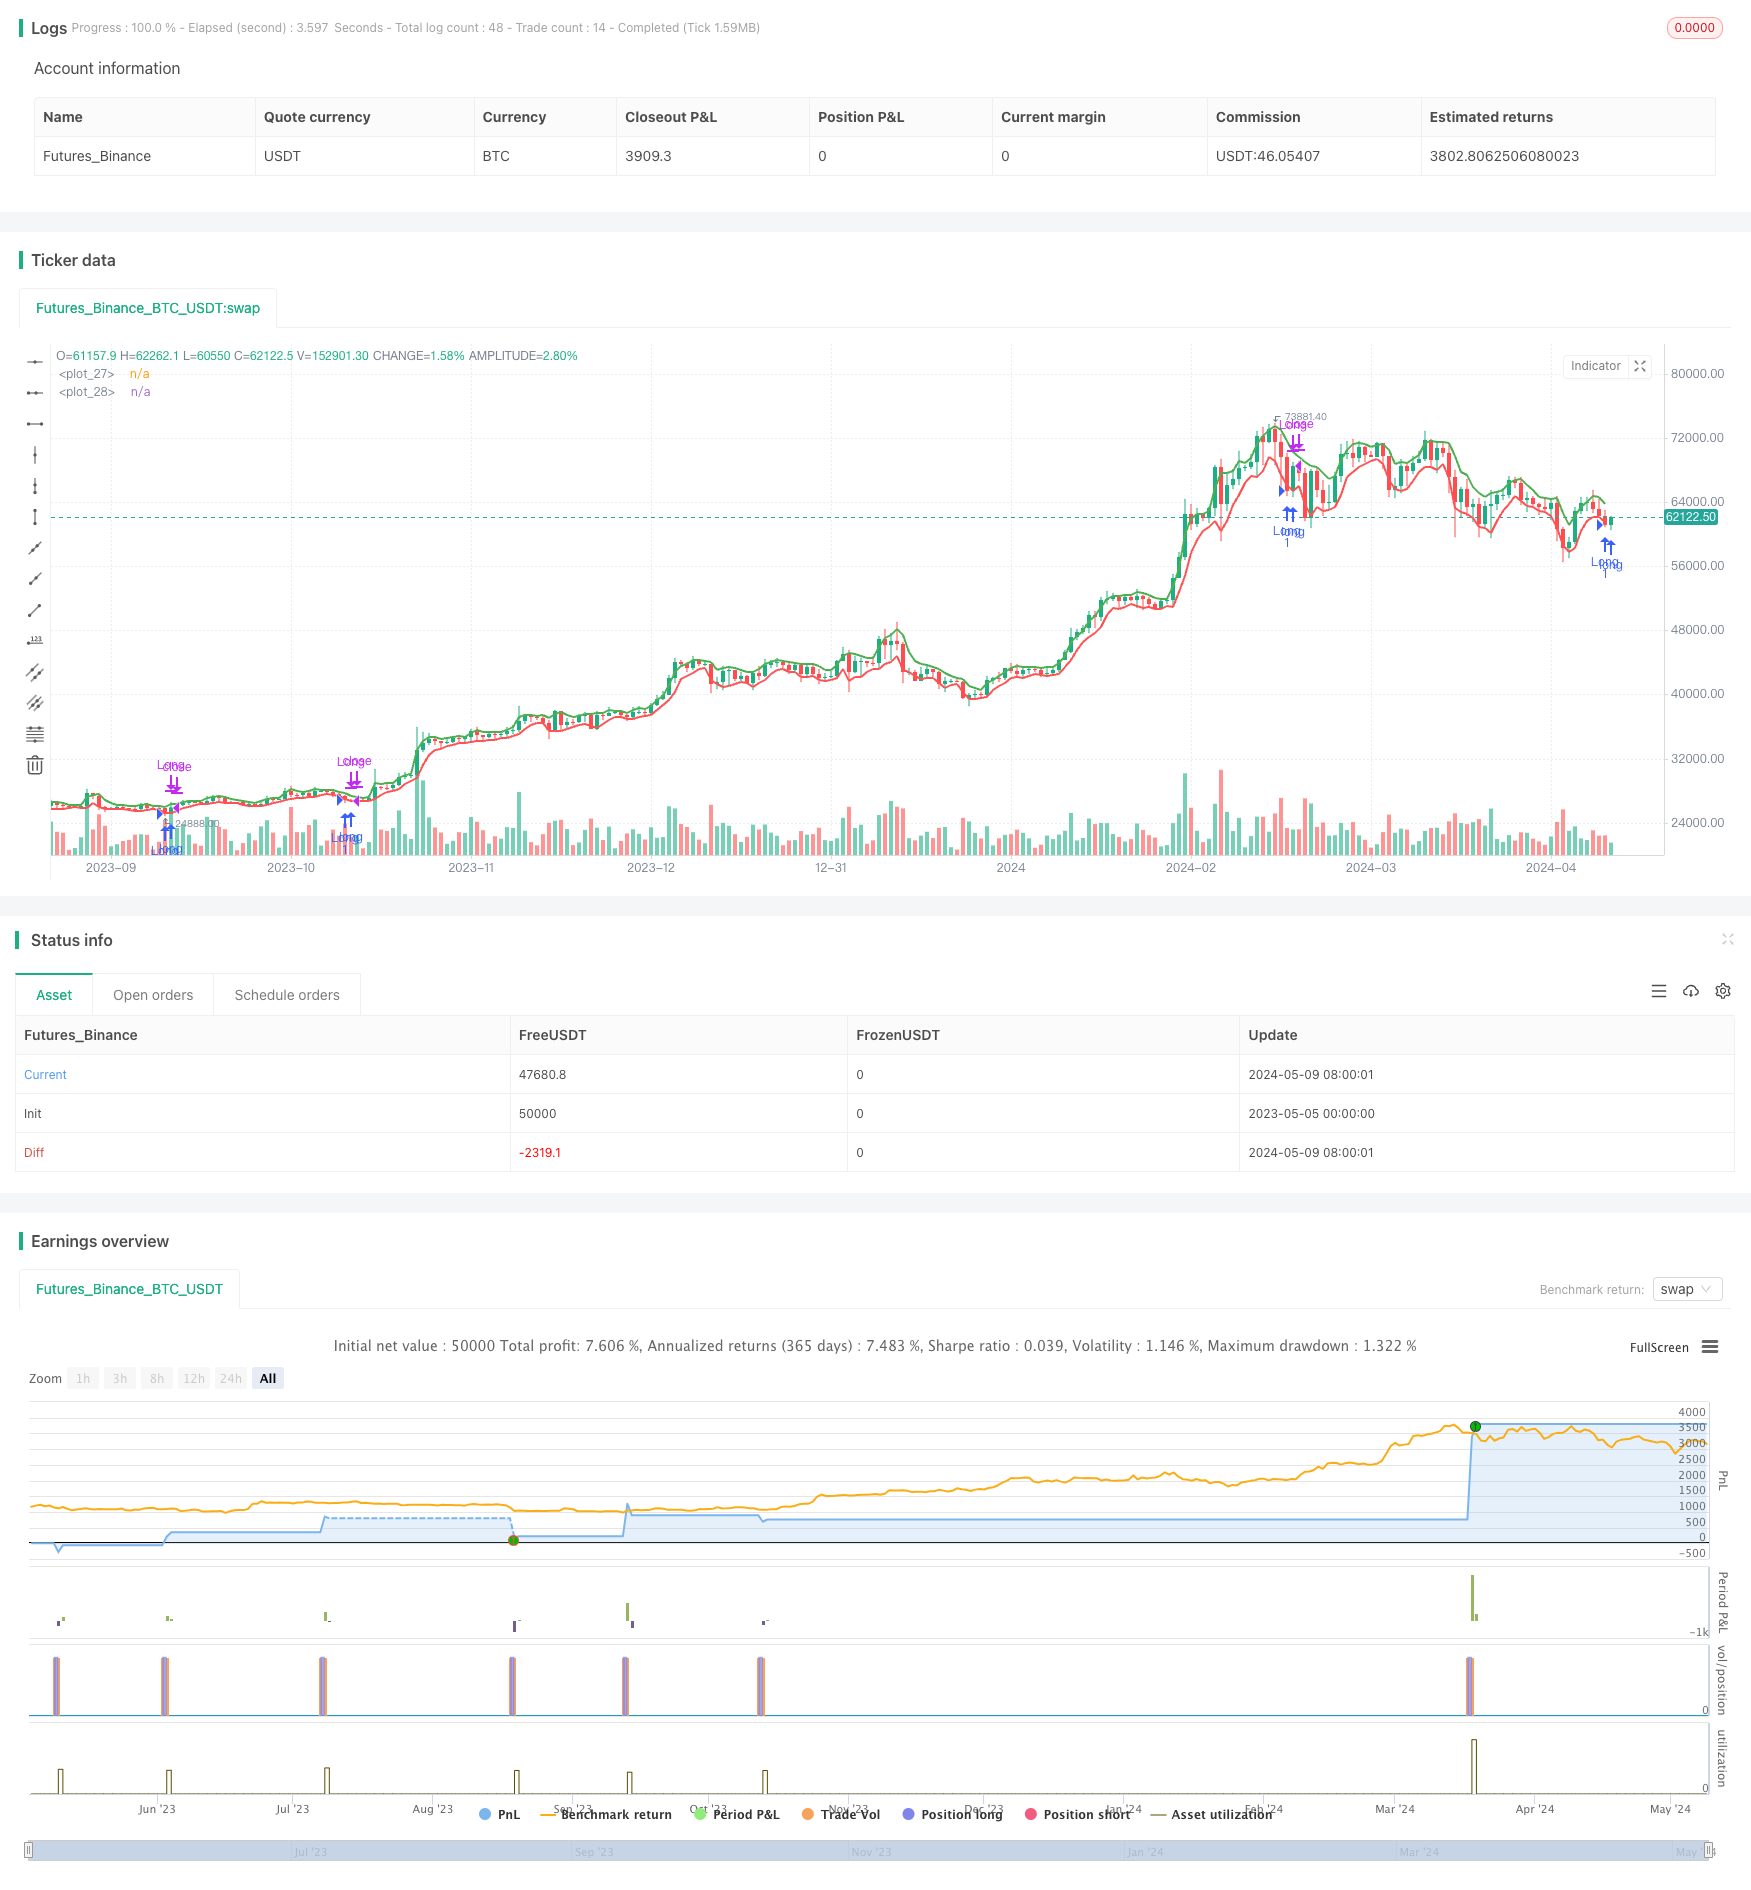
本文介绍了一种基于拉里·威廉姆斯三周期动态均线的交易策略。该策略利用两条指数移动平均线(EMA)来捕捉价格趋势,当连续三根K线收盘价突破EMA时产生交易信号。策略参数可调,适用于不同市场和周期。
策略原理
- 计算两条EMA:收盘价的高价EMA和低价EMA,周期可调。
- 判断当前时间是否在设定的交易区间内。
- 判断最近三根K线是否连续收在EMA上方(看涨)或下方(看跌)。
- 若3成立且仓位为0,则开多仓;若3的相反情况成立且持有多仓,则平仓。
- 每日收盘时若持仓则平仓。
策略优势
- 参数灵活:EMA周期、交易时间区间等参数可调,适应不同市场。
- 趋势跟踪:利用EMA和连续K线的方向判断趋势,有利于捕捉趋势行情。
- 及时止损:逆势突破EMA时即时平仓,控制回撤。
- 日内平仓:收盘时平仓,避免隔夜风险。
策略风险
- 震荡市风险:趋势不明朗时,频繁交易可能导致亏损。
- 参数风险:不同参数在不同市场表现差异大,需要针对性优化。
- 跳空缺口风险:开盘跳空可能导致策略开仓价差,风险加大。
策略优化方向
- 趋势过滤:加入ATR、RSI等指标辅助判断趋势强度,避开震荡市。
- 动态参数优化:根据近期市场特征动态调整参数,提高适应性。
- 仓位管理:根据趋势强弱和资金情况调整仓位,控制风险。
- 加入止损止盈:设置合理止损位和止盈目标,降低单次交易风险。
总结
拉里·威廉姆斯三周期动态均线交易策略是一个基于双EMA和连续K线方向的趋势跟踪策略,通过参数优化可以适应不同市场。但策略本身相对简单,在震荡市表现不佳,并且缺乏风控措施,还需要进一步优化和改进。综合考虑策略的优缺点,该策略更适合在趋势明朗的市场中使用,并配合仓位管理和风险控制措施,提高整体表现和稳定性。
策略源码
/*backtest
start: 2023-05-05 00:00:00
end: 2024-05-10 00:00:00
period: 1d
basePeriod: 1h
exchanges: [{"eid":"Futures_Binance","currency":"BTC_USDT"}]
*/

//@version=5
strategy("Larry Williams 3 Periodos Editável de MarcosJr", overlay=true, process_orders_on_close=true)

// Parametrização do período do EMA
emaPeriodHighs = input.int(title="Highs Period", defval=3, minval=1, maxval=9999)
emaPeriodLows = input.int(title="Lows Period", defval=3, minval=1, maxval=9999)

// Parametrização da data de início e fim do período a ser coletado
startYear = input.int(title="Start Year", defval=2020)
startMonth = input.int(title="Start Month", defval=1, minval=1, maxval=12)
startDay = input.int(title="Start Day", defval=1, minval=1, maxval=31)

endYear = input.int(title="End Year", defval=2020)
endMonth = input.int(title="End Month", defval=12, minval=1, maxval=12)
endDay = input.int(title="End Day", defval=31, minval=1, maxval=31)

// Convertendo data de início e fim para timestamp
startDate = timestamp(startYear, startMonth, startDay, 00, 00)
endDate = timestamp(endYear, endMonth, endDay, 23, 59)

// EMA
emaH = ta.ema(high, emaPeriodHighs)
emaL = ta.ema(low, emaPeriodLows)

// PLOT:
// Desenha as linhas EMA no gráfico
plot(emaH, color=color.green, linewidth=2)
plot(emaL, color=color.red, linewidth=2)

// Condições
inDateRange = true

// Verifica se houve mais de três candles consecutivos do mesmo sentido
checkThreeConsecutiveCandles = (close[0] > close[1] and close[1] > close[2] and close[2] > close[3]) or (close[0] < close[1] and close[1] < close[2] and close[2] < close[3])

if(close < emaL and inDateRange and checkThreeConsecutiveCandles and barstate.isconfirmed)
    strategy.entry("Long", strategy.long, comment="Long", when=strategy.position_size == 0)
if(close > emaH and inDateRange and checkThreeConsecutiveCandles and barstate.isconfirmed)
    strategy.close("Long", comment="Close Long")

// Fechar a operação no fechamento do pregão
if(strategy.position_size > 0 and na(time_close[0]))
    strategy.close("Long", comment="Close Long")
相关推荐