概述
该策略使用三条不同周期的指数移动平均线(EMA)和相对强弱指数(RSI)来判断市场趋势和交易信号。当价格突破200日EMA且RSI大于50时产生买入信号,反之当价格跌破200日EMA且RSI小于50时产生卖出信号。该策略适用于日线级别的波段交易。
策略原理
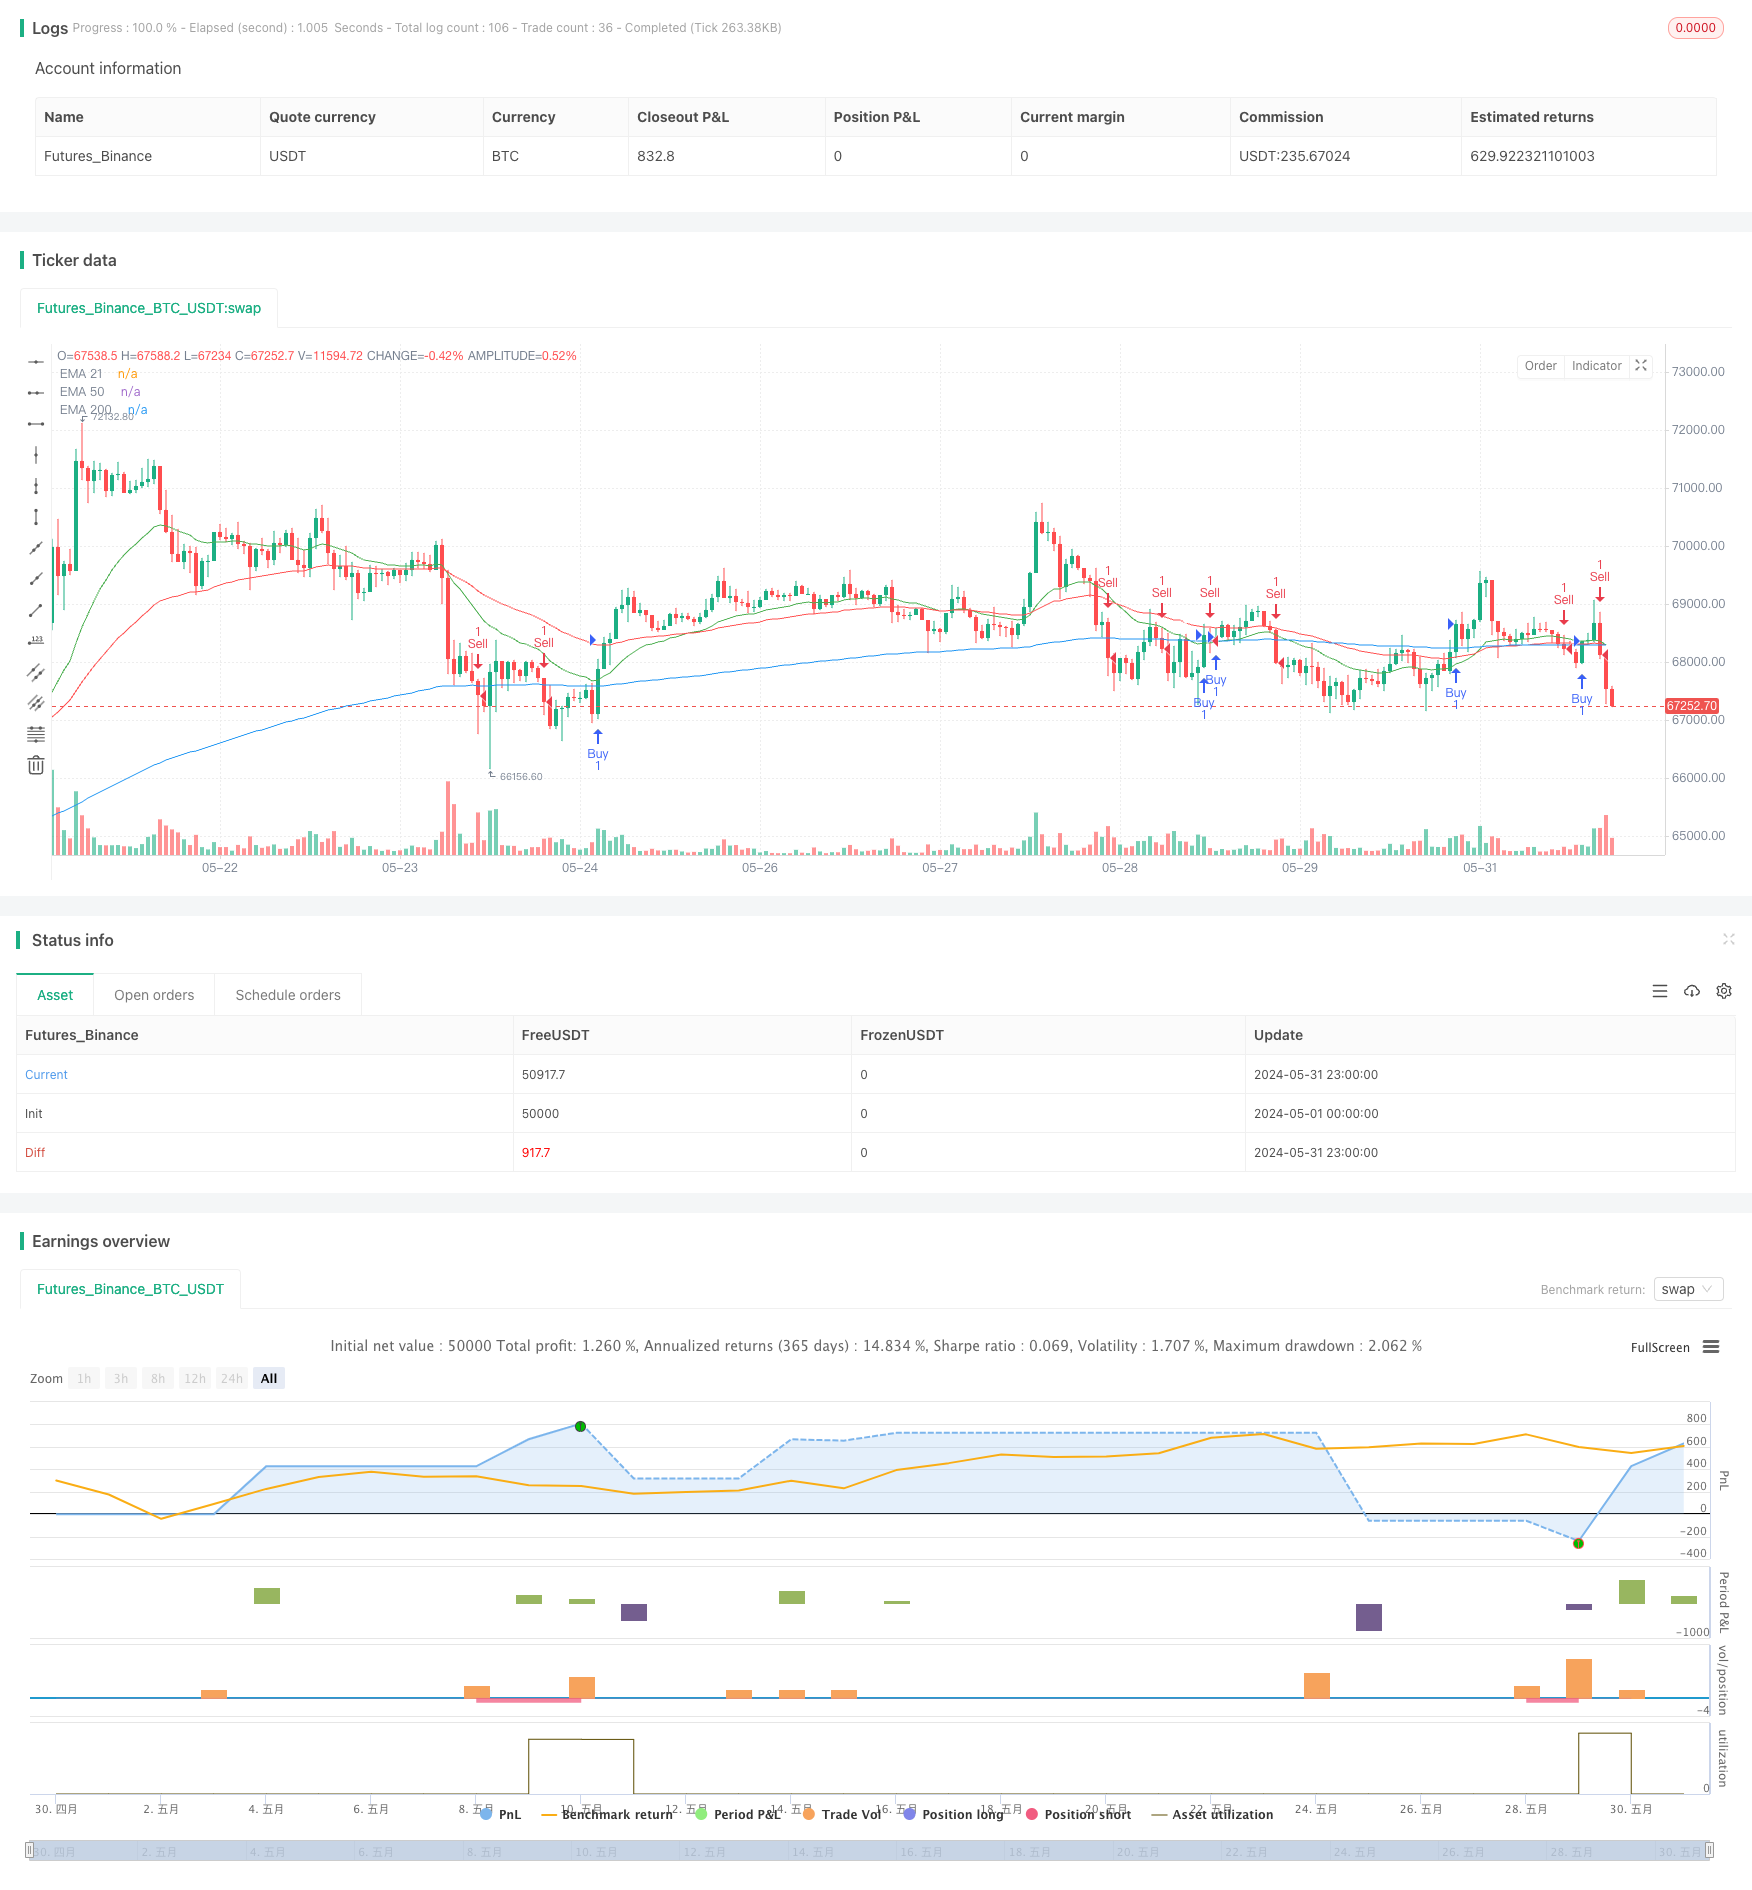
- 计算200日、50日和21日EMA,分别用蓝色、红色和绿色线表示。
- 计算14周期RSI。
- 当收盘价上穿200日EMA且RSI大于50时,产生买入信号。
- 当收盘价下穿200日EMA且RSI小于50时,产生卖出信号。
- 仓位大小为账户净值的1%。
- 买入交易的止损位置为200日EMA下方50点,止盈位置为买入价上方100点。
- 卖出交易的止损位置为200日EMA上方50点,止盈位置为卖出价下方100点。
策略优势
- 结合价格和动量指标,有助于捕捉趋势形成和反转的时机。
- 三条不同周期的EMA可以全面反映短中长期趋势,减少信号频率和假信号。
- RSI可以过滤震荡市中的交易信号,减少亏损交易。
- 固定百分比仓位,有利于控制风险。
- 设置止损止盈,防范单笔交易风险。
策略风险
- 趋势转折点的信号滞后可能导致部分利润损失。
- RSI信号在强趋势中可能过早产生反向信号。
- 固定百分比仓位在巨幅波动行情中风险较大。
- 止损位置过于靠近200日均线可能导致频繁止损。
策略优化方向
- 引入更多中长期均线组合来优化信号。
- 考虑RSI背离和超买超卖情况来调整信号。
- 根据ATR等波动率指标动态调整仓位大小。
- 优化止损止盈位置,如根据支撑阻力位、百分比或ATR等设置。
- 引入趋势过滤条件,如ADX指标,避免在震荡市交易。
- 针对不同标的和周期进行参数优化和回测验证。
总结
该策略通过EMA多头排列和RSI强势区间的交易信号,可以捕捉相对明确的中长期趋势行情。但是在趋势转折初期和震荡市中表现一般,整体适合趋势性市场。后续可以从信号、仓位、止损止盈、过滤条件等方面进一步优化,提高策略稳定性和收益风险比。
策略源码
/*backtest
start: 2024-05-01 00:00:00
end: 2024-05-31 23:59:59
period: 1h
basePeriod: 15m
exchanges: [{"eid":"Futures_Binance","currency":"BTC_USDT"}]
*/

//@version=5
strategy("Lexi Supreme", overlay=true)

// Calculate EMA 200
ema200 = ta.ema(close, 200)

// Calculate EMA 50
ema50 = ta.ema(close, 50)

// Calculate EMA 21
ema21 = ta.ema(close, 21)

// Calculate RSI
rsiValue = ta.rsi(close, 14)

// Buy condition: RSI above 50 and price crosses above EMA 200
buyCondition = ta.crossover(close, ema200) and rsiValue > 50

// Sell condition: RSI below 50 and price crosses below EMA 200
sellCondition = ta.crossunder(close, ema200) and rsiValue < 50

// Position Size (1% of account balance)
positionSize = 1

// Stop Loss and Take Profit values for buy trades
stopLossBuy = ema200 - 0.00050
takeProfitBuy = 0.00100

// Stop Loss and Take Profit values for sell trades
stopLossSell = ema200 + 0.00050
takeProfitSell = 0.00100

// Plot EMA 200 line in blue
plot(ema200, color=color.blue, title="EMA 200")

// Plot EMA 50 line in red
plot(ema50, color=color.red, title="EMA 50")

// Plot EMA 21 line in green
plot(ema21, color=color.green, title="EMA 21")

// Plot buy entry points in yellow
plotshape(series=buyCondition, title="Buy Signal", color=color.yellow, style=shape.triangleup, location=location.belowbar, size=size.small)

// Plot sell entry points in white
plotshape(series=sellCondition, title="Sell Signal", color=color.white, style=shape.triangledown, location=location.abovebar, size=size.small)

// Strategy entry and exit conditions with position size, stop loss, and take profit for buy trades
if (buyCondition)
    strategy.entry("Buy", strategy.long, qty=positionSize)
    strategy.exit("Take Profit/Stop Loss Buy", from_entry="Buy", stop=stopLossBuy, limit=close + takeProfitBuy)

// Strategy entry and exit conditions with position size, stop loss, and take profit for sell trades
if (sellCondition)
    strategy.entry("Sell", strategy.short, qty=positionSize)
    strategy.exit("Take Profit/Stop Loss Sell", from_entry="Sell", stop=stopLossSell, limit=close - takeProfitSell)
相关推荐