概述
该策略使用两条不同周期的简单移动平均线的交叉来判断趋势方向,在趋势出现时进行交易。同时,该策略还引入了一个期望值面板,用于计算和展示该策略在不同时间尺度下的期望收益,以便用户更好地评估策略性能。该期望值面板考虑了策略在历史时期内的胜率、平均盈利和平均亏损等关键指标,能够以直观的方式呈现策略在不同市场环境下的表现。
策略原理
该策略的核心是利用两条不同周期的简单移动平均线(本例中为14日和28日)的交叉来判断市场趋势。当短期均线从下向上穿过长期均线时,认为市场进入上升趋势,策略开仓做多;反之,当短期均线从上向下穿过长期均线时,认为市场进入下降趋势,策略开仓做空。通过这种方式,策略能够适应不同的市场趋势,在趋势出现时及时建仓,以获取趋势带来的收益。
除了基本的趋势判断和交易逻辑外,该策略还引入了一个期望值面板,用于计算和展示该策略在不同时间尺度(月度和年度)下的期望收益。期望值的计算基于策略在历史时期内的关键统计指标,包括: 1. 胜率:策略在该时间周期内的盈利次数占总交易次数的比例 2. 平均盈利:策略在该时间周期内所有盈利交易的平均盈利金额 3. 平均亏损:策略在该时间周期内所有亏损交易的平均亏损金额
利用这些指标,可以计算出策略在该时间周期下的期望值: 期望值 = 胜率 × 平均盈利 - (1 - 胜率)× 平均亏损
通过在图表上以热图的形式展示不同时间周期的期望值,用户可以一目了然地看出该策略在不同市场环境下的预期表现,从而更好地把握策略的适用性和风险。
优势分析
趋势适应性强:通过利用移动均线交叉来判断趋势,该策略能够在不同的市场趋势下及时调整仓位,以适应市场变化。这使得该策略在趋势性市场中能够取得较好的收益。
直观的性能评估:内置的期望值面板以热图的形式展示了该策略在不同时间周期下的期望收益,使用户能够一目了然地评估策略在不同市场环境下的表现。这种可视化的性能呈现方式为用户提供了更多的决策参考。
考虑了关键统计指标:期望值的计算不仅考虑了策略的胜率,还综合了平均盈利和平均亏损的影响。这种计算方式能够更全面、更准确地反映策略的实际表现,为用户提供更可靠的参考。
灵活的参数设置:用户可以根据需要灵活设置期望值面板的显示与否,以及面板的透明度。这使得用户能够根据自己的偏好来调整图表的显示效果,提高使用体验。
风险分析
震荡市中表现欠佳:由于该策略主要依赖趋势来获取收益,因此在震荡市或者趋势不明朗的市场环境下,频繁的交易可能会导致较大的滑点和交易成本,从而影响策略的整体表现。
期望值计算的局限性:尽管期望值面板提供了一种直观的策略性能评估方式,但它仍然基于历史数据进行计算。在市场发生重大变化或者出现极端行情时,历史数据可能无法很好地反映策略的实际表现,期望值的参考意义可能会有所降低。
参数的选择影响大:该策略的表现很大程度上取决于移动平均线的周期选择。不同的周期组合可能会带来完全不同的交易结果。如果选择的参数不能很好地适应市场特点,策略的实际表现可能会与期望值出现较大偏离。
优化方向
引入更多技术指标:在现有的移动平均线基础上,可以考虑引入其他技术指标如MACD、RSI等,以更好地判断趋势的强度和可持续性,从而提高策略的入场和出场时机。
优化仓位管理:目前策略在出现交易信号时采取了固定仓位的做法。可以考虑根据市场波动性、趋势强度等因素来动态调整仓位,以更好地控制风险和提高收益。
加入止盈止损机制:在策略中加入合理的止盈止损机制,可以帮助策略及时锁定已有收益,同时限制可能的亏损。这有助于提高策略的风险收益比,使其在各种市场环境下都能保持相对稳健的表现。
优化期望值的计算:可以进一步优化期望值的计算方法,例如考虑交易成本、引入移动窗口等,以提高期望值指标的有效性和实用性。此外,还可以探索其他的策略性能评估指标,为用户提供更全面的参考。
总结
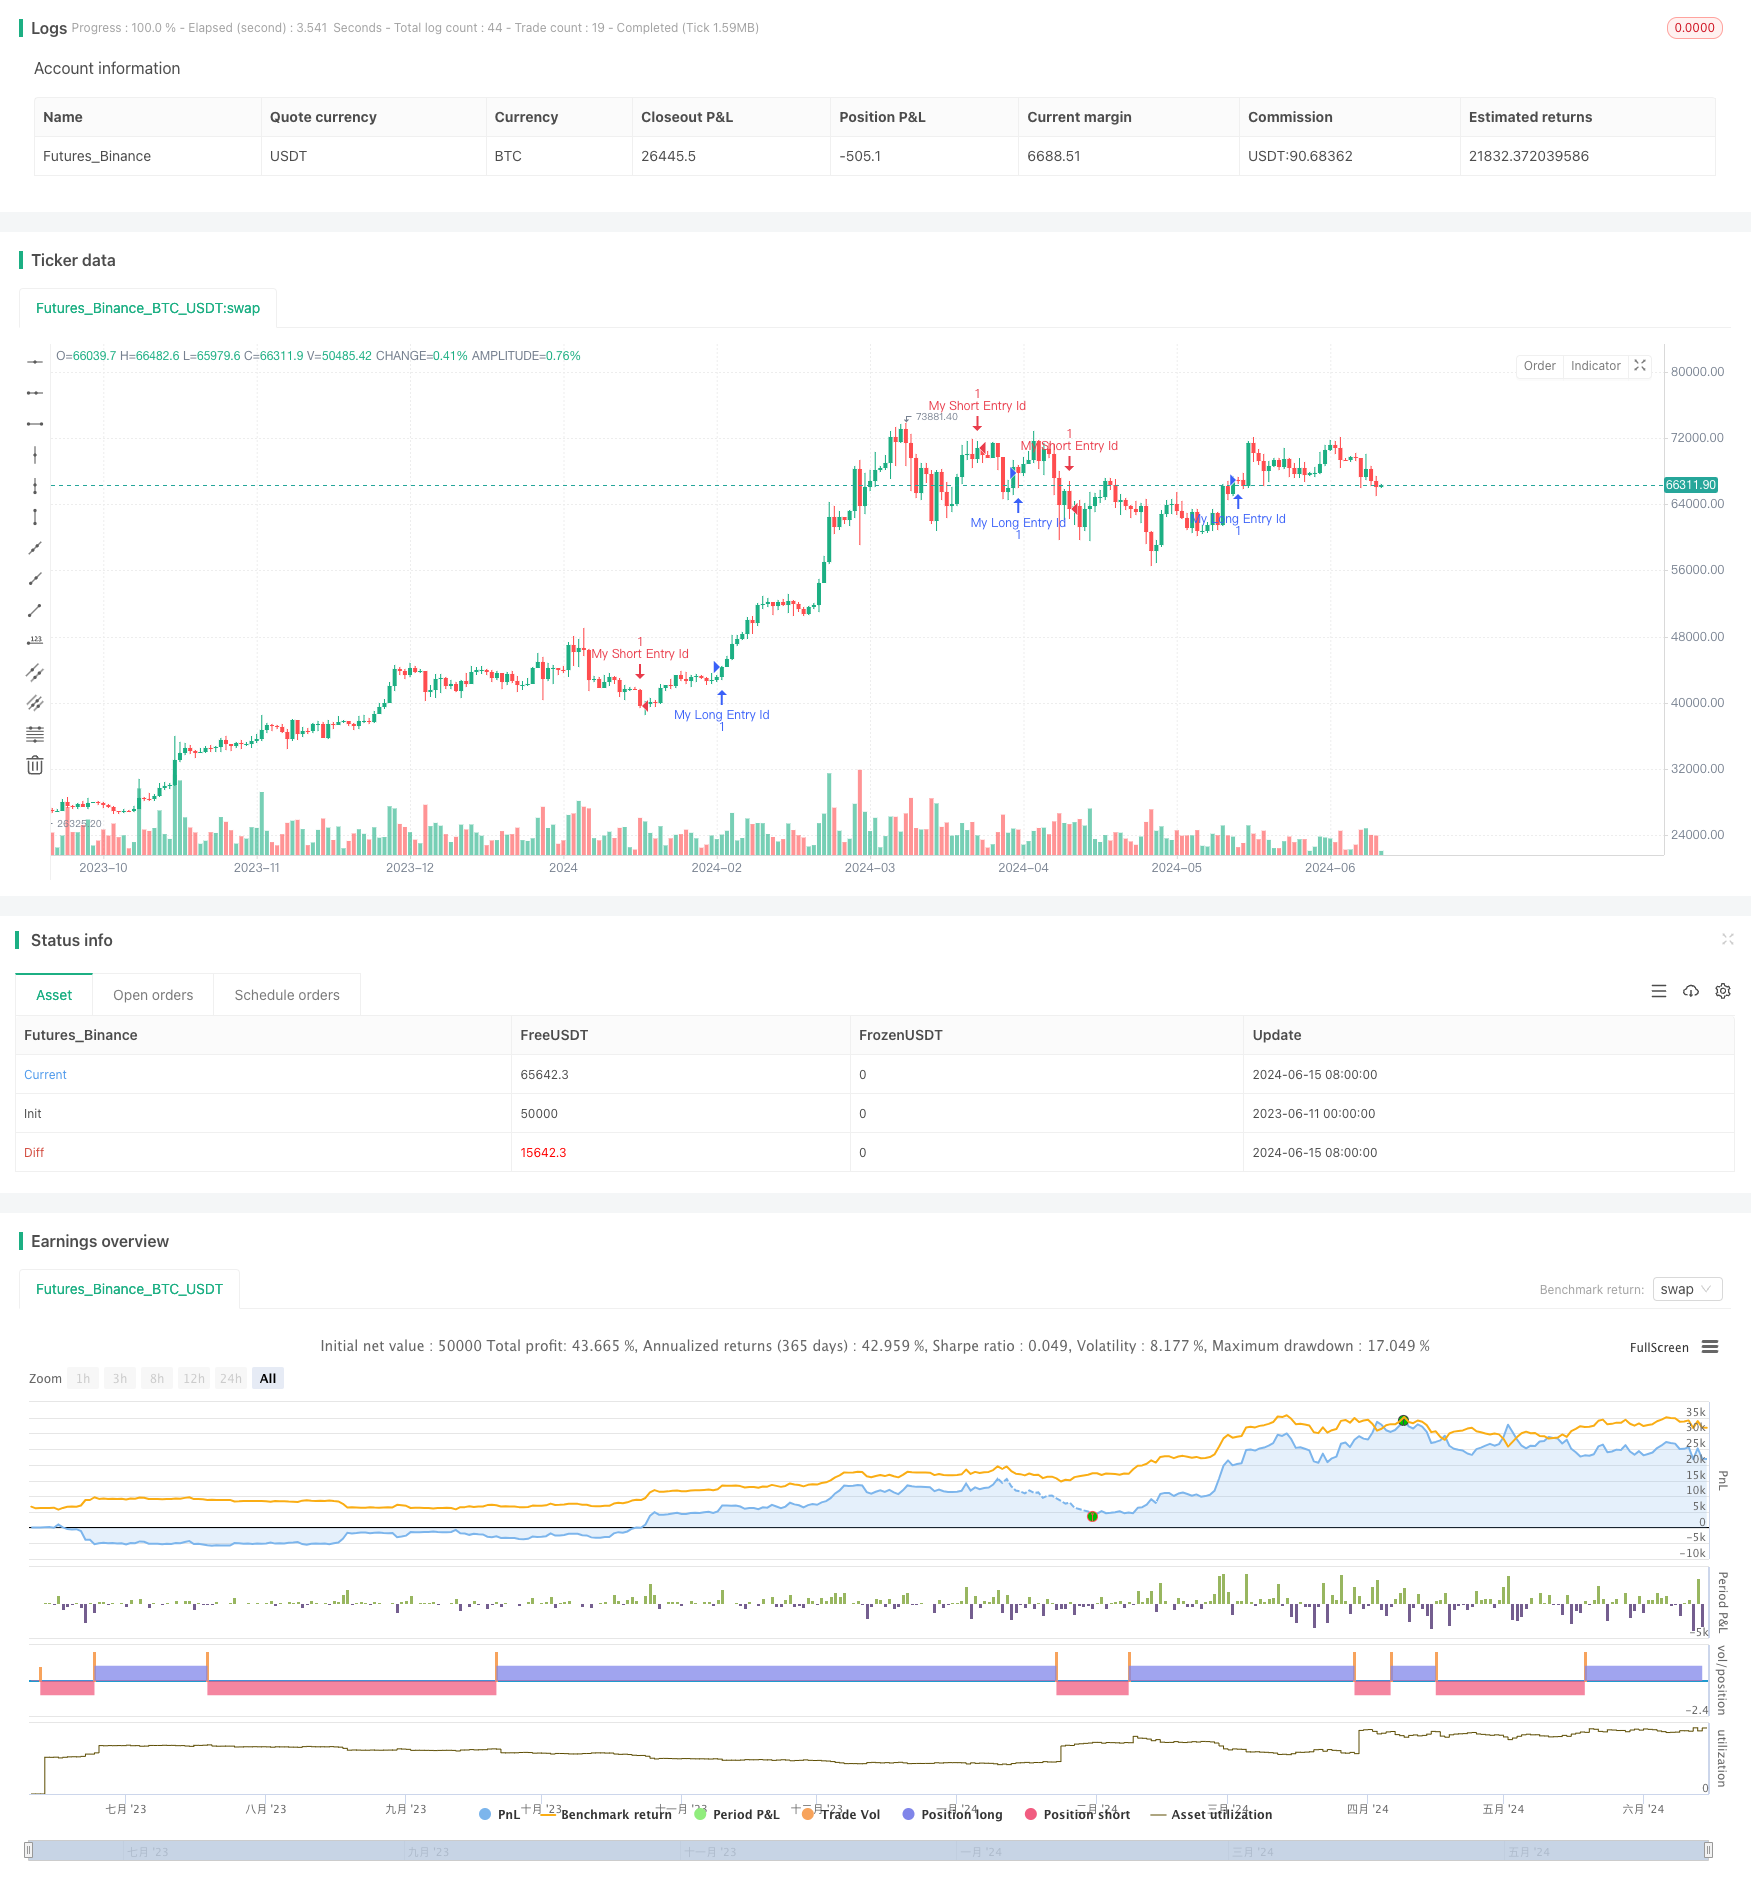
该策略通过利用移动平均线交叉来判断市场趋势,并在趋势出现时及时建仓,以获取趋势带来的收益。同时,策略还引入了一个直观的期望值面板,用于展示策略在不同时间尺度下的期望收益,为用户提供更多的决策参考。尽管该策略在震荡市中表现可能欠佳,且期望值计算存在一定局限性,但通过引入更多技术指标、优化仓位管理和加入止盈止损等措施,可以进一步提升策略的风险收益比,使其能够更好地适应多变的市场环境。
/*backtest
start: 2023-06-11 00:00:00
end: 2024-06-16 00:00:00
period: 1d
basePeriod: 1h
exchanges: [{"eid":"Futures_Binance","currency":"BTC_USDT"}]
*/

// This Pine Script™ code is subject to the terms of the Mozilla Public License 2.0 at https://mozilla.org/MPL/2.0/
// © ir0nantc2

//@version=5
strategy("Expected Value Panel", overlay=true)

// ロングエントリー条件 / Long entry condition
longCondition = ta.crossover(ta.sma(close, 14), ta.sma(close, 28))
if (longCondition)
    strategy.entry("My Long Entry Id", strategy.long)

// ショートエントリー条件 / Short entry condition
shortCondition = ta.crossunder(ta.sma(close, 14), ta.sma(close, 28))
if (shortCondition)
    strategy.entry("My Short Entry Id", strategy.short)


// ■■■■■■■■■■■■■■■■■■■■■■■■■■■■■■■■■■■■■■■■■■■■■■■■■■■■■■■■■■■■■■■■■■■■■■■■■■■■■■■■■■■■■■■■■■■■■■■■■■■■■■■
// Please copy the code below and paste it into the strategy where you want to display the expected value.
// 以下のコードをコピーして期待値を表示させたいストラテジーに貼り付けて下さい。
// ■■■■■■■■■■■■■■■■■■■■■■■■■■■■■■■■■■■■■■■■■■■■■■■■■■■■■■■■■■■■■■■■■■■■■■■■■■■■■■■■■■■■■■■■■■■■■■■■■■■■■■■

// 表示選択 / Display selection
show_performance = input.bool(true, '期待値ON/OFF (Show Expected Value)', group='Expected Value / ©ir0nantc2')
transparency = input.int(50, '透過度 (Transparency)', minval=0, maxval=100, group='Expected Value / ©ir0nantc2')
prec = 2

// 背景色 / Background color
bg_color(value) =>
    na(value) ? color.new(color.gray, transparency) : value > 0.0 ? color.new(color.green, transparency) :
   value < 0.0 ? color.new(color.red, transparency) :color.new(color.gray, transparency)

// 利益と損失の追跡 / Track profits and losses
var float total_monthly_profit = 0.0
var float total_yearly_profit = 0.0

if show_performance
    new_month = month(time) != month(time[1])
    new_year  = year(time)  != year(time[1])
    cur_month_pnl = 0.0, cur_year_pnl  = 0.0
    eq = strategy.equity
    bar_pnl = eq / eq[1] - 1

    // 月次・年次 期待値 / Monthly & Yearly Expected Value
    cur_month_pnl := new_month ? 0.0 : (1 + cur_month_pnl[1]) * (1 + bar_pnl) - 1
    cur_year_pnl := new_year ? 0.0 : (1 + cur_year_pnl[1]) * (1 + bar_pnl) - 1

    // 年次および月次期待値を格納 / Store monthly and yearly expected values
    var month_pnl  = array.new_float(), var month_time = array.new_int()
    var year_pnl  = array.new_float(), var year_time = array.new_int()

    // 期待値計算の変数 / Variables for expected value calculation
    var month_wins = array.new_int(), var month_losses = array.new_int()
    var month_avg_win = array.new_float(), var month_avg_loss = array.new_float()
    var year_wins = array.new_int(), var year_losses = array.new_int()
    var year_avg_win = array.new_float(), var year_avg_loss = array.new_float()

    // 月次および年次期待値の配列更新 / Update arrays for monthly and yearly expected values
    bool last_computed = false
    if (not na(cur_month_pnl[1]) and (new_month or barstate.islastconfirmedhistory))
        if (last_computed and array.size(month_pnl) > 0)
            array.pop(month_pnl), array.pop(month_time)
            array.pop(month_wins), array.pop(month_losses)
            array.pop(month_avg_win), array.pop(month_avg_loss)

        array.push(month_pnl, cur_month_pnl[1]), array.push(month_time, time[1])
        array.push(month_wins, 0), array.push(month_losses, 0)
        array.push(month_avg_win, 0.0), array.push(month_avg_loss, 0.0)

    if (not na(cur_year_pnl[1]) and (new_year or barstate.islastconfirmedhistory))
        if (last_computed and array.size(year_pnl) > 0)
            array.pop(year_pnl), array.pop(year_time)
            array.pop(year_wins), array.pop(year_losses)
            array.pop(year_avg_win), array.pop(year_avg_loss)

        array.push(year_pnl, cur_year_pnl[1]), array.push(year_time, time[1])
        array.push(year_wins, 0), array.push(year_losses, 0)
        array.push(year_avg_win, 0.0), array.push(year_avg_loss, 0.0)

    last_computed := barstate.islastconfirmedhistory ? true : last_computed

    // 勝ち取引と負け取引を追跡 / Track winning and losing trades
    if (strategy.closedtrades > 0 and na(strategy.closedtrades[1]) == false)
        closed_profit = strategy.netprofit - strategy.netprofit[1]
        if closed_profit > 0
            if array.size(month_wins) > 0
                wins = array.get(month_wins, array.size(month_wins) - 1) + 1
                avg_win = (array.get(month_avg_win, array.size(month_avg_win) - 1) * (wins - 1) + closed_profit) / wins
                array.set(month_wins, array.size(month_wins) - 1, wins)
                array.set(month_avg_win, array.size(month_avg_win) - 1, avg_win)
            if array.size(year_wins) > 0
                wins = array.get(year_wins, array.size(year_wins) - 1) + 1
                avg_win = (array.get(year_avg_win, array.size(year_avg_win) - 1) * (wins - 1) + closed_profit) / wins
                array.set(year_wins, array.size(year_wins) - 1, wins)
                array.set(year_avg_win, array.size(year_avg_win) - 1, avg_win)
        else
            if array.size(month_losses) > 0
                losses = array.get(month_losses, array.size(month_losses) - 1) + 1
                avg_loss = (array.get(month_avg_loss, array.size(month_avg_loss) - 1) * (losses - 1) + closed_profit) / losses
                array.set(month_losses, array.size(month_losses) - 1, losses)
                array.set(month_avg_loss, array.size(month_avg_loss) - 1, avg_loss)
            if array.size(year_losses) > 0
                losses = array.get(year_losses, array.size(year_losses) - 1) + 1
                avg_loss = (array.get(year_avg_loss, array.size(year_avg_loss) - 1) * (losses - 1) + closed_profit) / losses
                array.set(year_losses, array.size(year_losses) - 1, losses)
                array.set(year_avg_loss, array.size(year_avg_loss) - 1, avg_loss)

    // 月次テーブル / Monthly table
    var monthly_table = table(na)
    if (barstate.islastconfirmedhistory)
        monthly_table := table.new(position.bottom_right, columns = 14, rows = array.size(year_time) + 1, border_width = 1)
        table.cell(monthly_table, 0,  0, "",     bgcolor = #bbbbbb00)
        table.cell(monthly_table, 1,  0, "Jan",  bgcolor = #bbbbbb)
        table.cell(monthly_table, 2,  0, "Feb",  bgcolor = #bbbbbb)
        table.cell(monthly_table, 3,  0, "Mar",  bgcolor = #bbbbbb)
        table.cell(monthly_table, 4,  0, "Apr",  bgcolor = #bbbbbb)
        table.cell(monthly_table, 5,  0, "May",  bgcolor = #bbbbbb)
        table.cell(monthly_table, 6,  0, "Jun",  bgcolor = #bbbbbb)
        table.cell(monthly_table, 7,  0, "Jul",  bgcolor = #bbbbbb)
        table.cell(monthly_table, 8,  0, "Aug",  bgcolor = #bbbbbb)
        table.cell(monthly_table, 9,  0, "Sep",  bgcolor = #bbbbbb)
        table.cell(monthly_table, 10, 0, "Oct",  bgcolor = #bbbbbb)
        table.cell(monthly_table, 11, 0, "Nov",  bgcolor = #bbbbbb)
        table.cell(monthly_table, 12, 0, "Dec",  bgcolor = #bbbbbb)
        table.cell(monthly_table, 13, 0, "Year", bgcolor = #bbbbbb)

        // 年次データの集計 / Collecting yearly data
        var year_total_pnl = array.new_float()
        var year_exp_val = array.new_float()

        for yt = 0 to array.size(year_time) - 1
            total_year_wins = 0, total_year_losses = 0
            total_year_avg_win = 0.0, total_year_avg_loss = 0.0
            total_year_pnl = 0.0

            for mt = 1 to 12
                idx = -1
                for j = 0 to array.size(month_time) - 1
                    if year(array.get(month_time, j)) == year(array.get(year_time, yt)) and month(array.get(month_time, j)) == mt
                        idx := j
                        break
                if idx != -1
                    total_year_pnl := total_year_pnl + array.get(month_pnl, idx)
                    total_year_wins := total_year_wins + array.get(month_wins, idx)
                    total_year_losses := total_year_losses + array.get(month_losses, idx)
                    total_year_avg_win := total_year_avg_win + (array.get(month_avg_win, idx) * array.get(month_wins, idx))
                    total_year_avg_loss := total_year_avg_loss + (array.get(month_avg_loss, idx) * array.get(month_losses, idx))

            total_year_avg_win := total_year_wins > 0 ? total_year_avg_win / total_year_wins : 0.0
            total_year_avg_loss := total_year_losses > 0 ? total_year_avg_loss / total_year_losses : 0.0
            win_rate = total_year_wins + total_year_losses > 0 ? total_year_wins / (total_year_wins + total_year_losses) : na
            exp_val = win_rate ? (win_rate * total_year_avg_win) - ((1 - win_rate) * math.abs(total_year_avg_loss)) : na
            array.push(year_total_pnl, total_year_pnl)
            array.push(year_exp_val, exp_val)

        for yt = 0 to array.size(year_time) - 1
            table.cell(monthly_table, 0,  yt + 1, str.tostring(year(array.get(year_time, yt))), bgcolor = #bbbbbb)

            y_color = bg_color(array.get(year_exp_val, yt))
            value_to_display = na(array.get(year_exp_val, yt)) ? "" : str.tostring(math.round(array.get(year_exp_val, yt) * 100, prec))
            table.cell(monthly_table, 13, yt + 1, value_to_display, bgcolor = y_color, text_color=color.new(color.white, 0))

        for mt = 0 to array.size(month_time) - 1
            m_row = year(array.get(month_time, mt)) - year(array.get(year_time, 0)) + 1
            m_col = month(array.get(month_time, mt))

            if array.size(month_wins) > mt and array.size(month_losses) > mt and array.size(month_avg_win) > mt and array.size(month_avg_loss) > mt
                win_rate = array.get(month_wins, mt) / (array.get(month_wins, mt) + array.get(month_losses, mt))
                exp_val = (win_rate * array.get(month_avg_win, mt)) - ((1 - win_rate) * math.abs(array.get(month_avg_loss, mt)))
                m_color = bg_color(exp_val)
                value_to_display = na(exp_val) ? "" : str.tostring(math.round(exp_val * 100, prec))
                table.cell(monthly_table, m_col, m_row, value_to_display, bgcolor = m_color, text_color=color.new(color.white, 0))
            else
                table.cell(monthly_table, m_col, m_row, "", bgcolor = color.new(color.gray, transparency), text_color=color.new(color.white, 0))
// [EOF]