资源加载中... loading...

Dynamic Keltner Channel Momentum Reversal Strategy

Author: ChaoZhang, Date: 2024-07-26 15:02:39
Tags: KCATREMATA

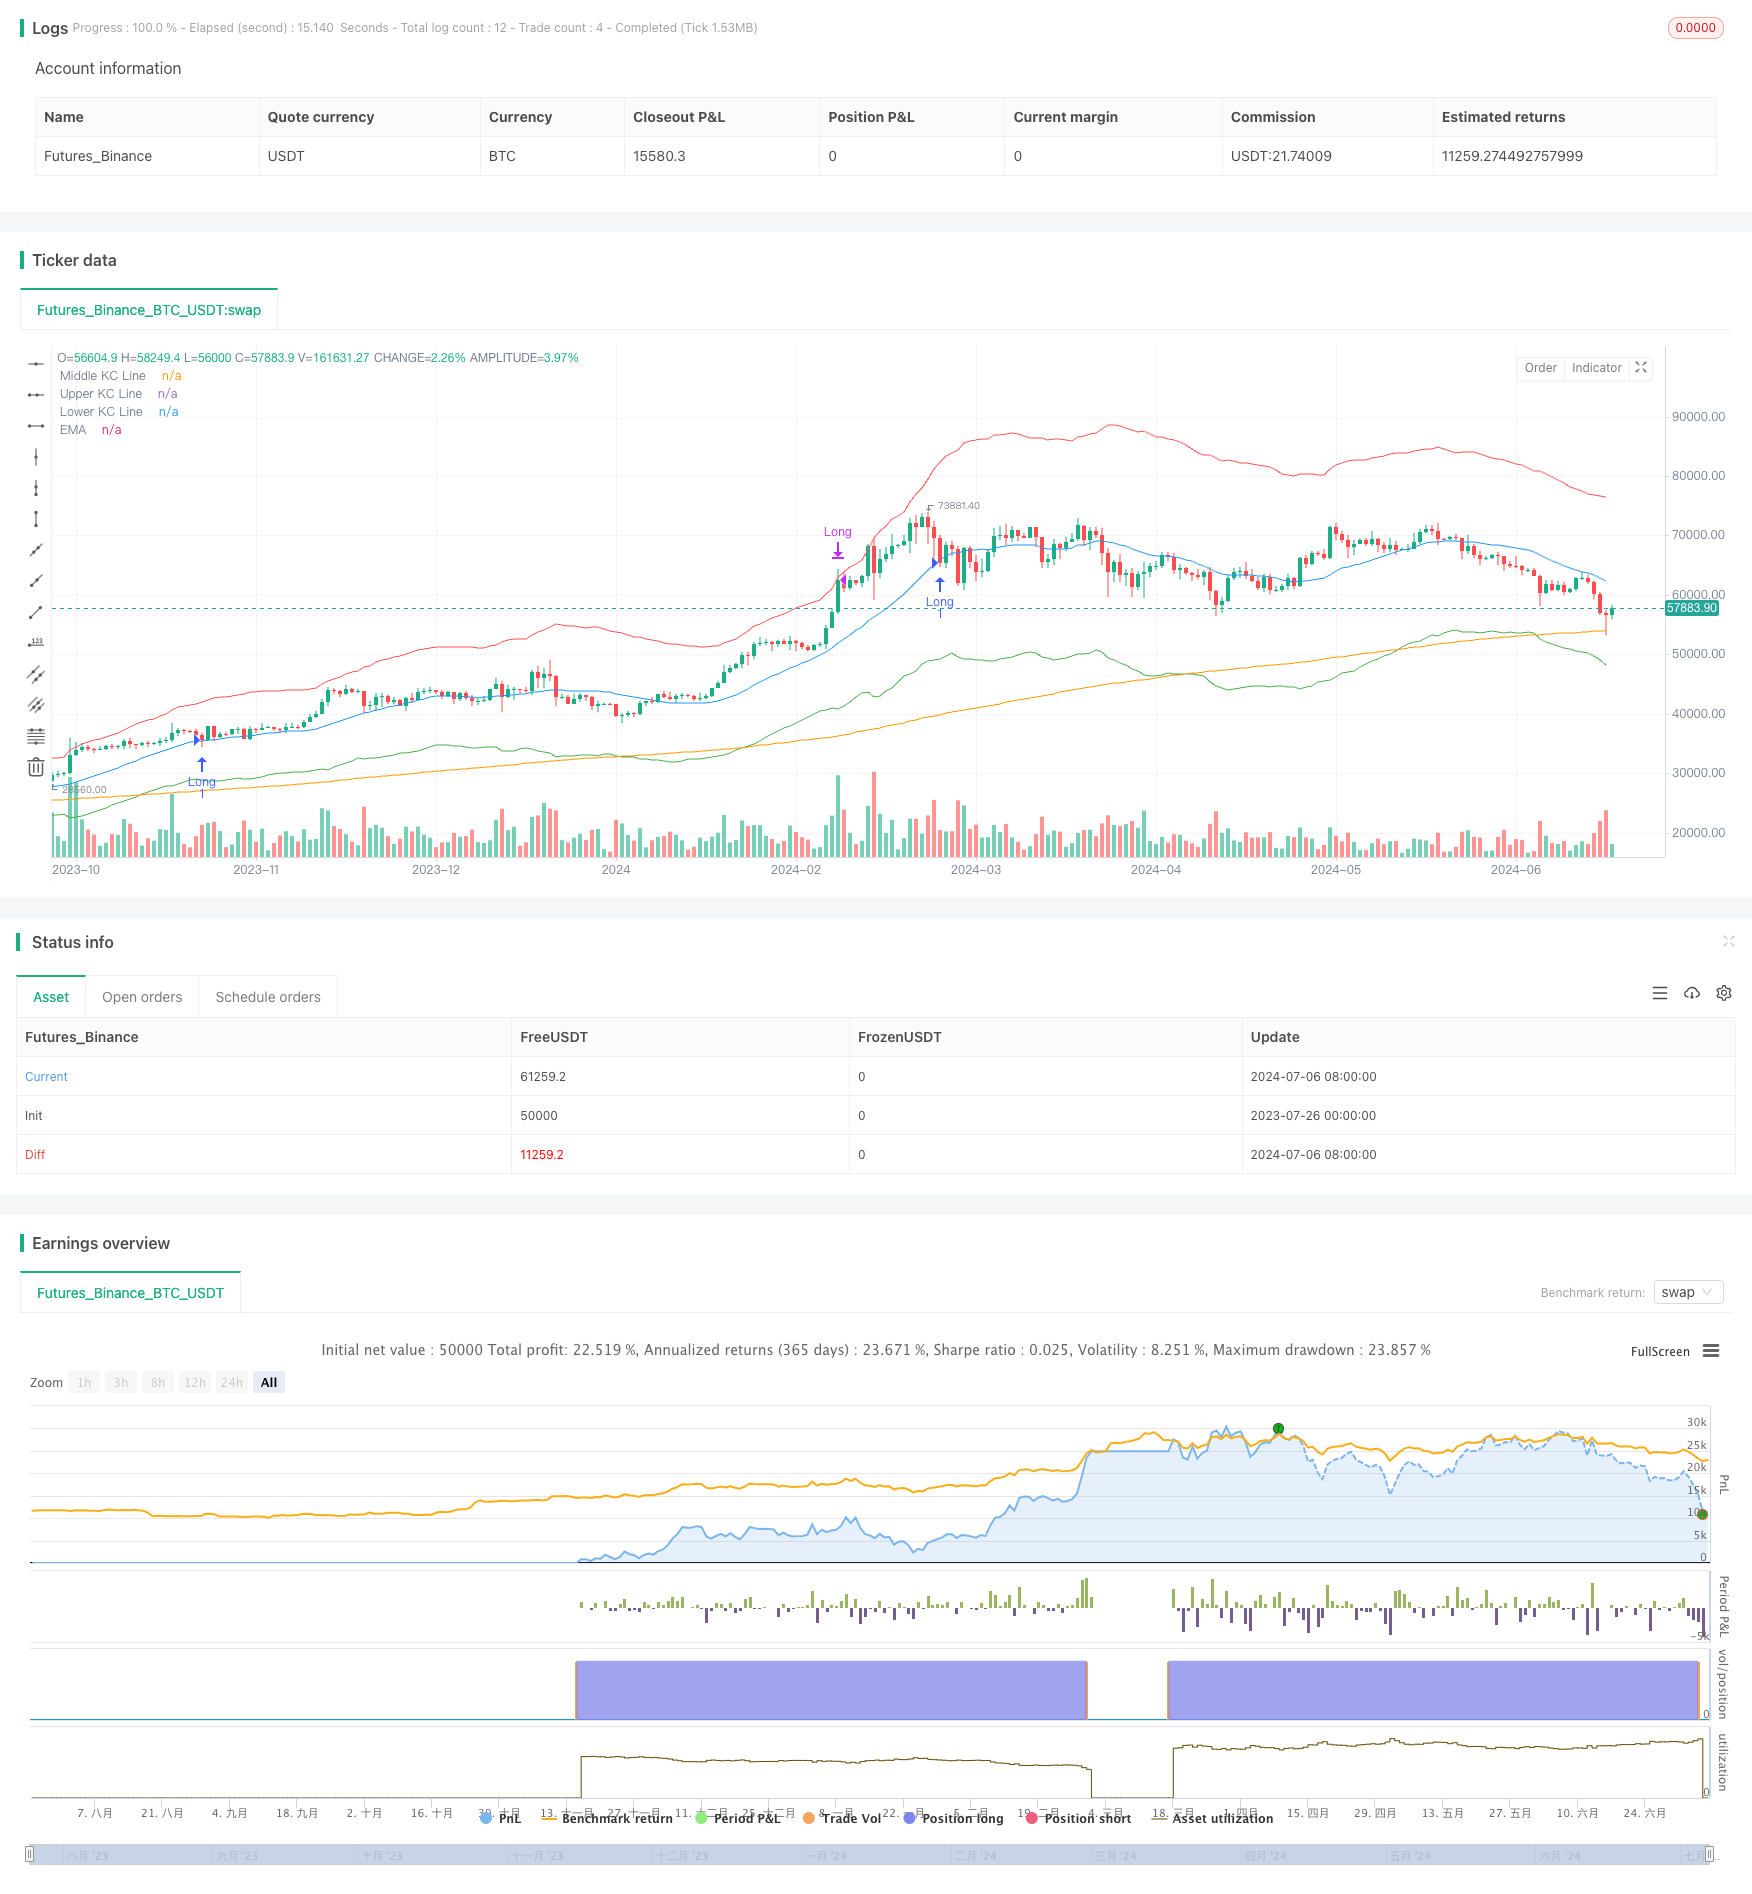
img

Overview

The Dynamic Keltner Channel Momentum Reversal Strategy is a sophisticated trading system that combines multiple technical indicators. This strategy primarily utilizes Keltner Channels, Exponential Moving Average (EMA), and Average True Range (ATR) to identify potential entry and exit points in the market. Its core idea is to capture momentum moves after a market pullback while incorporating trend-following elements.

The main components of the strategy include:

  1. Keltner Channels: Used to identify overbought and oversold conditions.
  2. Exponential Moving Average (EMA): Serves as a trend filter.
  3. Average True Range (ATR): Employed for dynamic stop-loss placement.

The strategy’s entry conditions are carefully designed, requiring the price to touch the outer band of the Keltner Channel, then pull back to the middle band, with the closing price above or below the EMA. This design aims to capture potential reversals or trend continuations after significant market movements.

Exit conditions are also based on the Keltner Channels, with the strategy automatically closing positions when the price reaches or exceeds the respective channel boundaries. Additionally, the strategy employs a dynamic stop-loss mechanism based on ATR, providing flexibility and adaptability to risk management.

Strategy Principles

The core principles of the Dynamic Keltner Channel Momentum Reversal Strategy can be broken down into the following key components:

  1. Keltner Channel Setup: The strategy uses a 20-period Simple Moving Average (SMA) as the basis for the Keltner Channel, with the channel width set to 6 times the ATR. This setup allows the channel to dynamically adapt to changes in market volatility.

  2. Trend Filtering: A 280-period EMA is used as a long-term trend indicator. This helps ensure that trade direction aligns with the overall market trend.

  3. Entry Conditions:

    • Long Entry: Requires the upper band to be touched within the past 120 periods, the current candle’s wick to touch the middle band, and the closing price to be above the EMA.
    • Short Entry: Requires the lower band to be touched within the past 120 periods, the current candle’s wick to touch the middle band, and the closing price to be below the EMA.
  4. Exit Conditions:

    • Long Exit: When the high price reaches or exceeds the upper band.
    • Short Exit: When the low price reaches or falls below the lower band.
  5. Risk Management: Uses a 35-period ATR to calculate dynamic stop-losses, with the stop distance set to 5.5 times the ATR. This method automatically adjusts stop levels based on market volatility.

The strategy’s design philosophy is to look for potential reversal or trend continuation opportunities after significant market movements (touching the outer Keltner Channel band). The middle band touch requirement helps confirm price pullbacks, while the EMA ensures trade direction aligns with the overall trend.

Strategy Advantages

  1. Multi-Indicator Synergy: Combining Keltner Channels, EMA, and ATR provides a comprehensive market analysis perspective, helping to reduce false signals.

  2. Dynamic Adaptability: By using ATR to set Keltner Channel width and stop-loss distances, the strategy can automatically adapt to volatility changes in different market conditions.

  3. Trend Confirmation: Utilizing EMA as an additional trend filter helps improve trade success rates and avoids counter-trend trading.

  4. Flexible Entry Mechanism: By requiring price to pull back to the middle band after touching the outer band, the strategy can capture potential reversal or trend continuation opportunities without entering too early or missing important trading opportunities.

  5. Clear Exit Strategy: The Keltner Channel-based exit conditions provide clear profit targets for trades, helping to lock in profits.

  6. Risk Management: The ATR-based dynamic stop-loss mechanism automatically adjusts stop levels based on market volatility, providing better risk control.

  7. Adjustable Parameters: The strategy offers multiple adjustable parameters, such as ATR length, Keltner Channel multiplier, and EMA length, allowing traders to optimize for different markets and timeframes.

  8. Concise Code Implementation: Despite the relatively complex strategy logic, the code implementation is clear and concise, making it easy to understand and maintain.

Strategy Risks

  1. Parameter Sensitivity: The strategy’s performance may be highly sensitive to parameter settings. Different market conditions may require different parameter settings, increasing the difficulty of strategy optimization and maintenance.

  2. Lagging Indicators: The use of moving averages and ATR may lead to signal lag, potentially missingimportant entry or exit opportunities in rapidly changing markets.

  3. False Breakout Risk: In ranging markets, prices may frequently touch the Keltner Channel boundaries, leading to excessive false signals.

  4. Trend Dependency: The strategy may perform better in strong trend markets but might face frequent stop-loss exits in oscillating markets.

  5. Over-optimization Risk: With multiple adjustable parameters, traders may fall into the trap of over-optimization, leading to poorer performance in live trading compared to backtests.

  6. Market Condition Changes: The strategy may perform well under specific market conditions but could significantly underperform when market characteristics change.

  7. Execution Risk: In actual trading, due to slippage and liquidity issues, it may not be possible to execute trades at the exact specified prices, which could affect overall strategy performance.

To mitigate these risks, consider the following measures:

  • Conduct thorough backtesting and forward testing on different markets and timeframes.
  • Use robust parameter optimization methods to avoid overfitting.
  • Consider adding additional filtering conditions, such as volume indicators, to reduce false signals.
  • Implement strict money management rules to limit risk exposure for each trade.
  • Regularly monitor and evaluate strategy performance, adjusting parameters or pausing trading as needed.

Strategy Optimization Directions

  1. Dynamic Parameter Adjustment: Consider introducing adaptive mechanisms to dynamically adjust the Keltner Channel multiplier and EMA length based on market volatility or trend strength. This can improve the strategy’s adaptability to different market conditions.

  2. Multi-Timeframe Analysis: Integrate trend information from higher timeframes, for example, considering weekly trends in a daily strategy. This can help improve the accuracy of trade direction.

  3. Volume Confirmation: Introduce volume indicators as additional confirmation signals. For instance, require above-average volume at entry to increase trade credibility.

  4. Market State Classification: Develop a market state classification system to distinguish between trending and oscillating markets. Use different parameter settings or trading rules for different market states.

  5. Profit-Taking Optimization: Consider implementing more sophisticated profit-taking strategies, such as trailing stops or partial profit-taking, to better balance risk and reward.

  6. Entry Optimization: Refine entry conditions, for example, by requiring a certain confirmation of rebound after touching the middle band, or adding momentum indicator confirmation.

  7. Machine Learning Integration: Explore using machine learning algorithms to optimize parameter selection or predict optimal entry times.

  8. Correlation Analysis: If using the strategy across multiple markets, consider adding correlation analysis to avoid excessive risk concentration.

  9. Event-Driven Factors: Integrate fundamental or event-driven filters, such as avoiding trades before and after important economic data releases.

  10. Drawdown Control: Add an overall drawdown control mechanism that automatically stops trading when the strategy reaches a preset maximum drawdown.

These optimization directions aim to improve the strategy’s robustness, adaptability, and overall performance. However, it’s crucial to thoroughly test and validate any optimizations before implementation to ensure they truly bring substantial performance improvements.

Conclusion

The Dynamic Keltner Channel Momentum Reversal Strategy is a carefully designed trading system that cleverly combines multiple technical indicators to capture potential reversals and trend continuation opportunities in the market. By leveraging Keltner Channels, EMA, and ATR, this strategy not only identifies potential entry points but also provides a dynamic risk management mechanism.

The core strength of the strategy lies in its dynamic adaptability and multi-faceted market analysis approach. By requiring price to pull back to the middle band after touching the outer band, combined with EMA trend confirmation, the strategy can capture significant market movements while maintaining a relatively high success rate. Furthermore, the ATR-based dynamic stop-loss mechanism provides flexibility in risk control.

However, the strategy also faces potential risks such as parameter sensitivity and challenges brought by changing market conditions. To address these risks, we have proposed several optimization directions, including dynamic parameter adjustment, multi-timeframe analysis, and volume confirmation. These optimization suggestions aim to further enhance the strategy’s robustness and adaptability.

Overall, the Dynamic Keltner Channel Momentum Reversal Strategy provides traders with a structured approach to analyzing and participating in the market. Through continuous monitoring, testing, and optimization, this strategy has the potential to become a reliable trading tool. However, like all trading strategies, it is not a one-size-fits-all solution. Traders should implement and manage this strategy prudently, taking into account their own risk tolerance and trading objectives.


/*backtest
start: 2023-07-26 00:00:00
end: 2024-07-07 05:20:00
period: 1d
basePeriod: 1h
exchanges: [{"eid":"Futures_Binance","currency":"BTC_USDT"}]
*/

//@version=5
strategy("Keltner Channel Pullback and Entry Strategy", overlay=true)

// Input settings
atrLength = input(35, "ATR Length")
atrMultiplier = input(5.5, "ATR Multiplier for Stop Loss")
kcLength = input(20, "Keltner Channel Length")
kcMultiplier = input(6.0, "Keltner Channel Multiplier")
emaLength = input(280, "EMA Length")
candleLookback = input(120, "Candle Lookback for Keltner Channel Touch")

// ATR for stop loss calculation
atr = ta.atr(atrLength)

// Keltner Channel
basis = ta.sma(close, kcLength)
kcRange = kcMultiplier * atr
upperKC = basis + kcRange
lowerKC = basis - kcRange

// EMA Trend Filter
ema = ta.ema(close, emaLength)

// Function to check if Keltner Channel was touched within the lookback period
wasKCTouched(direction) =>
    touched = false
    for i = 1 to candleLookback
        if direction == "long" and high[i] >= upperKC[i]
            touched := true
        if direction == "short" and low[i] <= lowerKC[i]
            touched := true
    touched

// Check for middle line touch by wick
middleLineTouchedByWick = high >= basis and low <= basis

// Entry Conditions
longCondition = wasKCTouched("long") and middleLineTouchedByWick and close > ema
shortCondition = wasKCTouched("short") and middleLineTouchedByWick and close < ema

// Exit Conditions
longExit = high >= upperKC
shortExit = low <= lowerKC

// Tracking the previous ATR value for stop loss calculation
var float prevAtr = na
if longCondition or shortCondition
    prevAtr := atr[1]

// Entry Execution
if longCondition
    strategy.entry("Long", strategy.long)
    strategy.exit("Exit Long", "Long", stop=close - atrMultiplier * prevAtr)

if shortCondition
    strategy.entry("Short", strategy.short)
    strategy.exit("Exit Short", "Short", stop=close + atrMultiplier * prevAtr)

// Exit Execution
if longExit and strategy.position_size > 0
    strategy.close("Long", when=barstate.isnew)

if shortExit and strategy.position_size < 0
    strategy.close("Short", when=barstate.isnew)

// Plotting
plot(basis, color=color.blue, title="Middle KC Line")
plot(upperKC, color=color.red, title="Upper KC Line")
plot(lowerKC, color=color.green, title="Lower KC Line")
plot(ema, color=color.orange, title="EMA")
template: strategy.tpl:40:21: executing "strategy.tpl" at <.api.GetStrategyListByName>: wrong number of args for GetStrategyListByName: want 7 got 6