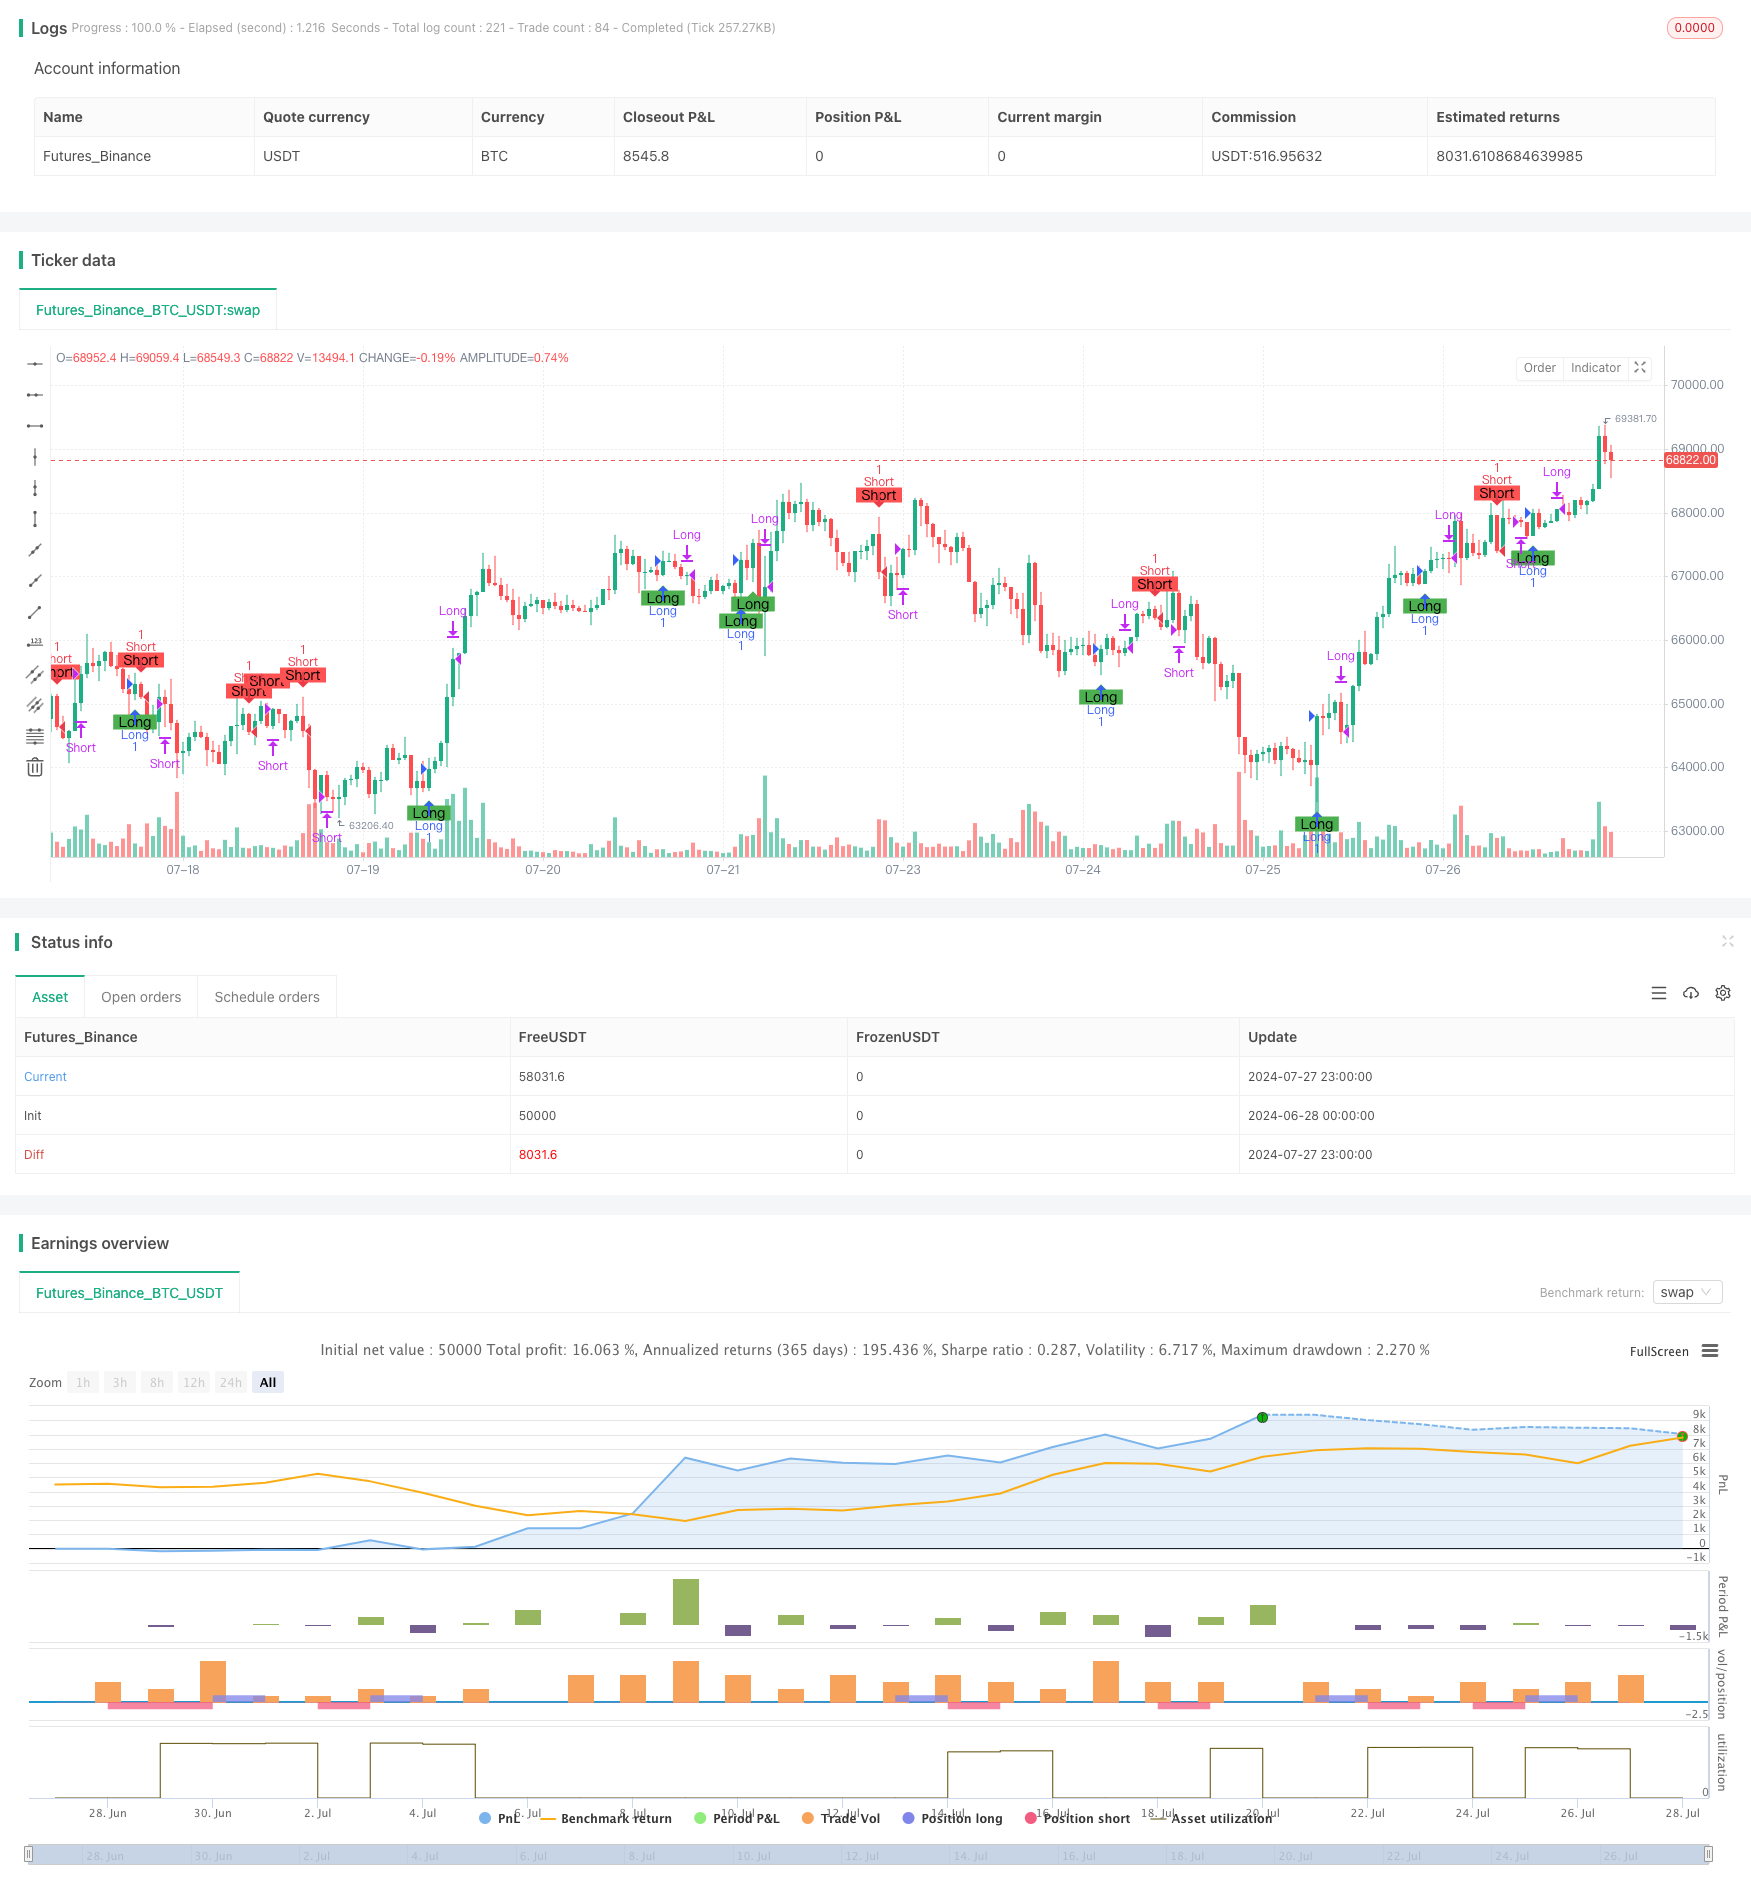
概述
动态自适应动量突破策略是一个利用自适应动量指标和蜡烛图形态识别的高级量化交易策略。该策略通过动态调整动量周期来适应市场波动,并结合多重过滤条件来识别高概率的趋势突破机会。策略的核心在于捕捉市场动量的变化,同时使用吞没形态作为入场信号,以提高交易的准确性和盈利能力。
策略原理
动态周期调整:
- 策略使用自适应动量指标,根据市场波动性动态调整计算周期。
- 在高波动期,周期缩短以快速响应市场变化;在低波动期,周期延长以避免过度交易。
- 周期范围设定在10到40之间,通过ATR指标判断波动状态。
动量计算与平滑:
- 使用动态周期计算动量指标。
- 可选择是否对动量进行EMA平滑处理,默认使用7周期EMA。
趋势方向判断:
- 通过计算动量斜率(当前值与前一个值的差)来确定趋势方向。
- 正斜率表示上升趋势,负斜率表示下降趋势。
吞没形态识别:
- 使用自定义函数识别看涨和看跌吞没形态。
- 考虑当前蜡烛和前一根蜡烛的开盘价、收盘价关系。
- 引入最小实体大小过滤,提高形态的可靠性。
交易信号生成:
- 多头信号:看涨吞没形态 + 正动量斜率。
- 空头信号:看跌吞没形态 + 负动量斜率。
交易管理:
- 信号确认后下一根K线开盘时入场。
- 固定持仓周期(默认3根K线)后自动平仓。
策略优势
自适应性强:
- 动态调整动量周期,适应不同市场环境。
- 在高波动期快速响应,低波动期避免过度交易。
多重确认机制:
- 结合技术指标(动量)和价格形态(吞没),提高信号可靠性。
- 使用斜率和实体大小过滤,减少虚假信号。
精确的入场时机:
- 利用吞没形态捕捉潜在的趋势反转点。
- 结合动量斜率,确保进入新兴趋势。
风险管理得当:
- 固定持仓周期,避免过度持有导致回撤。
- 实体大小过滤,降低小幅波动造成的误判。
灵活可定制:
- 多个可调参数,便于针对不同市场和时间框架优化。
- 可选的EMA平滑功能,平衡灵敏度和稳定性。
策略风险
假突破风险:
- 在横盘市场可能产生频繁的假突破信号。
- 缓解方法:增加额外的趋势确认指标,如移动平均线交叉。
滞后性问题:
- 使用EMA平滑可能导致信号滞后,错过最佳入场点。
- 缓解方法:调整EMA周期或考虑使用更敏感的平滑方法。
固定退出机制的局限性:
- 固定周期退出可能过早结束盈利趋势或延长亏损。
- 缓解方法:引入动态止盈止损,如跟踪止损或基于波动率的退出。
过度依赖单一时间框架:
- 策略可能忽视更大时间框架的整体趋势。
- 缓解方法:引入多时间框架分析,确保交易方向与更大趋势一致。
参数敏感性:
- 过多的可调参数可能导致过度拟合历史数据。
- 缓解方法:使用步进优化和跨样本测试来验证参数稳定性。
策略优化方向
多时间框架整合:
- 引入更大时间框架的趋势判断,只在主趋势方向交易。
- 原因:提高交易的整体成功率,避免逆大趋势操作。
动态止盈止损:
- 实现基于ATR或动量变化的动态止损。
- 使用跟踪止盈,最大化趋势利润。
- 原因:适应市场波动,保护利润,减少回撤。
volume profile分析:
- 整合volume profile,识别关键支撑阻力位。
- 原因:提高入场位置的精确度,避免在无效突破位置交易。
机器学习优化:
- 使用机器学习算法动态调整参数。
- 原因:实现策略的持续自适应,提高长期稳定性。
情绪指标整合:
- 引入市场情绪指标,如VIX或期权隐含波动率。
- 原因:在极端情绪时调整策略行为,避免过度交易。
相关性分析:
- 考虑多个相关资产的协同移动。
- 原因:提高信号可靠性,识别更强的市场趋势。
总结
动态自适应动量突破策略是一个结合了技术分析和量化方法的高级交易系统。通过动态调整动量周期、识别吞没形态,并结合多重过滤条件,该策略能够在不同市场环境下自适应地捕捉高概率的趋势突破机会。虽然存在一些固有风险,如假突破和参数敏感性,但通过提出的优化方向,如多时间框架分析、动态风险管理和机器学习应用,策略有潜力进一步提升其稳定性和盈利能力。总的来说,这是一个思路清晰、逻辑严密的量化策略,为交易者提供了一个强大的工具来把握市场动量和趋势变化。
策略源码
/*backtest
start: 2024-06-28 00:00:00
end: 2024-07-28 00:00:00
period: 1h
basePeriod: 15m
exchanges: [{"eid":"Futures_Binance","currency":"BTC_USDT"}]
*/

// This Pine Script™ code is subject to the terms of the Mozilla Public License 2.0 at https://mozilla.org/MPL/2.0/
// © ironperol
//@version=5
strategy("Adaptive Momentum Strategy", overlay=true, margin_long=100, margin_short=100)

// Input parameters for customization
src = input.source(close, title="Source")
min_length = input.int(10, minval=1, title="Minimum Length")
max_length = input.int(40, minval=1, title="Maximum Length")
ema_smoothing = input.bool(true, title="EMA Smoothing")
ema_length = input.int(7, title="EMA Length")
percent = input.float(2, title="Percent of Change", minval=0, maxval=100) / 100.0

// Separate body size filters for current and previous candles
min_body_size_current = input.float(0.5, title="Minimum Body Size for Current Candle (as a fraction of previous body size)", minval=0)
min_body_size_previous = input.float(0.5, title="Minimum Body Size for Previous Candle (as a fraction of average body size of last 5 candles)", minval=0)

close_bars = input.int(3, title="Number of Bars to Hold Position", minval=1) // User-defined input for holding period

//######################## Calculations ##########################

// Initialize dynamic length variable
startingLen = (min_length + max_length) / 2.0
var float dynamicLen = na
if na(dynamicLen)
    dynamicLen := startingLen

high_Volatility = ta.atr(7) > ta.atr(14)

if high_Volatility
    dynamicLen := math.max(min_length, dynamicLen * (1 - percent))
else
    dynamicLen := math.min(max_length, dynamicLen * (1 + percent))

momentum = ta.mom(src, int(dynamicLen))
value = ema_smoothing ? ta.ema(momentum, ema_length) : momentum

// Calculate slope as the difference between current and previous value
slope = value - value[1]

// Calculate body sizes
currentBodySize = math.abs(close - open)
previousBodySize = math.abs(close[1] - open[1])

// Calculate average body size of the last 5 candles
avgBodySizeLast5 = math.avg(math.abs(close[1] - open[1]), math.abs(close[2] - open[2]), math.abs(close[3] - open[3]), math.abs(close[4] - open[4]), math.abs(close[5] - open[5]))

//######################## Long Signal Condition ##########################

// Function to determine if the candle is a bullish engulfing
isBullishEngulfing() =>
    currentOpen = open
    currentClose = close
    previousOpen = open[1]
    previousClose = close[1]
    isBullish = currentClose >= currentOpen
    wasBearish = previousClose <= previousOpen
    engulfing = currentOpen <= previousClose and currentClose >= previousOpen
    bodySizeCheckCurrent = currentBodySize >= min_body_size_current * previousBodySize
    bodySizeCheckPrevious = previousBodySize >= min_body_size_previous * avgBodySizeLast5
    isBullish and wasBearish and engulfing and bodySizeCheckCurrent and bodySizeCheckPrevious

// Long signal condition
longCondition = isBullishEngulfing() and slope > 0

// Plotting long signals on chart
plotshape(series=longCondition, location=location.belowbar, color=color.green, style=shape.labelup, text="Long", title="Long Condition")

// Alerts for long condition
if (longCondition)
    alert("Long condition met", alert.freq_once_per_bar_close)

//######################## Short Signal Condition ##########################

// Function to determine if the candle is a bearish engulfing
isBearishEngulfing() =>
    currentOpen = open
    currentClose = close
    previousOpen = open[1]
    previousClose = close[1]
    isBearish = currentClose <= currentOpen
    wasBullish = previousClose >= previousOpen
    engulfing = currentOpen >= previousClose and currentClose <= previousOpen
    bodySizeCheckCurrent = currentBodySize >= min_body_size_current * previousBodySize
    bodySizeCheckPrevious = previousBodySize >= min_body_size_previous * avgBodySizeLast5
    isBearish and wasBullish and engulfing and bodySizeCheckCurrent and bodySizeCheckPrevious

// Short signal condition
shortCondition = isBearishEngulfing() and slope < 0

// Plotting short signals on chart
plotshape(series=shortCondition, location=location.abovebar, color=color.red, style=shape.labeldown, text="Short", title="Short Condition")

// Alerts for short condition
if (shortCondition)
    alert("Short condition met", alert.freq_once_per_bar_close)

//######################## Trading Logic ##########################

// Track the bar number when the position was opened
var int longEntryBar = na
var int shortEntryBar = na

// Enter long trade on the next candle after a long signal
if (longCondition and na(longEntryBar))
    strategy.entry("Long", strategy.long)
    longEntryBar := bar_index + 1

// Enter short trade on the next candle after a short signal
if (shortCondition and na(shortEntryBar))
    strategy.entry("Short", strategy.short)
    shortEntryBar := bar_index + 1

// Close long trades `close_bars` candles after entry
if (not na(longEntryBar) and bar_index - longEntryBar >= close_bars)
    strategy.close("Long")
    longEntryBar := na

// Close short trades `close_bars` candles after entry
if (not na(shortEntryBar) and bar_index - shortEntryBar >= close_bars)
    strategy.close("Short")
    shortEntryBar := na
相关推荐