资源加载中... loading...

High-Precision RSI and Bollinger Bands Breakout Strategy with Optimized Risk-Reward Ratio

Author: ChaoZhang, Date: 2024-07-29 15:38:55
Tags: RSIBBATRSMA

img

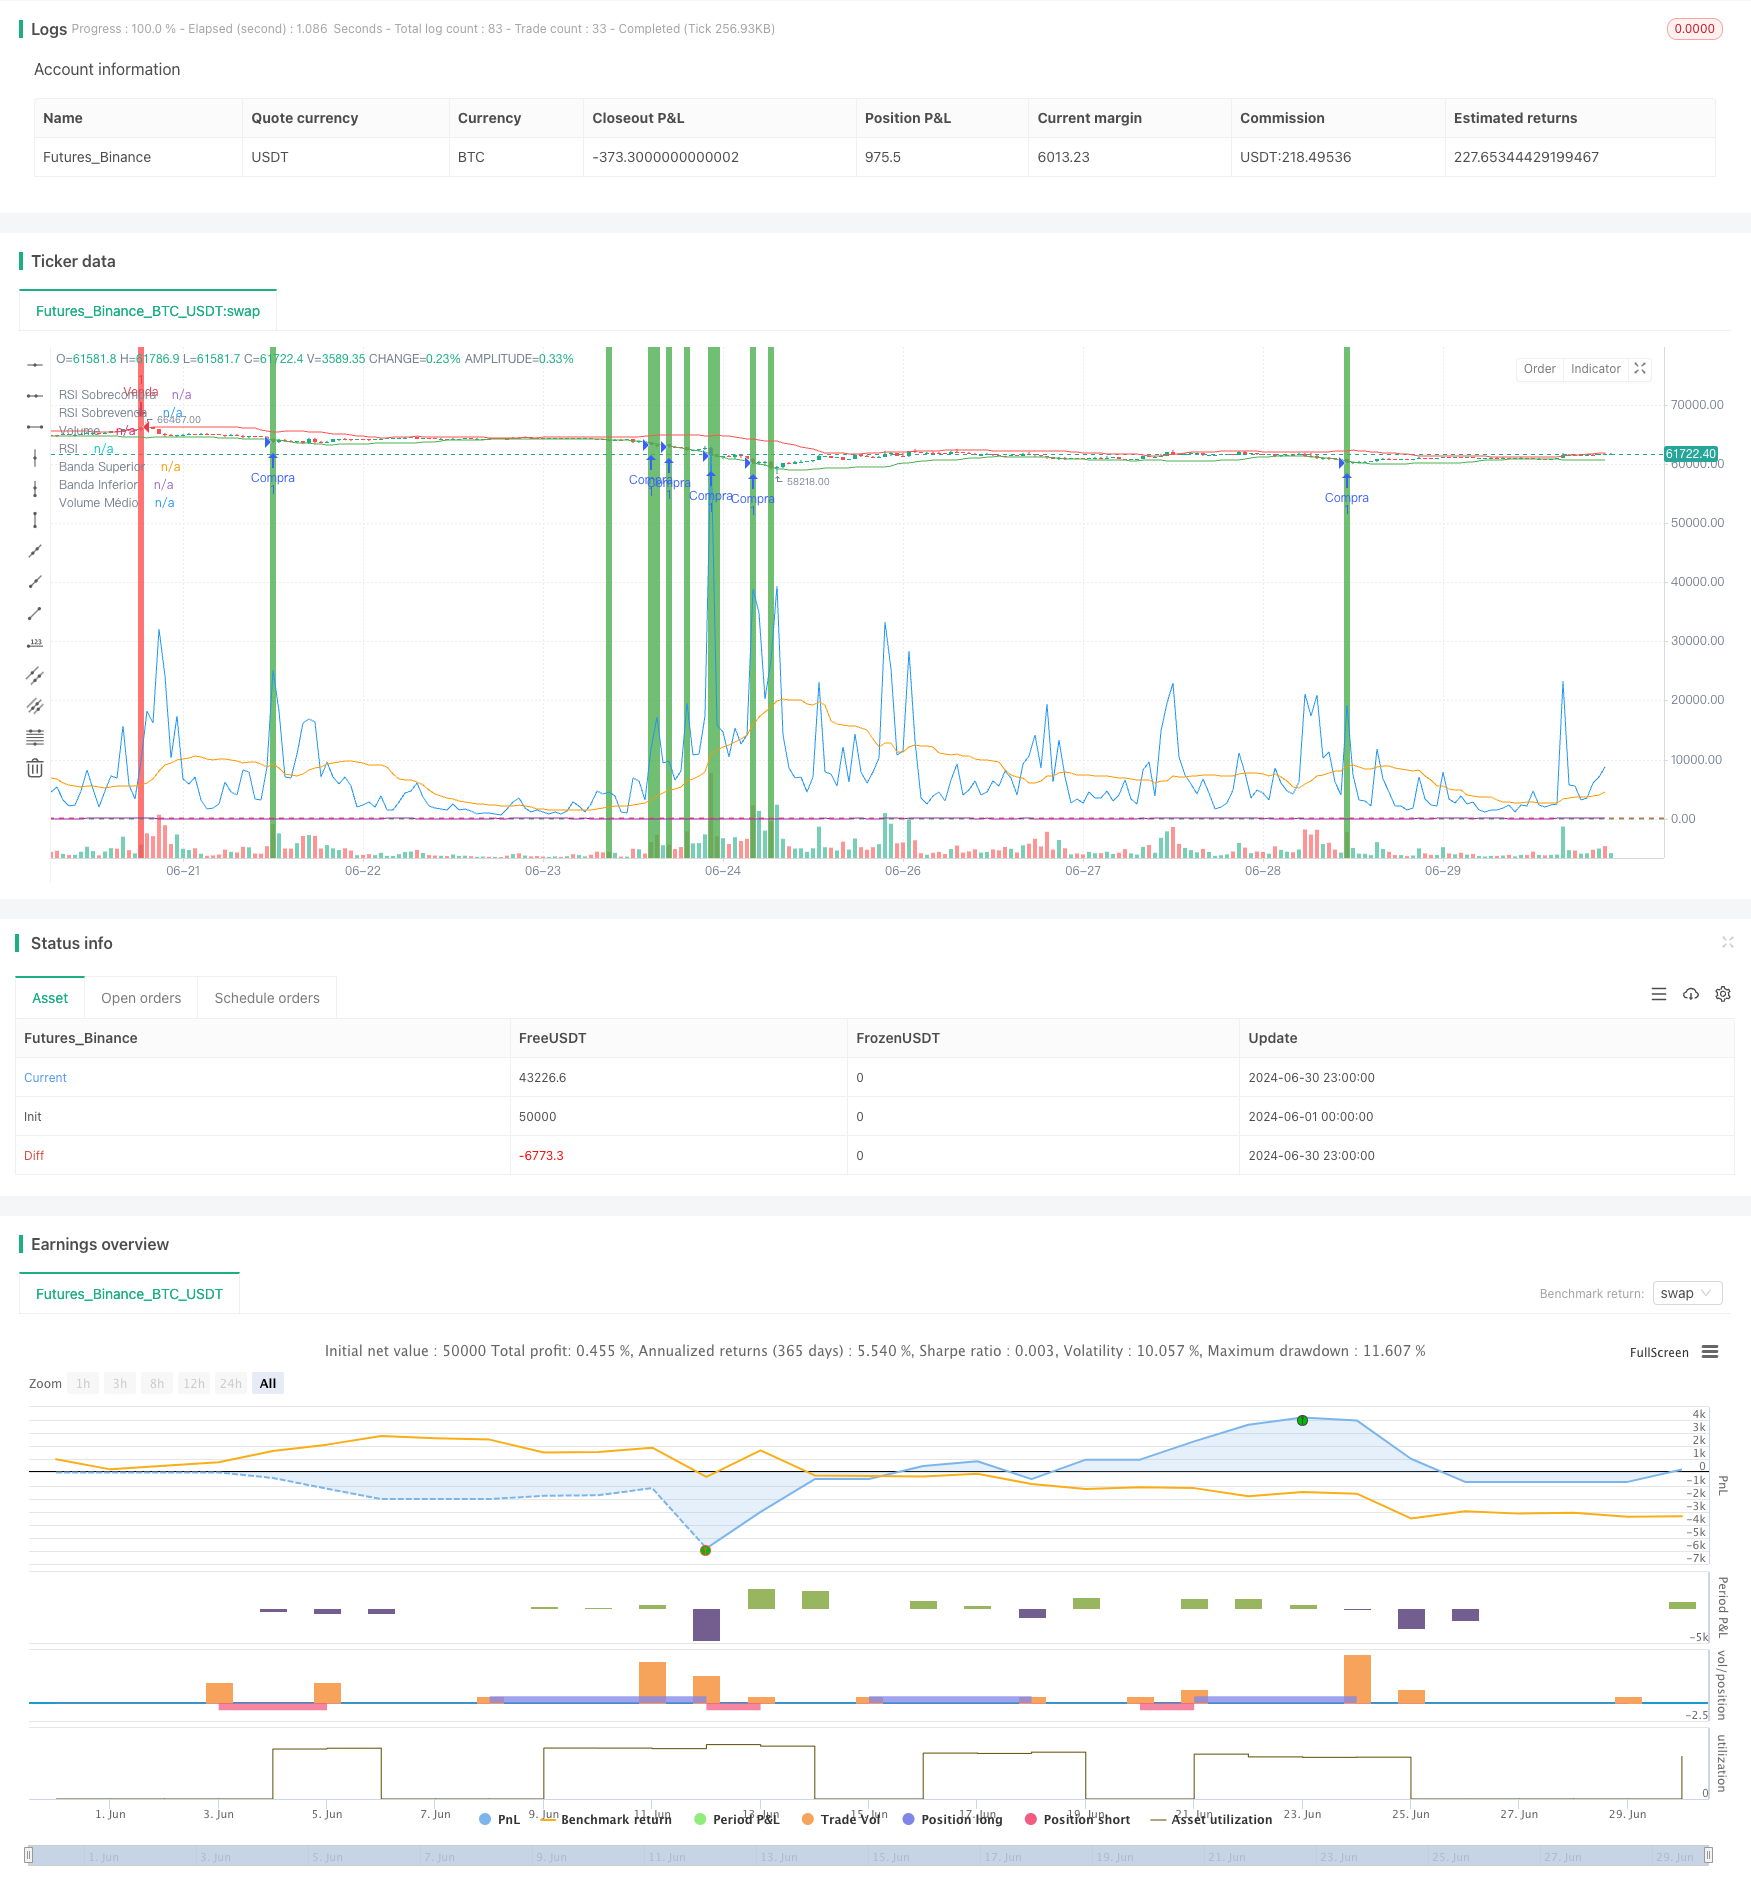
Overview

This strategy is a high-precision trading system based on the Relative Strength Index (RSI) and Bollinger Bands, designed to capture overbought and oversold market opportunities. The strategy utilizes RSI’s overbought and oversold levels, combined with Bollinger Bands’ price volatility range, while also considering trading volume to identify potential buy and sell signals. The strategy adopts a 1:5 risk-reward ratio, managing risk through stop-loss and take-profit levels based on the Average True Range (ATR).

Strategy Principles

The core logic of the strategy is based on the following key components:

  1. RSI Indicator: Uses a 14-period RSI to measure the overbought or oversold condition of an asset. An RSI below 30 is considered oversold, while above 70 is considered overbought.

  2. Bollinger Bands: Employs a 20-period Simple Moving Average (SMA) as the middle band, with a standard deviation multiplier of 2.0 to calculate the upper and lower bands. Price breaking below the lower band is seen as a potential buy signal, while breaking above the upper band is seen as a potential sell signal.

  3. Volume Confirmation: Uses a 20-period SMA of trading volume as the average volume. Current volume above the average is considered additional confirmation for trade signals.

  4. Entry Conditions:

    • Buy: RSI < 30, Closing price < Lower Bollinger Band, Volume > Average volume
    • Sell: RSI > 70, Closing price > Upper Bollinger Band, Volume > Average volume
  5. Risk Management: Uses stop-loss and take-profit levels based on the 14-period ATR. Stop-loss is set at 1x ATR, while take-profit is set at 5x ATR, achieving a 1:5 risk-reward ratio.

Strategy Advantages

  1. Multi-indicator Fusion: Combines RSI, Bollinger Bands, and volume to enhance signal reliability and accuracy.

  2. High-Precision Signals: Strict entry conditions reduce the probability of false signals, increasing trade success rate.

  3. Optimized Risk Management: Adopts a 1:5 risk-reward ratio, maintaining profitability even with relatively lower win rates.

  4. Market Volatility Adaptation: Uses ATR to dynamically adjust stop-loss and take-profit levels, allowing the strategy to adapt to different market environments.

  5. Visual Assistance: Intuitively displays buy and sell signals through background color changes, facilitating quick opportunity identification for traders.

  6. Flexibility: Strategy parameters are adjustable, allowing traders to optimize based on different markets and personal risk preferences.

Strategy Risks

  1. Overtrading: In ranging markets, the strategy may generate excessive trade signals, increasing transaction costs.

  2. False Breakouts: Price briefly breaking through Bollinger Bands but subsequently retracting may lead to erroneous trade signals.

  3. Trend Following Lag: In strongly trending markets, the strategy may miss initial significant price movements.

  4. Parameter Sensitivity: Strategy performance is sensitive to RSI and Bollinger Bands parameter selection; improper parameter settings may lead to performance degradation.

  5. Market Environment Dependency: Strategy performance may be suboptimal in low volatility or extremely volatile market environments.

To mitigate these risks, consider the following measures:

  • Introduce additional filters, such as trend indicators, to reduce false signals.
  • Use time filters to avoid trading during low volatility periods.
  • Regularly backtest and optimize parameters to adapt to different market environments.
  • Integrate other technical indicators or fundamental analysis to increase signal reliability.

Strategy Optimization Directions

  1. Dynamic Parameter Adjustment: Introduce adaptive mechanisms to dynamically adjust RSI and Bollinger Bands parameters based on market volatility. This can improve strategy adaptability across different market environments.

  2. Multi-Timeframe Analysis: Integrate signal confirmation from longer and shorter timeframes to enhance trading decision accuracy.

  3. Enhanced Volume Analysis: Introduce more complex volume analysis techniques, such as Volume Weighted Moving Average (VWMA), to better confirm price movements.

  4. Trend Filtering: Add trend indicators like Moving Average Convergence Divergence (MACD) or Directional Movement Index (DMI) to avoid overtrading in sideways markets.

  5. Machine Learning Optimization: Use machine learning algorithms to optimize parameter selection and signal generation, improving overall strategy performance.

  6. Risk Management Optimization: Implement dynamic risk-reward ratio adjustments, automatically modifying stop-loss and take-profit levels based on market volatility and recent trading performance.

  7. Sentiment Indicator Integration: Consider adding market sentiment indicators, such as the VIX fear index, to better capture market turning points.

These optimization directions aim to enhance the strategy’s robustness and adaptability while reducing the risk of false signals and overtrading. Through continuous backtesting and optimization, the overall performance of the strategy can be continuously improved.

Conclusion

The High-Precision RSI and Bollinger Bands Breakout Strategy with Optimized Risk-Reward Ratio is a complex trading system that combines multiple technical indicators. By integrating RSI’s overbought and oversold signals, Bollinger Bands’ price volatility range, and volume confirmation, this strategy aims to capture high-probability trading opportunities. The 1:5 risk-reward ratio setting reflects the strategy’s emphasis on risk management, while the ATR-based dynamic stop-loss and take-profit mechanism provides good adaptability to market volatility.

Although this strategy demonstrates numerous advantages, traders should remain vigilant against potential risks such as overtrading and false breakouts. By continuous parameter optimization, introducing additional filtering mechanisms, and integrating more technical and fundamental analysis, the strategy’s robustness and profitability can be further enhanced.

Ultimately, this strategy provides traders with a solid foundation that can be customized and expanded based on individual trading styles and market views. Through ongoing practice, evaluation, and improvement, traders can gradually refine this strategy, turning it into a reliable trading tool.


/*backtest
start: 2024-06-01 00:00:00
end: 2024-06-30 23:59:59
period: 1h
basePeriod: 15m
exchanges: [{"eid":"Futures_Binance","currency":"BTC_USDT"}]
*/

//@version=5
strategy("Estratégia de Alta Acertividade com R/R 1:5", overlay=true)

// Parâmetros do RSI e Bollinger Bands
rsi_length = input.int(14, title="Período do RSI")
rsi_overbought = input.int(70, title="Nível de Sobrecompra do RSI")
rsi_oversold = input.int(30, title="Nível de Sobrevenda do RSI")
bb_length = input.int(20, title="Período das Bandas de Bollinger")
bb_stddev = input.float(2.0, title="Desvio Padrão das Bandas de Bollinger")
tp_ratio = input.float(5.0, title="Take Profit Ratio (R/R)")
sl_ratio = input.float(1.0, title="Stop Loss Ratio (R/R)")

// Cálculo do RSI
rsi = ta.rsi(close, rsi_length)

// Cálculo das Bandas de Bollinger
basis = ta.sma(close, bb_length)
dev = bb_stddev * ta.stdev(close, bb_length)
upper_bb = basis + dev
lower_bb = basis - dev

// Cálculo do Volume Médio
avg_volume = ta.sma(volume, 20)

// Condições para Compra e Venda
buy_condition = (rsi < rsi_oversold) and (close < lower_bb) and (volume > avg_volume)
sell_condition = (rsi > rsi_overbought) and (close > upper_bb) and (volume > avg_volume)

// Definição do Take Profit e Stop Loss baseados no R/R
pip_size = syminfo.mintick
atr = ta.atr(14)
take_profit = atr * tp_ratio
stop_loss = atr * sl_ratio

// Execução da Estratégia de Compra
if (buy_condition)
    strategy.entry("Compra", strategy.long)
    strategy.exit("Take Profit/Stop Loss", "Compra", limit=close + take_profit, stop=close - stop_loss)

// Execução da Estratégia de Venda
if (sell_condition)
    strategy.entry("Venda", strategy.short)
    strategy.exit("Take Profit/Stop Loss", "Venda", limit=close - take_profit, stop=close + stop_loss)

// Plotagem das Bandas de Bollinger, RSI e Volume
plot(upper_bb, color=color.red, title="Banda Superior")
plot(lower_bb, color=color.green, title="Banda Inferior")
plot(rsi, color=color.purple, title="RSI")
hline(rsi_overbought, "RSI Sobrecompra", color=color.red, linestyle=hline.style_dashed)
hline(rsi_oversold, "RSI Sobrevenda", color=color.green, linestyle=hline.style_dashed)
plot(volume, color=color.blue, title="Volume")
plot(avg_volume, color=color.orange, title="Volume Médio")

// Estilo de fundo baseado na posição
bgcolor(buy_condition ? color.green : sell_condition ? color.red : na, transp=80)


Related

More