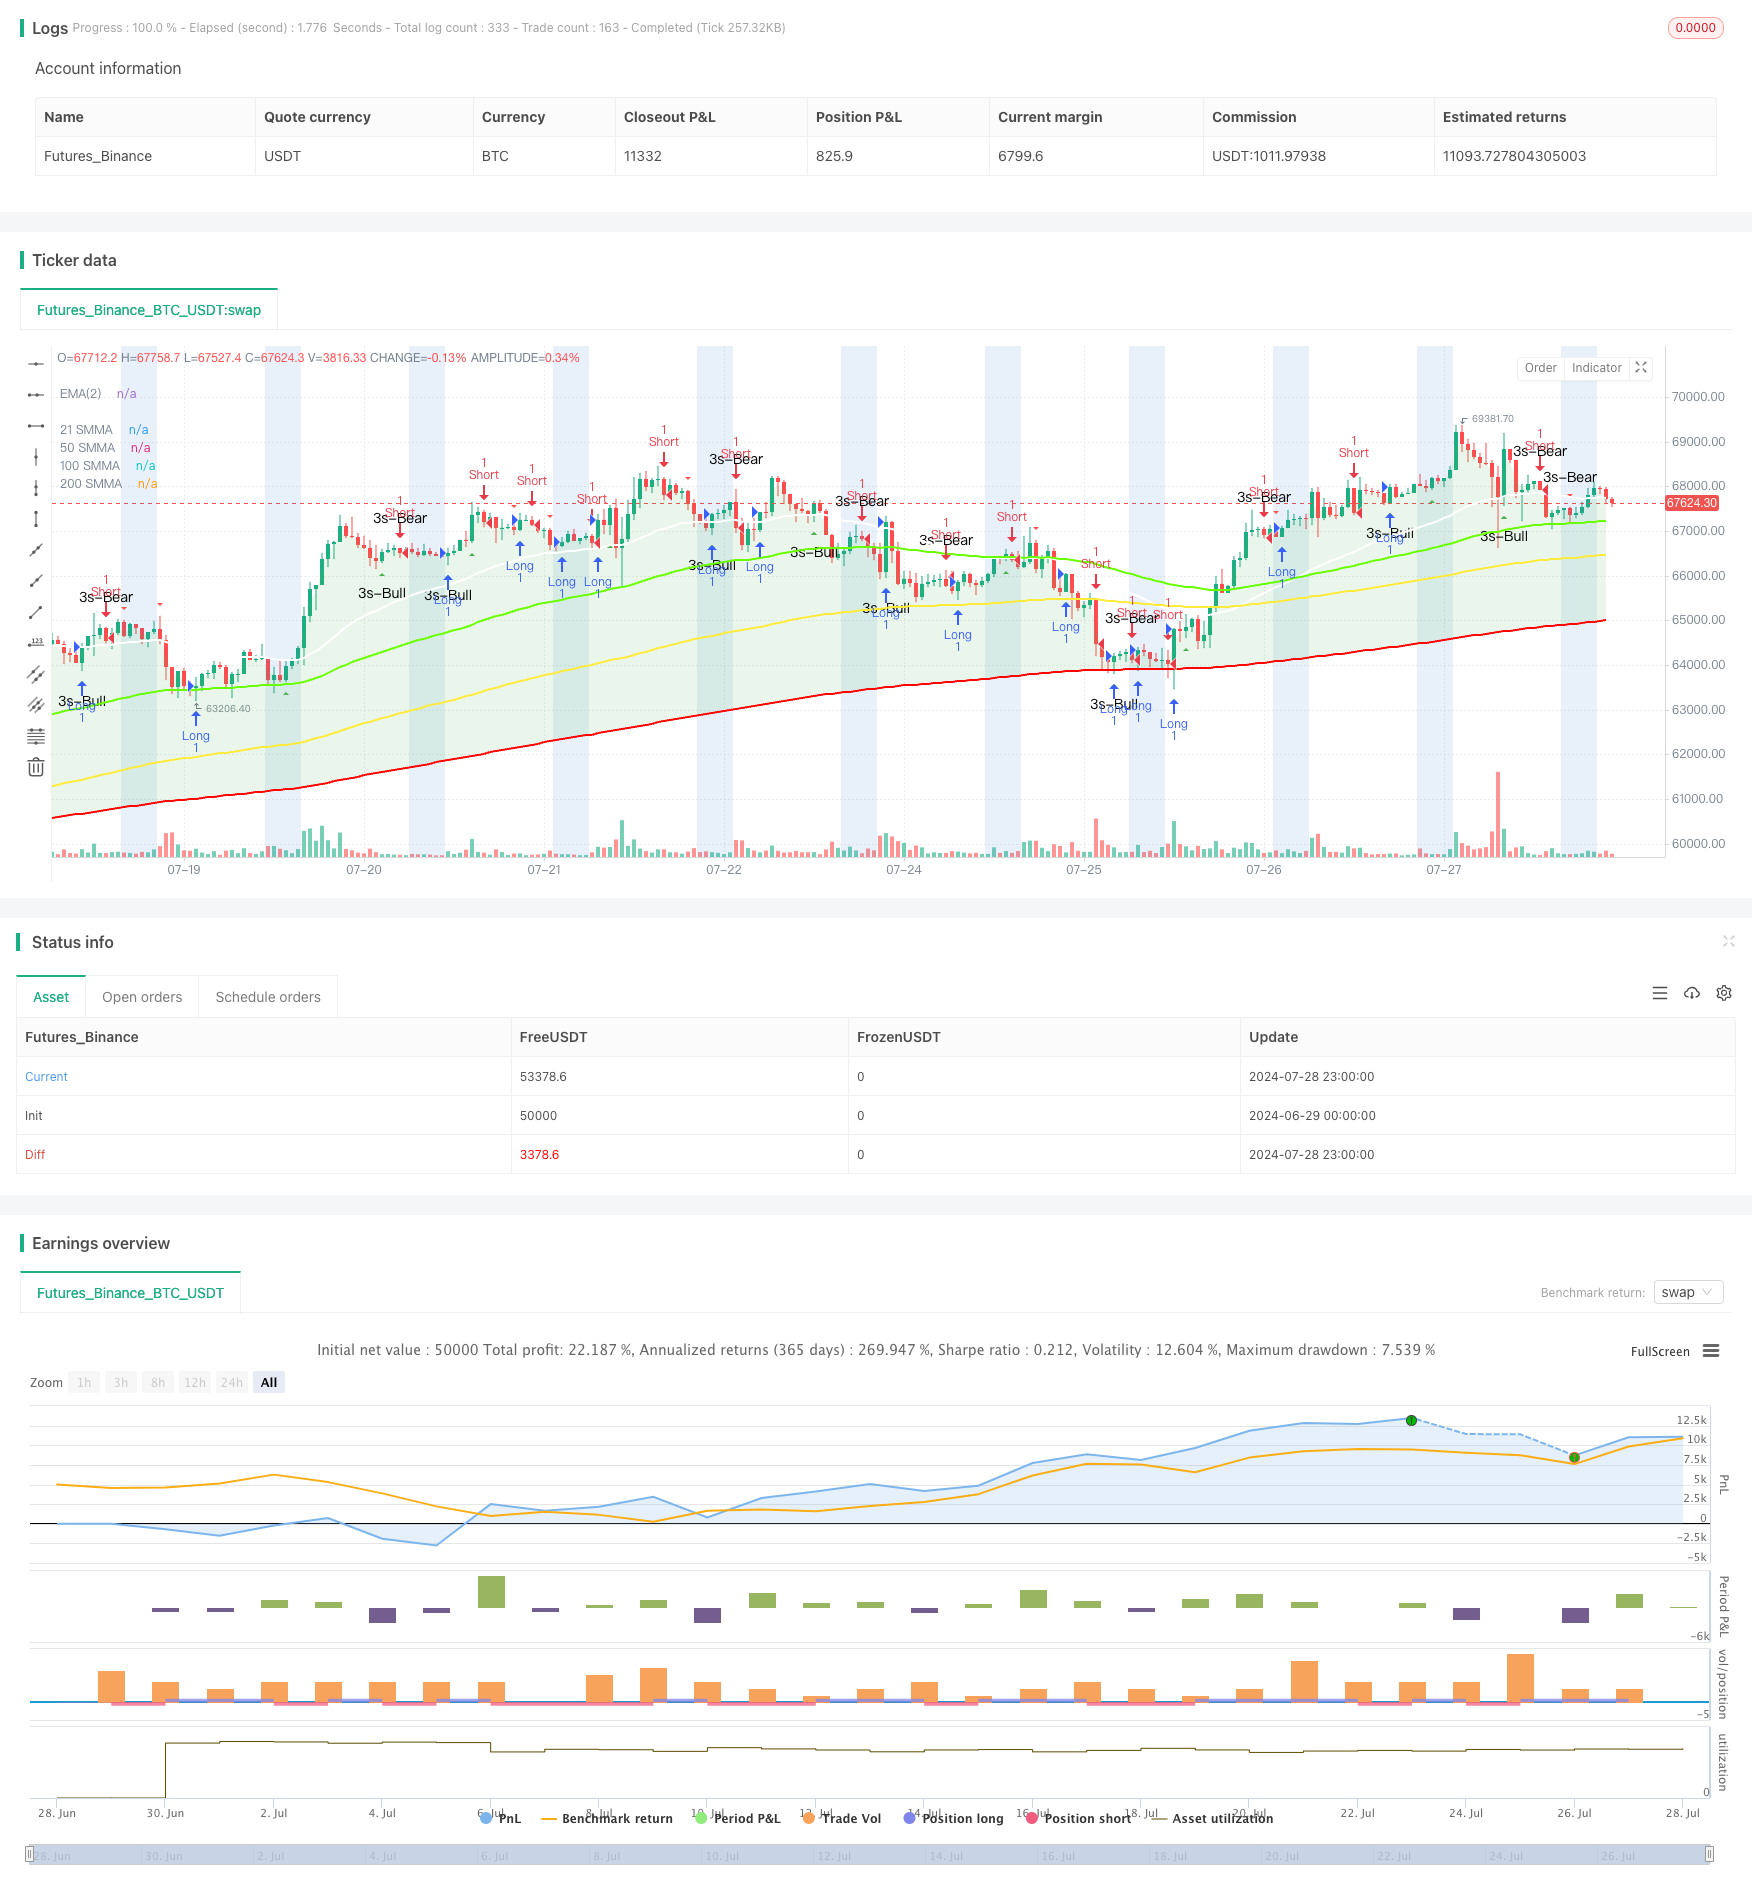
概述
这个策略是一个综合性的技术分析工具,结合了多重平滑移动平均线(SMMA)、趋势识别、蜡烛图形态识别和交易时段分析。它旨在帮助交易者识别市场趋势,发现潜在的反转点,并在特定的交易时段内执行交易。该策略的核心是使用不同周期的SMMA来判断市场方向,同时利用”3 Line Strike”和”吞没形态”这两种蜡烛图形态来生成交易信号。
策略原理
多重平滑移动平均线(SMMA):策略使用了4条SMMA(21期、50期、100期和200期),以不同的时间框架来评估市场趋势。这些均线可以帮助交易者理解短期、中期和长期的市场走势。
趋势填充:策略通过比较短期价格(2期EMA)与200期SMMA的关系,用颜色填充背景来直观显示当前趋势。绿色背景表示看涨趋势,红色背景表示看跌趋势。
蜡烛图形态识别:
- “3 Line Strike”形态:识别连续三根同向蜡烛后出现的反转蜡烛,可能预示趋势逆转。
- 吞没形态:识别完全吞没前一根蜡烛的大型蜡烛,也可能预示趋势逆转。
交易时段分析:允许用户定义特定的交易时段,并在图表上高亮显示这些时段。这有助于交易者专注于最活跃的交易时间。
交易信号生成:
- 做多信号:出现看涨的”3 Line Strike”或看涨吞没形态时触发。
- 做空信号:出现看跌的”3 Line Strike”或看跌吞没形态时触发。
策略优势
多维度分析:通过结合多个技术指标和分析方法,提供了全面的市场视角,有助于做出更informed的交易决策。
趋势确认:使用多个时间框架的SMMA,可以更准确地确认市场趋势,减少虚假信号。
反转识别:通过识别特定的蜡烛图形态,能够及早捕捉到潜在的市场反转,为交易者提供进场和出场的机会。
视觉直观:使用颜色填充和图形标记,使得市场状态和潜在信号一目了然,便于快速分析。
灵活性:允许用户自定义各种参数,如均线周期、交易时段等,以适应不同的交易风格和市场条件。
时间管理:通过高亮显示特定交易时段,帮助交易者更好地管理交易时间,集中精力于最具潜力的市场时段。
策略风险
滞后性:移动平均线本质上是滞后指标,在快速变化的市场中可能无法及时捕捉转折点。
过度依赖形态:过分依赖蜡烛图形态可能导致误判,因为并非所有形态都能准确预示市场反转。
假突破风险:在横盘市场中,价格可能频繁穿越均线,产生虚假信号。
参数敏感性:策略的表现很大程度上依赖于所选择的参数,不同市场条件下可能需要频繁调整。
忽视基本面:纯技术分析方法可能忽视重要的基本面因素,导致在重大新闻或事件发生时做出错误判断。
过度交易:在高波动性市场中,策略可能产生过多的交易信号,增加交易成本并可能导致过度交易。
为了降低这些风险,建议: - 结合其他技术指标和基本面分析来确认信号。 - 使用适当的止损和利润目标来管理风险。 - 在不同市场条件下back-test策略,找出最优参数。 - 考虑设置信号过滤器,减少虚假信号。 - 密切关注重要的经济数据发布和市场事件。
策略优化方向
动态参数调整:实现均线周期的自适应,根据市场波动性自动调整SMMA的周期,以适应不同的市场条件。
信号确认机制:引入额外的技术指标(如RSI、MACD等)来确认交易信号,提高信号的可靠性。
波动性过滤器:加入ATR(Average True Range)指标,在低波动性时期过滤掉弱信号,只在市场有足够动能时交易。
市场状态分类:开发一个算法来分类当前市场状态(趋势、横盘、高波动等),并针对不同状态采用不同的交易策略。
止损优化:实现动态止损,如使用ATR或最近的支撑/阻力水平来设置止损点,以better管理风险。
交易量分析:整合交易量数据,只有在交易量确认的情况下才执行交易信号,以提高信号的可靠性。
时间加权:根据历史数据分析不同时间段的成功率,对不同时间的信号赋予不同的权重。
机器学习集成:使用机器学习算法来优化参数选择和信号生成过程,提高策略的适应性和性能。
多时间框架分析:扩展策略以考虑多个时间框架的信号,确保交易方向与更大的市场趋势一致。
资金管理优化:实现动态的仓位大小调整,基于市场波动性和账户风险来决定每次交易的规模。
这些优化方向旨在提高策略的稳定性、适应性和整体性能。通过这些改进,策略可以更好地应对不同的市场环境,提高盈利能力并降低风险。
总结
“多重均线趋势跟踪与反转模式识别策略”是一个综合性的技术分析工具,结合了多种先进的交易技术。通过使用多重平滑移动平均线、趋势识别、蜡烛图形态分析和交易时段管理,该策略为交易者提供了一个全面的市场分析框架。它不仅能够帮助识别整体市场趋势,还能捕捉潜在的反转点,为交易决策提供valuable的参考。
策略的主要优势在于其多维度分析方法和视觉直观的表现形式,这使得交易者能够快速理解市场状态并做出informed的决策。然而,像所有的交易策略一样,它也面临着一些固有的风险,如滞后性和过度依赖技术指标等。
为了进一步提高策略的效果,可以考虑多个优化方向,包括动态参数调整、引入额外的确认机制、以及整合更advanced的技术如机器学习等。这些优化可以帮助策略更好地适应不同的市场环境,提高其稳定性和盈利能力。
最后,重要的是要记住,没有一个策略是万能的。成功的交易不仅依赖于好的策略,还需要严格的风险管理、持续的市场学习和对策略的不断refinement。交易者应该将这个策略作为他们整体交易系统的一部分,结合其他分析方法和个人的市场洞察来做出最终的交易决策。
/*backtest
start: 2024-06-29 00:00:00
end: 2024-07-29 00:00:00
period: 1h
basePeriod: 15m
exchanges: [{"eid":"Futures_Binance","currency":"BTC_USDT"}]
*/

//@version=5
strategy(title="TMA Overlay Strategy", shorttitle="TMA Overlay", overlay=true)

// ### Four Smoothed Moving Averages

len1 = input.int(21, minval=1, title="Length 1", group="Smoothed MA Inputs")
src1 = close
smma1 = 0.0
sma_1 = ta.sma(src1, len1)
smma1 := na(smma1[1]) ? sma_1 : (smma1[1] * (len1 - 1) + src1) / len1
plot(smma1, color=color.white, linewidth=2, title="21 SMMA")

len2 = input.int(50, minval=1, title="Length 2", group="Smoothed MA Inputs")
src2 = close
smma2 = 0.0
sma_2 = ta.sma(src2, len2)
smma2 := na(smma2[1]) ? sma_2 : (smma2[1] * (len2 - 1) + src2) / len2
plot(smma2, color=color.new(#6aff00, 0), linewidth=2, title="50 SMMA")

h100 = input.bool(true, title="Show 100 Line", group="Smoothed MA Inputs")
len3 = input.int(100, minval=1, title="Length 3", group="Smoothed MA Inputs")
src3 = close
smma3 = 0.0
sma_3 = ta.sma(src3, len3)
smma3 := na(smma3[1]) ? sma_3 : (smma3[1] * (len3 - 1) + src3) / len3
sma3plot = plot(h100 ? smma3 : na, color=color.new(color.yellow, 0), linewidth=2, title="100 SMMA")

len4 = input.int(200, minval=1, title="Length 4", group="Smoothed MA Inputs")
src4 = close
smma4 = 0.0
sma_4 = ta.sma(src4, len4)
smma4 := na(smma4[1]) ? sma_4 : (smma4[1] * (len4 - 1) + src4) / len4
sma4plot = plot(smma4, color=color.new(#ff0500, 0), linewidth=2, title="200 SMMA")

// Trend Fill
trendFill = input.bool(true, title="Show Trend Fill", group="Smoothed MA Inputs")
ema2 = ta.ema(close, 2)
ema2plot = plot(ema2, color=color.new(#2ecc71, 100), linewidth=1, title="EMA(2)", editable=false)
fill(ema2plot, sma4plot, color=color.new(ema2 > smma4 and trendFill ? color.green : color.red, 85), title="Trend Fill")

// End ###

// ### 3 Line Strike
bearS = input.bool(true, title="Show Bearish 3 Line Strike", group="3 Line Strike")
bullS = input.bool(true, title="Show Bullish 3 Line Strike", group="3 Line Strike")

bearSig = close[3] > open[3] and close[2] > open[2] and close[1] > open[1] and close < open[1]
bullSig = close[3] < open[3] and close[2] < open[2] and close[1] < open[1] and close > open[1]

plotshape(bullS ? bullSig : na, style=shape.triangleup, color=color.green, location=location.belowbar, size=size.small, text="3s-Bull", title="3 Line Strike Up")
plotshape(bearS ? bearSig : na, style=shape.triangledown, color=color.red, location=location.abovebar, size=size.small, text="3s-Bear", title="3 Line Strike Down")

// End ###

//### Engulfing Candles
bearE = input.bool(true, title="Show Bearish Big A$$ Candles", group="Big A$$ Candles")
bullE = input.bool(true, title="Show Bullish Big A$$ Candles", group="Big A$$ Candles")

openBarPrevious = open[1]
closeBarPrevious = close[1]
openBarCurrent = open
closeBarCurrent = close

bullishEngulfing = openBarCurrent <= closeBarPrevious and openBarCurrent < openBarPrevious and closeBarCurrent > openBarPrevious
bearishEngulfing = openBarCurrent >= closeBarPrevious and openBarCurrent > openBarPrevious and closeBarCurrent < openBarPrevious

plotshape(bullE ? bullishEngulfing : na, style=shape.triangleup, location=location.belowbar, color=color.green, size=size.tiny, title="Big Ass Candle Up")
plotshape(bearE ? bearishEngulfing : na, style=shape.triangledown, location=location.abovebar, color=color.red, size=size.tiny, title="Big Ass Candle Down")

alertcondition(bullishEngulfing, title="Bullish Engulfing", message="[CurrencyPair] [TimeFrame], Bullish candle engulfing previous candle")
alertcondition(bearishEngulfing, title="Bearish Engulfing", message="[CurrencyPair] [TimeFrame], Bearish candle engulfing previous candle")

// End ###

// ### Trading Session
ts = input.bool(true, title="Show Trade Session", group="Trade Session")

tzOffset = input.int(0, title="Timezone Offset (hours from UTC)", group="Trade Session")
label = input.string("CME Open", title="Label", tooltip="For easy identification", group="Trade Session")

startHour = input.int(7, title="Analysis Start Hour", minval=0, maxval=23, group="Trade Session")
startMinute = input.int(0, title="Analysis Start Minute", minval=0, maxval=59, group="Trade Session")

startHour2 = input.int(8, title="Session Start Hour", minval=0, maxval=23, group="Trade Session")
startMinute2 = input.int(30, title="Session Start Minute", minval=0, maxval=59, group="Trade Session")
endHour2 = input.int(12, title="Session End Hour", minval=0, maxval=23, group="Trade Session")
endMinute2 = input.int(0, title="Session End Minute", minval=0, maxval=59, group="Trade Session")

rangeColor = input.color(#1976d21f, title="Color", group="Trade Session")
showMon = input.bool(true, title="Monday", group="Trade Session")
showTue = input.bool(true, title="Tuesday", group="Trade Session")
showWed = input.bool(true, title="Wednesday", group="Trade Session")
showThu = input.bool(true, title="Thursday", group="Trade Session")
showFri = input.bool(true, title="Friday", group="Trade Session")
showSat = input.bool(false, title="Saturday", group="Trade Session")
showSun = input.bool(false, title="Sunday", group="Trade Session")

startTime = timestamp("UTC", year(time), month(time), dayofmonth(time), startHour - tzOffset, startMinute)
endTime = timestamp("UTC", year(time), month(time), dayofmonth(time), endHour2 - tzOffset, endMinute2)

active = (startTime <= time and time <= endTime and ts) and ((dayofweek == dayofweek.monday and showMon) or (dayofweek == dayofweek.tuesday and showTue) or (dayofweek == dayofweek.wednesday and showWed) or (dayofweek == dayofweek.thursday and showThu) or (dayofweek == dayofweek.friday and showFri) or (dayofweek == dayofweek.saturday and showSat) or (dayofweek == dayofweek.sunday and showSun))
bgcolor(color=active ? rangeColor : na, title="Session Background")

startTime2 = timestamp("UTC", year(time), month(time), dayofmonth(time), startHour2 - tzOffset, startMinute2)
endTime2 = timestamp("UTC", year(time), month(time), dayofmonth(time), endHour2 - tzOffset, endMinute2)

active2 = (startTime2 <= time and time <= endTime2 and ts) and ((dayofweek == dayofweek.monday and showMon) or (dayofweek == dayofweek.tuesday and showTue) or (dayofweek == dayofweek.wednesday and showWed) or (dayofweek == dayofweek.thursday and showThu) or (dayofweek == dayofweek.friday and showFri) or (dayofweek == dayofweek.saturday and showSat) or (dayofweek == dayofweek.sunday and showSun))
bgcolor(color=active2 ? rangeColor : na, title="Session Background")

// End ###

// Trading Strategy
longCondition = bullSig or bullishEngulfing
shortCondition = bearSig or bearishEngulfing

if (longCondition)
    strategy.entry("Long", strategy.long)

if (shortCondition)
    strategy.entry("Short", strategy.short)

// eof